

Abstract
The translocation of lipids across membranes (flip-flop) is an important biological process. Slow exchange on a physiological timescale allows the creation of asymmetric distributions of lipids across cellular membranes. The location of lipids and their rate of exchange have important biological consequences, especially for lipids involved in cellular signaling. We investigated the translocation of cholesterol, ceramide, and diacylglycerol in two model bilayers using molecular dynamics simulations. We estimate half times for flip-flop for cholesterol, diacylglycerol, and ceramide of 20 μs, 30 μs, and 10 ms in a POPC bilayer, compared with approximately 30 min, 30 ms, and 30 s in a model raft bilayer (1:1:1 PSM, POPC, and cholesterol). Cholesterol has a large (54 kJ/mol) free energy of exchange between the POPC and raft bilayer, and therefore, it strongly prefers the more ordered and rigid raft bilayer over the more liquid POPC bilayer. Ceramide and diacylglycerol have relatively small free energies of exchange, suggesting nearly equal preference for both bilayers. This unexpected result may have implications for ceramide and diacylglycerol signaling and membrane localization.
Keywords: flip-flop, molecular dynamics, lipid bilayer, free energy, desorption, lipid second-messenger
The lipid raft hypothesis states that mammalian cellular membranes contain lateral domains enriched in cholesterol, sphingomyelin, and specific integral membrane proteins (1–4). Rafts are thought be small (approximately tens of nanometers in diameter), dynamic, and important for cellular signaling and membrane trafficking (1, 5). The sorting of lipids and proteins and the role of lipid rafts in vivo remains controversial (4, 6–8). The microscopic structure of mixed membranes is a complex problem because the local concentration of individual lipids affects the phase and structure of the membrane, which in turn affect the local concentration of these lipids. In a model system, it has been shown that both C18:0 ceramide and dipalmitoylglycerol can displace cholesterol from liquid-ordered domains, and form larger and more stable domains than cholesterol-enriched ordered domains (9). Both ceramide (10) and diacylglycerol (11) are nonlamellar forming lipids, which are important for cellular processes, such as pore formation, vesicle fusion, and budding, as well as membrane protein function (12). Currently we lack a molecular level physical and thermodynamic understanding of lipid-lipid interactions in biological membranes.
Ceramide is a key metabolic intermediate for sphingolipids with an amide backbone (13), as diacylglycerol is for glycerol-derived phospholipids (14). In cells, there are many variants of both ceramide (13) and diacylglycerol (15), including short and long tails, saturated and unsaturated tails, and minor changes in backbone structure. Both ceramide and diacylglycerol are lipid second messengers that play important roles in many signaling pathways. The mechanism of lipid second messengers can involve specific lipid-protein interactions or more general membrane altering effects, such as vesicle budding and domain formation or stabilization. A well-studied example of a specific lipid-protein mechanism is the breakdown of phosphoinositol or phosphatidylcholine by a phospholipase into diacylglycerol, which then binds to the C1 domain of protein kinase C (14). The formation of larger and more stable domains, or signaling platforms, with the creation of ceramide by sphingomyelinase, is an example of a nonspecific mechanism of signaling (13). The localization and dynamics of signaling lipids is crucial to their function, particularly with respect to the distribution across the bilayer leaflets, as lipids on one leaflet are effectively isolated from the other side. Ceramide created by neutral sphingomyelinase on the cytoplasmic leaflet is involved with a different signaling pathway than is ceramide generated on the outer leaflet by acid sphingomyelinase (13).
The translocation of lipids from one bilayer leaflet to another, or flip-flop, is an important process for cellular growth, lipid transport, and signaling. It has been well established that the passive translocation of lipids with charged or zwitterionic headgroups is slow on a physiological timescale, with an estimated half time of hours to days (16–18). Proteins that facilitate lipid translocation, including flippases, floppases, and scramblases have been identified, although identification and functional characterization of membrane-perturbing integral membrane proteins is difficult (19). The much less polar headgroups of cholesterol, diacylglycerol, and ceramide suggest these lipids can translocate bilayers on a much faster timescale than phospholipids. Experimental evidence supports this hypothesis (20–27), although the rates vary significantly depending on the experimental conditions, often by orders of magnitude. These differences may be due to uncertainties with the interpretation of the complex experiments, but it seems more likely that they can be explained by a significant effect of differences in the structure and dynamics of the membranes themselves on the kinetics and thermodynamics of lipid flip-flop.
Computer simulations of cholesterol-containing lipid bilayers are prevalent (28–31). Previously, we investigated cholesterol flip-flop and desorption using molecular dynamics (MD) simulations in pure phosphatidylcholine (PC) lipid bilayers (32). We found that cholesterol flips rapidly across PC bilayers, with a large gradient in rates between a poly-unsaturated diarachidonylphosphatidylcholine (DAPC) bilayer, a pure DPPC bilayer, and a DPPC bilayer with 40 mol% cholesterol. A different study using the CHARMM force field and 2D potentials of mean force (PMF) found similar free energy barriers to ours for cholesterol in DAPC, 1-palmitoyl-2-oleoyl-phosphatidylcholine (POPC), and DPPC bilayers (33). We showed previously that increasing cholesterol content in DPPC bilayers (0–40 mol%) dramatically increased the free energy barrier for DPPC flip-flop and pore formation (34). Using similar methods, we also showed that saturated PC lipids with short tails (12 carbons) flip-flop orders of magnitude faster than longer lipids (DPPC), through a pore-mediated mechanism (35).
Here, we have used atomistic MD simulations to investigate the interaction of cholesterol, palmitoyl-ceramide, and palmitoyloleoyl-diacylglycerol with an ordered and rigid raft-like bilayer [1:1:1 ratio of POPC, palmitoyl-sphingomyelin (PSM), and cholesterol] and with a pure POPC bilayer. We determined free energy profiles for moving a single lipid from the water phase to the center of the two different bilayers. From the profiles, we estimated orders of magnitude faster flip-flop for cholesterol, ceramide, and diacylglycerol in the raft bilayer (hereafter referred to as “Raft”) compared with a POPC bilayer. Cholesterol has a large free energy of exchange between the POPC and Raft bilayers, whereas ceramide and diacylglycerol have modest free energies of exchange or similar affinities for both bilayers.
EXPERIMENTAL PROCEDURES
We simulated two model bilayers: pure POPC (64 POPC) and a 1:1:1 mixture of PSM, cholesterol, and POPC (22 lipids each) as a model Raft bilayer. Berger parameters were used for POPC (36). Parameters for PSM (37) and cholesterol (38) have been previously described. Palmitoyl-ceramide (CER) and palmitoyloleoyl-diacylglycerol (DAG) were built from PSM and POPC by replacing the headgroup with a hydroxyl group, with parameters from the GROMOS87 force field (39). For water, we used the SPC model (40). Simulations were run with GROMACS (41). Water bonds and angles were constrained using SETTLE (42), and all other bonds using LINCS (43). The time step was 2 fs with neighbor list updates every 10 steps. Temperature was maintained at 323 K using the V-rescale algorithm (44). Lateral and normal to the bilayer plane, pressure was kept at 1 bar, using the Berendsen barostat (45). Lennard-Jones and Coulomb real-space interactions were cut off at 0.9 nm, with smooth particle mesh Ewald (46, 47) for long-range electrostatics, with a fourth-order spline and 0.12 nm grid spacing.
We used umbrella sampling (48) to determine PMFs for moving lipids from bulk water to the center of the two model bilayers. We restrained the hydroxyl of each lipid at positions spaced by 0.1 nm along the bilayer normal with a force constant of 3,000 kJ mol−1 · nm−2, resulting in 41 or 51 parallel simulations (to 4 or 5 nm from the bilayer center). Starting from an equilibrium bilayer, we pulled the lipid to its respective position with a force constant of 500 kJ mol−1 nm−2 for 1 ns, followed by 5 ns of equilibration with a 3000 kJ mol−1 nm−2 force constant and 15–60 ns of production simulation per window. The PMF was constructed using the weighted histogram analysis method (49). To increase computational efficiency, we ran two umbrella samples in each simulation, one in either leaflet, with the lipid spaced by at least 4 nm. We have shown previously that the PMF for a DPPC lipid is not significantly affected by using one or two umbrellas in the same system (50).
Fig. 1 shows the kinetic model we used to estimate the rate of flip-flop across a lipid bilayer, with kf the rate to move from equilibrium to the center of the bilayer and kd the rate to move from the bilayer center back to equilibrium. In a previous work (32), we showed that this method for estimating the rate for cholesterol flip-flop matched rates directly observed from coarse-grained simulations.
Fig. 1.

Schematic diagram for the process of flip-flop and lipid desorption. To determine ΔGex or, in this case, ΔGPOPC-Raft, we subtract ΔGPOPC by ΔGRaft. We define a two-state model for lipid flip-flop with kf the rate to move from equilibrium to the center of the bilayer, and kd the rate to move from the center of the bilayer to the equilibrium position on the opposite leaflet.
To obtain kd, we first pulled a lipid into the center of a bilayer and harmonically restrained it there for 1 ns with a 3,000 kJ mol−1 nm−2 force constant. We then removed the restraint and determined the time for the lipid to reach the equilibrium position in the bilayer. We repeated this 41 times for cholesterol, diacylglycerol, and ceramide in the POPC bilayers. From the 41 trials, we obtained the average time to reach equilibrium, with kd being the inverse of this time.
For the Raft bilayers, we could not obtain average values for kd from equilibrium simulations at 323 K, due to the long timescale required to overcome the free energy barrier. We ran 41 simulations at temperatures of 363, 373, 383, and 393 K each. We then used the Arrhenius equation to extrapolate keq to values at 323 K (Table 1). Supplementary Fig. I shows the Arrhenius plots.
TABLE 1.
Thermodynamic and kinetic properties of Raft and POPC bilayers
| Lipid | ΔGdesorb | ΔGcenter | ΔGbarrier | tda | kflipb | t1/2c |
| kJ/mol | kJ/mol | kJ/mol | ns | s−1 | s | |
| CHOL POPC | 78 | 23 | 23 | 2.1 | 4.5 × 10⁴ | 1.5 × 10⁻⁵ |
| CHOL RAFT | 132 | 57 | 63 | 693.3 | 4.4 × 10⁻⁴ | 1.6 × 10³ |
| DAG POPC | 100 | 26 | 26 | 1.4 | 2.2 × 10⁴ | 3.2 × 10⁻⁵ |
| DAG RAFT | 95 | 34 | 40 | 68.5 | 2.3 × 101 | 3 × 10⁻² |
| CER POPC | 103 | 43 | 43 | 0.6 | 8.9 × 101 | 7.8 × 10⁻³ |
| CER RAFT | 110 | 52 | 66 | 73 | 2.7 × 10⁻² | 2.6 × 101 |
td was estimated by releasing the restraint on the lipid at the bilayer center and measuring the time it takes to return to equilibrium.
Calculated rate for lipid flip-flop.
Half time for lipid flip-flop.
From the free energy difference between equilibrium and the bilayer center and the rate for the lipid to move from the bilayer center to equilibrium, we can estimate a rate for flip-flop. Using the equation:
where kd is the rate to move from the bilayer center to equilibrium, ΔGcenter is the free energy difference, and kf is the rate to move from equilibrium to the bilayer center. We then determine the rate of flip-flop (kflip) using the rate to reach the bilayer center and the rate to move from the bilayer center to equilibrium:
We multiple the rate by one half to account for lipids that reach the bilayer center, then return back to their original leaflet. From the rate of flip-flop, we then estimate the half time for flip-flop using:
RESULTS
Equilibrium properties
Snapshots of the POPC and Raft bilayers during equilibrium simulations are shown in Fig. 2. As expected, at equilibrium the headgroup of cholesterol, ceramide, and diacylglycerol resides at the water–lipid headgroup interface. The partial density profiles are shown in Fig. 2C. Both bilayers have peaks at the water-headgroup interface and troughs in the center of the bilayer. The Raft bilayer has a more complex density profile, with multiple headgroup peaks due to multiple components. There is a trough at the center of the POPC bilayer and a deeper trough at the center of the Raft bilayer, likely because the two ordered leaflets’ tails are not able to interdigitate as much as more fluid bilayers. The POPC bilayer is thinner and more fluid than the Raft bilayer. Supplementary Fig. II shows order parameters for the palmitoyl tail of diacylglycerol in each bilayer. Supplementary Fig. II also shows that the Raft bilayer is much more ordered than the POPC bilayer.
Fig. 2.

Structure of the model membranes. Snapshots of the POPC (A) and Raft (B) bilayers, and partial density profiles for both bilayers (C). In the snapshots, water is red thick licorice, lipid tails are gray lines, and phosphorous and nitrogen atoms are tan and blue balls. In the density profiles, water is thick lines and lipids are thin lines.
Fig. 3 shows PMFs for moving cholesterol, DAG, and CER from water to the center of POPC and Raft bilayers. All the PMFs share a number of common trends: a free energy minima at the equilibrium position of the headgroup in the bilayer and steep free energy slopes from equilibrium to bulk water or the bilayer center. The free energy for desorption (equilibrium to water) is much greater than the free energy barrier for flip-flop. The important free energy differences are listed in Table 1. The shaded regions in Fig. 3 represent d2kt, the distance across the PMF at 2kT of energy, as a measure of the thermal fluctuations accessible to each lipid normal to the plane of the bilayer. All three lipids have considerably larger fluctuations in the POPC bilayer than in the Raft bilayer. Diacylglycerol has significantly larger fluctuations than either cholesterol or ceramide in both bilayers.
Fig. 3.

Free-energy profiles. Potentials of mean force for transferring the headgroup of cholesterol (CHOL), diacylglycerol (DAG), and ceramide (CER) from water to the center of a POPC and Raft bilayer. The legend is the same for all panels. For each PMF, the position restraint was placed on the hydroxyl of the headgroup of the lipid and used to determine the x axis. Error bars are the difference between the two umbrella sampling calculations. The solid region corresponds to the distance within 2kT of the free energy minimums.
Flip-flop
Both model bilayers are symmetric, and therefore, the free energy profiles shown in Fig. 3 are symmetric. For a complete flip-flop event, a lipid must move from equilibrium to the center of the bilayer and then to the other leaflet's equilibrium position (Fig. 1). The maximum in the PMFs between equilibrium and the bilayer center is the free energy barrier for flip-flop. The free energy barriers for cholesterol, diacylglycerol, and ceramide flip-flop in POPC are much lower compared with the Raft bilayer. For cholesterol, the free energy barrier for flip-flop increases from 23 to 63 kJ/mol for the POPC and Raft bilayers. Diacylglycerol has barriers for flip-flop of 26 and 40 kJ/mol for the POPC and Raft bilayers. The free energy barrier for ceramide flip-flop in the POPC and Raft bilayers increases from 43 to 66 kJ/mol.
Fig. 4 shows the number of hydrogen bonds formed between the cholesterol, diacylglycerol, or ceramide and the rest of the bilayer system as the lipid moves from water to the center of the bilayer. As the hydroxyl headgroup is moved into the bilayer core, water molecules move out of bulk solution into the hydrophobic interior to hydrogen bond with the lipid. There is an energetic balance between desolvating the flipping lipid and deforming the bilayer interface. We have observed similar behavior in the partitioning of charged and polar amino acid side chains in a dioleoylphosphatidylcholine (DOPC) bilayer (51). Moving ceramide from 0.4 nm (Fig. 5B) to 0.2 nm (Fig. 5A) from the POPC bilayer center causes water to stop interacting with the headgroup, illustrated by the average number of hydrogen bonds dropping to near-zero (Fig. 4). The PMFs for the Raft bilayer have much steeper slopes compared with the POPC bilayer. The Raft bilayer's denser and stiffer structure makes it more expensive energetically to allow the polar lipid into its interior, thus preventing translocation. At the free energy barriers, no hydrogen bonds between water and the flipping lipid are found, although diacylglycerol and ceramide do form one intramolecular hydrogen bond (Fig. 4). At the center of the Raft bilayer, the numbers of hydrogen bonds for ceramide and cholesterol are not zero, due to an occasional water molecule reaching the center of the bilayer to hydrogen bond with the headgroup. This is likely possible due to the drop in density near the center of the Raft bilayer and could contribute to the small free energy troughs at the center of the Raft bilayer for cholesterol and ceramide (Fig. 3). Fig. 5C shows ceramide hydrogen bonding with a water molecule at the center of the Raft bilayer.
Fig. 4.

Number of hydrogen bonds. Average number of hydrogen bonds from the cholesterol (CHOL), diacylglycerol (DAG), or ceramide (CER) in a POPC and Raft bilayer as the lipid headgroup moves from water to the center of each bilayer. Thick lines are the total number of hydrogen bonds, and the thin lines are the number of intramolecular hydrogen bonds. The legend is the same for each panel. Hydrogen bonds are determined from a geometric criterion, with a minimum angle of 30 degrees and distance of 0.35 nm between donor and acceptor groups. Error bars are the difference between the two umbrella sampling calculations.
Fig. 5.

Snapshots of ceramide and cholesterol in model membranes. The representation is the same as in Fig 1, but the restrained ceramide or cholesterol are thick cyan lines, and the oxygen of the restrained cholesterol is a yellow ball. Ceramide at 0.2 nm (A) and 0.4 nm (B) from the center of a POPC bilayer. (C) Ceramide at the center of the Raft bilayer; hydrogen bonded with a single water molecule. Cholesterol at 0.2 nm (D), 0.4 nm (E), 3.8 nm (F), and 4.3 nm (G) from the center of the Raft bilayer.
The lipids change conformation as they move from water to equilibrium and then to the center of the bilayer. For cholesterol, we determined the tilt angle formed between its long axis and the normal to the plane of the bilayer (Fig. 6) and the angle distribution (Fig. 7). At equilibrium, cholesterol is oriented with its hydroxyl in water and its long axis perpendicular to the plane of the membrane. There is a slight increase in average tilt angle for the Raft bilayer compared with the POPC (Fig. 6). As cholesterol is moved into the hydrophobic tail region, the angle distributions are poorly represented by an average value. Fig. 7A shows the angle distribution for cholesterol near the bilayer center, with a large peak at 150–180° for cholesterol at 0.0 nm and 0.2 nm from the bilayer center, but at 0–30° for 0.1 nm and 0.3 nm. There is also a small peak near 90° at 0.1 nm and 0.3 nm positions. Fig. 5D shows cholesterol at 0.2 nm from the center of the Raft bilayer, and facing the opposite leaflet at 0.4 nm from the bilayer center (Fig. 5E). Due to the order and rigidity of the Raft bilayer, cholesterol prefers to be perpendicular to the plane of the bilayer with its tail in either leaflet, with slow exchange between the two conformations.
Fig. 6.

Lipid conformations and orientations. Average angle between cholesterol's (CHOL) long axis and the bilayer normal (top panel). The average distance between the headgroup and the terminal carbon of the palmitoyl chain of diacylglycerol (DAG; middle panel) and ceramide (CER); bottom panel) as they move from water to the center of the bilayers. The angle for cholesterol was defined by the hydroxyl and terminal carbon of the tail. Error bars are the difference between the two umbrella sampling calculations. The legend is the same for each panel.
Fig. 7.
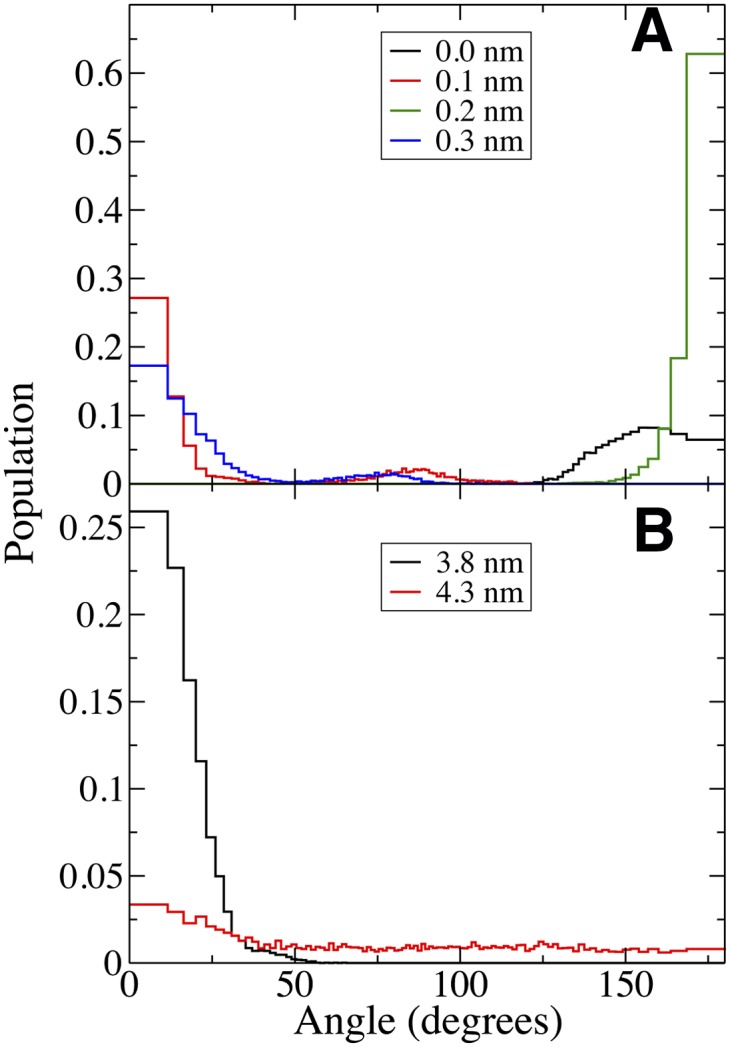
Angular probability distributions. Probability distributions for the angle between cholesterol's long axis and the membrane normal during umbrella sampling simulations. The legend refers to the umbrella position for each curve. (A) Cholesterol near the center of the Raft bilayer. For adjacent umbrella positions, the angle can change from predominantly 0 degrees to predominantly 180 degrees. (B) Cholesterol as it desorbs from the Raft bilayer. At 3.8 nm, cholesterol interacts with the bilayer with an angle close to 0 degrees, whereas at 4.3 nm, cholesterol is in bulk water with a nearly homogenous distribution. The slight peak near 0 degrees indicates that the cholesterol tail still interacts with the Raft bilayer at this position.
As ceramide and diacylglycerol are long and flexible molecules, tilt angles are not well defined. Instead, we determined the average distance from the hydroxyl headgroup to the last carbon of the palmitoyl tail (Fig. 6). For the POPC bilayer, there is a smooth decrease in this distance as the ceramide or diacylglycerol moves toward the bilayer center, reflecting a heterogeneous distribution. In the Raft bilayer, both lipids have a deep trough in the head-to-tail distance at approximately 1 nm from the bilayer center, which suggests a compact conformation at this position. This distance corresponds to the free energy barrier for flip-flop (Fig. 3). At the center of the bilayer, the head-to-tail distance is close to the value at the equilibrium position, indicating mostly extended conformations. Fig. 5C shows the tail of ceramide interdigitated with one of the Raft bilayer leaflets.
Table 1 lists the thermodynamic and kinetic data for lipid flip-flop. We estimate the half time for flip-flop for cholesterol to be approximately 20 μs and 30 min in the POPC and Raft bilayers. For diacylglycerol, the half times are approximately 30 μs and 30 ms for the POPC and Raft bilayers. The half time for ceramide flip-flop is approximately 10 ms in the POPC bilayer and 30 s in the Raft bilayer.
Desorption
All three lipids have more hydrogen bonds in bulk water than at their equilibrium position in the bilayer (Fig. 4). As the lipids move from equilibrium out into bulk water, their hydrophobic tails remain inserted in the bilayer to prevent exposure to water, resulting in a larger head-to-tail distance for ceramide and diacylglycerol. At a certain distance from the bilayer center, the tails stop interacting with the bilayer, and the lipid becomes fully desorbed. Ceramide and diacylglycerol show prominent drops in the head-to-tail distance as they stop interacting with the bilayer (Fig. 6). For cholesterol, this is illustrated by the change in average angle from approximately 20° to 90° (Fig. 6), the angle distributions for the Raft bilayer at 3.8 nm and 4.3 nm from the bilayer center (Fig. 7B), and the corresponding snapshots (Fig. 5F, G). The slope in the PMF for cholesterol desorption is much steeper for the Raft bilayer than the POPC bilayer, whereas ceramide and diacylglycerol have similar slopes for both bilayers. The free energy difference of a lipid at its equilibrium position and in bulk water is the free energy for desorption (Table 1). Using the free energy in bulk water as reference point, we define ΔGex as the free energy for a single lipid to move from a Raft bilayer to a POPC bilayer; which is ΔGPOPC - ΔGRaft (Fig. 1). Cholesterol has a strong preference for the Raft bilayer compared with the POPC bilayer, with a Gex of 54 kJ/mol. Diacylglycerol has a slight preference for the POPC bilayer compared with the Raft bilayer (Gex=-5 kJ/mol), whereas ceramide has a modest preference for the Raft bilayer (Gex = 7 kJ/mol).
DISCUSSION
Flip-flop
We determined the free energy profiles for cholesterol, ceramide, and diacylglycerol translocation and desorption in the two model membranes. Using computer simulations of small bilayer patches allowed us to control the local concentration to simulate lipid flip-flop in a Raft bilayer and a pure POPC bilayer. The Raft bilayer was both thicker and more ordered than the POPC bilayer. For all three lipids, the free energy barrier for flip-flop increased considerably for the Raft bilayer compared with the non-Raft bilayer, and the rate for diffusion out of the interior decreased, resulting in orders of magnitude slower translocation across the thicker and less-fluid Raft bilayer. All three lipids show orders of magnitude slower flip-flop in the Raft bilayer compared with the non-Raft bilayer, with 8, 4, and 3 orders of magnitude difference for cholesterol, ceramide, and diacylglycerol. We find that cholesterol has the slowest rate of flip-flop in the Raft bilayer, compared with ceramide and diacylglycerol. In the pure POPC bilayer, the rate for flip-flop follows the trend: cholesterol > diacylglycerol > ceramide.
Experimental values vary widely due to the use of different model systems, temperatures, labels, and techniques. For diacylglycerol and ceramide, studies also use different species with varied chain length and/or double bonds, which would affect the flip-flop rate. Cholesterol flip-flop is the most widely studied of the three, with experimental rate estimates ranging from hours (52) or minutes (27), to subseconds (26) or even submilliseconds (23). In a polyunsaturated DAPC bilayer, it was found that cholesterol is enriched in the bilayer interior, suggesting fast interleaflet diffusion (53).
Ceramide was found to flip rapidly across the plasma membrane of a live cell (54). The half time for unlabeled C-16 ceramide flip-flop was estimated to be < 1 min in egg PC giant unilamellar vesicles (25). Subsequently, the same group showed that the half time for spin-labeled ceramide flip-flop was < 1 min in both a liquid-disordered (egg PC) large unilamellar vesicle and a liquid-ordered (20:20:60 mol ratio of SM:POPC:CHOL) large unilamellar vesicle (24). This was in contrast to glucosylceramide and galactosylceramide, which both had significantly reduced flip-flop rates in bilayers with higher cholesterol concentrations (24). From a simple physiochemical perspective, it is hard to explain the discrepancy in flip-flop behavior among these three types of ceramide. Our results suggest that ceramide flip-flop in a liquid-disordered bilayer is faster than in a liquid-ordered bilayer, although we still find a half time of 30 s in the liquid-ordered phase, which is faster than the experimental value (24).
In an erythrocyte membrane, 1,2-diacylglycerol was estimated to diffuse from the outer to inner leaflets on the timescale of a minute (22). Fluorescently labeled diacylglycerol was found to equilibrate across DOPC vesicles on a fast timescale (minute), orders of magnitude faster than labeled phosphatidic acid (55). From NMR spectroscopy, the half time for 1,2-dilauroyl-glycerol was determined to be approximately 10 ms in egg PC vesicles (21). Overall, it is difficult to reconcile the varied experimental rates, and further work into studying lipid flip-flop is warranted.
Our atomistic simulations illustrate the complexity for cholesterol, ceramide, and diacylglycerol translocation across two membranes with diverse structures. Atomistic detail allowed us to determine both the number of hydrogen bonds to the lipid and its conformational flexibility during translocation. The free energy barrier for flip-flop was at the position where the number of intermolecular hydrogen bonds was zero for all three lipids. Our results support a solubility-diffusion mechanism for all three lipids in both bilayers, as opposed to a pore-mediated mechanism that has been observed for phospholipid flip-flop (56). The three lipids are as long as half the bilayer thickness, so even at the bilayer center there are other contributions to the free energy, which argues the solubility-diffusion mechanism might be too simplistic. The Raft bilayer prevents conformational flexibility, which is required during the process of flip-flop and likely contributes to the higher energy barriers. These specific atomistic details would likely not be observed using continuum bilayer models, coarse-grained models, or most experimental techniques.
Lipid desorption
By comparing the free energies for lipid desorption between the Raft and POPC bilayers, we determined ΔGex for all three lipids. Cholesterol had a large ΔGex, which suggests a strong driving force for cholesterol incorporation into raft-like bilayer domains over nonraft (POPC) bilayer domains. Qualitatively, this matches the traditional view that suggests cholesterol preferentially interacts with saturated phospholipids and sphingomyelin. The preference of cholesterol for more ordered and rigid membranes with higher cholesterol concentration is important for passive cholesterol trafficking from the endoplasmic reticulum with low cholesterol content, through the Golgi, to the plasma membrane (57).
In contrast to cholesterol, ceramide and diacylglycerol have relatively small ΔGex, which indicates a similar preference for the POPC and Raft bilayers. The difference between ΔGex for diacylglycerol and ceramide could be due to diacylglycerol having one unsaturated tail, whereas ceramide has two saturated tails. The low values of Gex suggest that at low concentrations ceramide and diacylglycerol would not have a strong preference to interact with raft domains over nonraft domains. It was shown that both ceramide and diacylglycerol are able to displace cholesterol from liquid-ordered domains and form more rigid domains (9). Our results suggest this behavior is concentration dependent, where a single ceramide does not displace a cholesterol from the domain, but rather a high concentration of ceramide alters the domain structure, forming a more rigid and ordered domain. It is possible cholesterol would have a lower preference for the ceramide domain and that ceramide would have a strong preference for the domain. Prior to signaling, ceramide and diacylglycerol molecules are at a low ambient concentration (approximately 0.1–1 mol%) (13) and would not cluster in rafts, which could be important for high-fidelity signaling. After enzyme action, such as sphingomyelinase, the local concentration of ceramide would increase, its chemical potential would likely change, and a signaling platform could form.
Future directions
One of the sources of error in our PMF calculations are sampling problems, illustrated by the relatively large error bars for flip-flop of the lipids in the Raft bilayer, in which lipid dynamics are slow. The simulation times are insufficient to sample the lateral diffusion of all lipids, but this potential problem is mitigated by the high concentrations of each of the lipid components and calculating two independent profiles for lipids or cholesterol in two different environments. There are also sampling problems as the lipid is moved out into bulk water (50). It is possible that the error bars underestimate the uncertainty in this region. The large jump in the head-to-tail distance (Fig. 6) for ceramide and diacylglycerol between the tails inserted in the bilayer and the lipid folded up in bulk water, as well as the large error bars in this region illustrate the sampling problem. Supplementary Fig. III shows PMFs for cholesterol in the Raft bilayer using different lengths of simulation (from 5 ns to 60 ns). After around 20–30 ns, the PMFs converged to a reasonable statistical error for the purpose of this study, although orders of magnitude more sampling would allow much more accurate statistical analysis (58). Atomistic free energy profiles of lipids in bilayers are computationally demanding, and the present work is near the current state of the art in the field. Increases in computational power, as well as improvements in free energy algorithms and enhanced sampling methods, will allow more accurate estimates to be performed on more complex systems.
Another potential source of error for our calculations, and simulations in general, are force field inaccuracies, which are also difficult to assess. The parameters for ceramide, diacylglycerol, and cholesterol were derived in a consistent manner, with the same partial charges and atom types for the hydroxyl headgroup, which makes our comparison more reliable. The most important results we present are the differences in free energy, which likely mitigates potential force field–related errors. We note that the free energy profile we previously determined for cholesterol flip-flop using the present parameters were similar to those calculated using the CHARMM force field (33).
CONCLUSIONS
The location and dynamics of signaling lipids is paramount to their function, regardless of the precise signaling mechanism. We lack a clear understanding of both the exact cellular localization of many lipids and the driving forces that govern their movement. We ran atomistic simulations to determine the thermodynamics and kinetics of flip-flop for three important lipids, as well as the free energies for the lipids’ desorption in Raft and POPC bilayers. On the subnanometer length scale, we discovered some of the specific molecular determinants for the underlying free energy profile, including hydrogen bonds, lipid membrane perturbations, and molecular geometry. Cholesterol, diacylglycerol, and ceramide have significantly higher energy barriers for flip-flop in the Raft bilayer than the POPC bilayer that translated into orders of magnitude slower translocation across the Raft bilayer. Slower flip-flop in Raft membrane can be understood from the stiffness of the bilayer, which prevents water from entering the hydrophobic interior to hydrogen bond with the translocating lipid and prohibits the conformational freedom of the lipid. Cholesterol was found to have a large preference (ΔGex) for the Raft bilayer compared with the POPC bilayer, which suggests that cholesterol can be “trapped” in raft domains both laterally and transversely. Ceramide and diacylglycerol flip across the Raft bilayer more slowly than across the POPC bilayer, but they both have a relatively small ΔGex between the two bilayers or nearly equal preference for both bilayers, which could be important for their signaling functions. Our simulations add to the physiochemical characterization of lipid membranes.
Supplementary Material
Footnotes
Abbreviations:
- CER
- palmitoyl-ceramide
- DAG
- palmitoyloleoyl-diacylglycerol
- DAPC
- diarachidonylphosphatidylcholine
- DOPC
- dioleoylphosphatidylcholine
- DPPC
- dipalmitoylphosphatidylcholine
- MD
- molecular dynamics
- PC
- phosphatidylcholine
- PMF
- potential of mean force
- POPC
- 1-palmitoyl-2-oleoyl-phosphatidylcholine
- PSM
- palmitoyl-sphingomyelin
This work was supported by the Natural Sciences and Engineering Research Council (NSERC). Calculations were carried out in part on WestGrid/Compute Canada facilities. W.F.D.B. is supported by NSERC, Alberta Innovates Health Solutions (AIHS), and the Killam Trust. D.P.T. is an AIHS scientist.
The online version of this article (available at http://www.jlr.org) contains supplementary data in the form of three figures.
REFERENCES
- 1.Pike L. J. 2006. Rafts defined: a report on the Keystone Symposium on Lipid Rafts and Cell Function. J. Lipid Res. 47: 1597–1598. [DOI] [PubMed] [Google Scholar]
- 2.Simons K., Ikonen E. 1997. Functional rafts in cell membranes. Nature. 387: 569–572. [DOI] [PubMed] [Google Scholar]
- 3.Simons K., Vaz W. L. 2004. Model systems, lipid rafts, and cell membranes. Annu. Rev. Biophys. Biomol. Struct. 33: 269–295. [DOI] [PubMed] [Google Scholar]
- 4.Edidin M. 2003. The state of lipid rafts: from model membranes to cells. Annu. Rev. Biophys. Biomol. Struct. 32: 257–283. [DOI] [PubMed] [Google Scholar]
- 5.Eggeling C., Ringemann C., Medda R., Schwarzmann G., Sandhoff K., Polyakova S., Belov V. N., Hein B., von Middendorff C., Schonle A., et al. 2009. Direct observation of the nanoscale dynamics of membrane lipids in a living cell. Nature. 457: 1159–1162. [DOI] [PubMed] [Google Scholar]
- 6.Munro S. 2003. Lipid rafts: elusive or illusive? Cell. 115: 377–388. [DOI] [PubMed] [Google Scholar]
- 7.Lingwood D., Simons K. 2010. Lipid rafts as a membrane-organizing principle. Science. 327: 46–50. [DOI] [PubMed] [Google Scholar]
- 8.Hancock J. F. 2006. Lipid rafts: contentious only from simplistic standpoints. Nat. Rev. Mol. Cell Biol. 7: 456–462. [DOI] [PMC free article] [PubMed] [Google Scholar]
- 9.Megha , London E. 2004. Ceramide selectively displaces cholesterol from ordered lipid domains (rafts): implications for lipid raft structure and function. J. Biol. Chem. 279: 9997–10004. [DOI] [PubMed] [Google Scholar]
- 10.López-Montero I., Monroy F., Vélez M., Devaux P. F. 2010. Ceramide: from lateral segregation to mechanical stress. Biochim. Biophys. Acta. 1798: 1348–1356. [DOI] [PubMed] [Google Scholar]
- 11.Gómez-Fernández J. C., Corbalán-García S. 2007. Diacylglycerols, multivalent membrane modulators. Chem. Phys. Lipids. 148: 1–25. [DOI] [PubMed] [Google Scholar]
- 12.Epand R. M. 1998. Lipid polymorphism and protein-lipid interactions. Biochim. Biophys. Acta. 1376: 353–368. [DOI] [PubMed] [Google Scholar]
- 13.Hannun Y. A., Obeid L. M. 2008. Principles of bioactive lipid signalling: lessons from sphingolipids. Nat. Rev. Mol. Cell Biol. 9: 139–150. [DOI] [PubMed] [Google Scholar]
- 14.Carrasco S., Mérida I. 2007. Diacylglycerol, when simplicity becomes complex. Trends Biochem. Sci. 32: 27–36. [DOI] [PubMed] [Google Scholar]
- 15.Goñi F. M., Alonso A. 1999. Structure and functional properties of diacylglycerols in membranes. Prog. Lipid Res. 38: 1–48. [DOI] [PubMed] [Google Scholar]
- 16.Kornberg R. D., McConnell H. M. 1971. Inside-outside transitions of phospholipids in vesicle membranes. Biochemistry. 10: 1111–1120. [DOI] [PubMed] [Google Scholar]
- 17.De Kruijff B., Van Zoelen E. J. 1978. Effect of the phase transition on the transbilayer movement of dimyristoyl phosphatidylcholine in unilamellar vesicles. Biochim. Biophys. Acta. 511: 105–115. [DOI] [PubMed] [Google Scholar]
- 18.McLean L. R., Phillips M. C. 1984. Cholesterol transfer from small and large unilamellar vesicles. Biochim. Biophys. Acta. 776: 21–26. [DOI] [PubMed] [Google Scholar]
- 19.Daleke D. L. 2008. Regulation of phospholipid asymmetry in the erythrocyte membrane. Curr. Opin. Hematol. 15: 191–195. [DOI] [PubMed] [Google Scholar]
- 20.Hamilton J. A. 2003. Fast flip-flop of cholesterol and fatty acids in membranes: implications for membrane transport proteins. Curr. Opin. Lipidol. 14: 263–271. [DOI] [PubMed] [Google Scholar]
- 21.Hamilton J. A., Bhamidipati S. P., Kodali D. R., Small D. M. 1991. The interfacial conformation and transbilayer movement of diacylglycerols in phospholipid bilayers. J. Biol. Chem. 266: 1177–1186. [PubMed] [Google Scholar]
- 22.Allan D., Thomas P., Michell R. H. 1978. Rapid transbilayer diffusion of 1,2-diacylglycerol and its relevance to control of membrane curvature. Nature. 276: 289–290. [DOI] [PubMed] [Google Scholar]
- 23.Bruckner R. J., Mansy S. S., Ricardo A., Mahadevan L., Szostak J. W. 2009. Flip-flop-induced relaxation of bending energy: implications for membrane remodeling. Biophys. J. 97: 3113–3122. [DOI] [PMC free article] [PubMed] [Google Scholar]
- 24.Pohl A., Lopez-Montero I., Rouviere F., Giusti F., Devaux P. F. 2009. Rapid transmembrane diffusion of ceramide and dihydroceramide spin-labelled analogues in the liquid ordered phase. Mol. Membr. Biol. 26: 194–204. [DOI] [PubMed] [Google Scholar]
- 25.Lopez-Montero I., Rodriguez N., Cribier S., Pohl A., Velez M., Devaux P. F. 2005. Rapid transbilayer movement of ceramides in phospholipid vesicles and in human erythrocytes. J. Biol. Chem. 280: 25811–25819. [DOI] [PubMed] [Google Scholar]
- 26.Steck T. L., Ye J., Lange Y. 2002. Probing red cell membrane cholesterol movement with cyclodextrin. Biophys. J. 83: 2118–2125. [DOI] [PMC free article] [PubMed] [Google Scholar]
- 27.Leventis R., Silvius J. R. 2001. Use of cyclodextrins to monitor transbilayer movement and differential lipid affinities of cholesterol. Biophys. J. 81: 2257–2267. [DOI] [PMC free article] [PubMed] [Google Scholar]
- 28.Marrink S. J., de Vries A. H., Tieleman D. P. 2009. Lipids on the move: simulations of membrane pores, domains, stalks and curves. Biochim. Biophys. Acta. 1788: 149–168. [DOI] [PubMed] [Google Scholar]
- 29.Berkowitz M. L. 2009. Detailed molecular dynamics simulations of model biological membranes containing cholesterol. Biochim. Biophys. Acta. 1788: 86–96. [DOI] [PubMed] [Google Scholar]
- 30.Niemelä P. S., Hyvonen M. T., Vattulainen I. 2009. Atom-scale molecular interactions in lipid raft mixtures. Biochim. Biophys. Acta. 1788: 122–135. [DOI] [PubMed] [Google Scholar]
- 31.Pandit S. A., Scott H. L. 2009. Multiscale simulations of heterogeneous model membranes. Biochim. Biophys. Acta. 1788: 136–148. [DOI] [PMC free article] [PubMed] [Google Scholar]
- 32.Bennett W. F., MacCallum J. L., Hinner M. J., Marrink S. J., Tieleman D. P. 2009. Molecular view of cholesterol flip-flop and chemical potential in different membrane environments. J. Am. Chem. Soc. 131: 12714–12720. [DOI] [PubMed] [Google Scholar]
- 33.Jo S., Rui H., Lim J. B., Klauda J. B., Im W. 2010. Cholesterol flip-flop: insights from free energy simulation studies. J. Phys. Chem. B. 114: 13342–13348. [DOI] [PubMed] [Google Scholar]
- 34.Bennett W. F., MacCallum J. L., Tieleman D. P. 2009. Thermodynamic analysis of the effect of cholesterol on dipalmitoylphosphatidylcholine lipid membranes. J. Am. Chem. Soc. 131: 1972–1978. [DOI] [PubMed] [Google Scholar]
- 35.Sapay N., Bennett W. F. D., Tieleman D. P. 2009. Thermodynamics of flip-flop and desorption for a systematic series of phosphatidylcholine lipids. Soft Matter. 5: 3295–3302. [Google Scholar]
- 36.Berger O., Edholm O., Jahnig F. 1997. Molecular dynamics simulations of a fluid bilayer of dipalmitoylphosphatidylcholine at full hydration, constant pressure, and constant temperature. Biophys. J. 72: 2002–2013. [DOI] [PMC free article] [PubMed] [Google Scholar]
- 37.Niemelä P., Hyvönen M. T., Vattulainen I. 2004. Structure and dynamics of sphingomyelin bilayer: insight gained through systematic comparison to phosphatidylcholine. Biophys. J. 87: 2976–2989. [DOI] [PMC free article] [PubMed] [Google Scholar]
- 38.Holtje M., Forster T., Brandt B., Engels T., von Rybinski W., Holtje H. D. 2001. Molecular dynamics simulations of stratum corneum lipid models: fatty acids and cholesterol. Biochim. Biophys. Acta. 1511: 156–167. [DOI] [PubMed] [Google Scholar]
- 39.van Gunsteren W. F., Berendsen H. J. C. 1987. Groningen Molecular Simulation (GROMOS) Library Manual. Biomos, Groningen, The Netherlands. [Google Scholar]
- 40.Berendsen H. J. C., Postma J. P. M., van Gunsteren W. F., Hermans J. 1981. Interaction models for water in relation to protein hydration. In Intermolecular Forces. B. Pullman, editor. D. Reidel, Dordrecht, The Netherlands. 331–342. [Google Scholar]
- 41.Van Der Spoel D., Lindahl E., Hess B., Groenhof G., Mark A. E., Berendsen H. J. 2005. GROMACS: fast, flexible, and free. J. Comput. Chem. 26: 1701–1718. [DOI] [PubMed] [Google Scholar]
- 42.Miyamoto S., Kollman P. A. 1992. Settle: an analytical version of the SHAKE and RATTLE algorithm for rigid water models. J. Comput. Chem. 13: 952–962. [Google Scholar]
- 43.Hess B., Bekker H., Berendsen H. J. C., Fraaije J. G. E. M. 1997. LINCS: a linear constraint solver for molecular simulations. J. Comput. Chem. 18: 1463–1472. [Google Scholar]
- 44.Bussi G., Donadio D., Parrinello M. 2007. Canonical sampling through velocity rescaling. J. Chem. Phys. 126: 014101. [DOI] [PubMed] [Google Scholar]
- 45.Berendsen H. J. C., Postma J. P. M., van Gunsteren W. F., Dinola A., Haak J. R. 1984. Molecular dynamics with coupling to an external bath. J. Chem. Phys. 81: 3684–3690. [Google Scholar]
- 46.Darden T., York D., Pedersen L. 1993. Particle mesh Ewald: an N · log(N) method for Ewald sums in large systems. J. Chem. Phys. 98: 10089–10092. [Google Scholar]
- 47.Essmann U., Perera L., Berkowitz M. L., Darden T., Lee H., Pedersen L. G. 1995. A smooth particle mesh Ewald method. J. Chem. Phys. 103: 8577–8593. [Google Scholar]
- 48.Torrie G. M., Valleau J. P. 1977. Nonphysical sampling distributions in Monte Carlo free-energy estimation - Umbrella sampling. J. Comput. Phys. 23: 187–199. [Google Scholar]
- 49.Kumar S., Rosenberg J. M., Bouzida D., Swendsen R. H., Kollman P. A. 1992. The weighted histogram analysis method for free-energy calculations on biomolecules. 1. The method. J. Comput. Chem. 13: 1011–1021. [Google Scholar]
- 50.Bennett W. F. D., Tieleman D. P. 2011. Water defect and pore formation in atomistic and coarse-grained lipid membranes: pushing the limits of coarse graining. J. Chem. Theory Comput. 7: 2981–2988. [DOI] [PubMed] [Google Scholar]
- 51.MacCallum J. L., Bennett W. F. D., Tieleman D. P. 2008. Distribution of amino acids in a lipid bilayer from computer simulations. Biophys. J. 94: 3393–3404. [DOI] [PMC free article] [PubMed] [Google Scholar]
- 52.Garg S., Porcar L., Woodka A. C., Butler P. D., Perez-Salas U. 2011. Noninvasive Neutron Scattering Measurements Reveal Slower Cholesterol Transport in Model Lipid Membranes. Biophys. J. 101: 370–377. [DOI] [PMC free article] [PubMed] [Google Scholar]
- 53.Harroun T. A., Katsaras J., Wassall S. R. 2006. Cholesterol hydroxyl group is found to reside in the center of a polyunsaturated lipid membrane. Biochemistry. 45: 1227–1233. [DOI] [PubMed] [Google Scholar]
- 54.Mitsutake S., Igarashi Y. 2007. Transbilayer movement of ceramide in the plasma membrane of live cells. Biochem. Biophys. Res. Commun. 359: 622–627. [DOI] [PubMed] [Google Scholar]
- 55.Pagano R. E., Longmuir K. J. 1985. Phosphorylation, transbilayer movement, and facilitated intracellular transport of diacylglycerol are involved in the uptake of a fluorescent analog of phosphatidic acid by cultured fibroblasts. J. Biol. Chem. 260: 1909–1916. [PubMed] [Google Scholar]
- 56.Tieleman D. P., Marrink S. J. 2006. Lipids out of equilibrium: energetics of desorption and pore mediated flip-flop. J. Am. Chem. Soc. 128: 12462–12467. [DOI] [PubMed] [Google Scholar]
- 57.van Meer G., Voelker D. R., Feigenson G. W. 2008. Membrane lipids: where they are and how they behave. Nat. Rev. Mol. Cell Biol. 9: 112–124. [DOI] [PMC free article] [PubMed] [Google Scholar]
- 58.Neale C., Bennett W. F. D., Tieleman D. P., Pomes R. 2011. Statistical convergence of equilibrium properties in simulations of molecular solutes embedded in lipid bilayers. J. Chem. Theory Comput. 7: 4175–4188. [DOI] [PubMed] [Google Scholar]
Associated Data
This section collects any data citations, data availability statements, or supplementary materials included in this article.