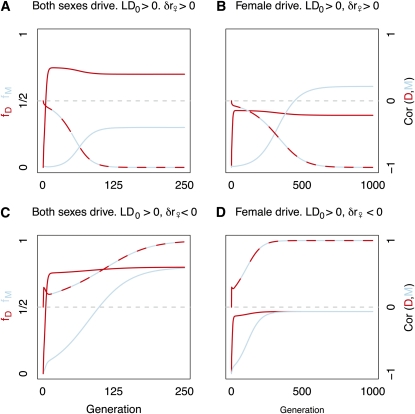
Figure 4 .
The evolution of drivers and recombination modifiers in tight linkage. The frequencies of MI drivers (fD, red), and linked recombination modifiers (fM, blue) across generations are shown. The correlation between alleles is denoted by the red and blue line, and its value is given on the right axis. Initial frequencies of driver and recombination modifier alleles are and , respectively. Drive is complete and recessive lethal. Initial recombination rate equals . (A) Drivers and recombination enhancement in both sexes (δr = 0.05); M arises on a d chromosome. (B) Female-limited driver and recombination enhancement. (δr♀ = 0.05); M arises on a d chromosome. (C) Drivers and recombination suppression in both sexes (δr = –0.05); M arises on a D chromosome. (D) Female-limited driver and recombination suppression (δr♀ = –0.05); M arises on a D chromosome.

