In the article by R. Jiang, S. Tavaré, and P. Marjoram (GENETICS 181: 187–197) entitled “Population Genetic Inference from Resequencing Data,” the description of methods for estimating population mutation and recombination rates from next-generation sequencing data contains an error in the way data were generated when genotyping error was present (Figures 5 and 6 in the article). This error, when corrected, greatly reduces the performance of our methods. The performance on the other simulated and real data described in the article remains unaffected by the error.
We offer a corrected method that alters the way in which genotypes are called. We continue to use a threshold NT that determines whether data are called as missing for each individual at each base, but, instead of using a threshold that is independent of the observed coverage, we use a probabilistic threshold defined in terms of P(C, e), the probability of producing the observed data if the underlying genotype is homozygous, given C, the number of reads, and an assumed error rate e for those reads (measured per site, per read, and defined as in the article; see Robustness in Results section). For computational convenience, we assume that if I is homozygous at position b, the allele will be the most commonly observed type in the reads covering b. Denoting this type by A, and assuming that we observe nA reads at which we see type A, and nB ≤ nA reads at which we see type B, we define . We then call individual I as a heterozygote if P(C, e) < P for some fixed threshold P; otherwise, we call it homozygous AA. Such a threshold model is more robust to varying coverage across different individuals and/or different nucleotide positions. However, since small thresholds cannot be reached for low coverage levels, we treat the data as missing if we do not observe at least Pm reads for I at b.
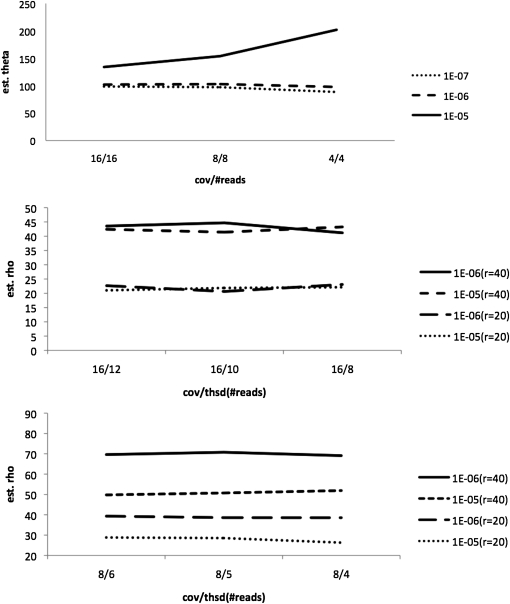
Figure 1 of this Corrigendum shows that this revised method works in contexts analogous to those of Tables 5 and 6 in the article. We simulated sequence read data sets of 100 kb, assuming that errors occur at a rate of 1% per nucleotide, per read. We simulated 100 such data sets for samples of 25 diploid individuals, conditioning on total expected coverage. (For further details of the simulation, see the article.)
Figure 1 .
Estimation of mutation rate (top) and recombination rate (middle and bottom). The y-axis shows the mean of estimated θ- or ρ-values across 100 data sets. The x-axis shows values of X/Pm, where X is the expected coverage per individual for the region, and Pm is a threshold such that the genotype is called as “missing” for any given individual at any given nucleotide position if fewer than Pm reads are observed.
Here, data were simulated using a mutation rate of θ = 100 for the entire region. For estimation of mutation rates, we show results for three coverage levels (4×, 8×, and 16×) and for three thresholds (P = 10−7, 10−6, and 10−5). For estimation of recombination rates, we show results for two coverage levels—16× (Figure 1, middle) and 8× (Figure 1, bottom)—at all combinations of two thresholds (P = 10−7, 10−6) and for two recombination rates under which data were generated (ρ = 20 or ρ = 40). The method performs well for estimation of mutation rate, provided that the probability threshold P is appropriately chosen (P = 10−6 or 10−7), but performs poorly if the threshold is not strict enough (P = 10−5). Performance is also good for estimation of recombination rate provided that genotypes can be inferred with reasonable accuracy, as is the case at 16× coverage, but performance erodes as the coverage level decreases.
Acknowledgments
The authors thank Chul Joo Kang and Jie Li for bringing this error to their attention. This work was funded in part by National Institutes of Health grants MH084678, HG005927, and HG02790.


