

Abstract
A major unanswered question regarding the dispersal of modern humans around the world concerns the geographical site of the first human steps outside of Africa. The “southern coastal route” model predicts that the early stages of the dispersal took place when people crossed the Red Sea to southern Arabia, but genetic evidence has hitherto been tenuous. We have addressed this question by analyzing the three minor west-Eurasian haplogroups, N1, N2, and X. These lineages branch directly from the first non-African founder node, the root of haplogroup N, and coalesce to the time of the first successful movement of modern humans out of Africa, ∼60 thousand years (ka) ago. We sequenced complete mtDNA genomes from 85 Southwest Asian samples carrying these haplogroups and compared them with a database of 300 European examples. The results show that these minor haplogroups have a relict distribution that suggests an ancient ancestry within the Arabian Peninsula, and they most likely spread from the Gulf Oasis region toward the Near East and Europe during the pluvial period 55–24 ka ago. This pattern suggests that Arabia was indeed the first staging post in the spread of modern humans around the world.
Main Text
The genetic and archaeological focus on the Arabian Peninsula in the last few years has been motivated by the hypothesis that this region was probably the initial staging post in the first successful migration of anatomically modern humans out of Africa.1–3 mtDNA data suggest that people bearing haplogroup L3 migrated from the Horn of Africa4,5 and recent evidence from complete sequences and improved molecular-dating techniques point to the origin of L3 within Africa ∼60–70 thousand years (ka) ago.6
A key question is where L3 evolved into the two non-African haplogroups N and M. Together, N and M encompass all of the deeply rooted variation observed in the rest of the world.4 Haplogroup N and its major subclade, haplogroup R, are ubiquitous in non-Africans and thus must have evolved very early in the dispersal process. Haplogroup M, on the other hand, is found primarily in the Indian subcontinent and farther east and has a single subclade, M1, that spread back into the Mediterranean region and eastern Africa during the Late Pleistocene.7 The age of the haplogroup N founder in western Eurasians has been estimated at ∼50–65 ka,8 very close to the age of their ancestral L3 clade in Africa, suggesting that a single, continuous demographic process might explain both the initial diversification and expansion of L3 in eastern Africa and the exit of modern humans from Africa.6 This process is likely to have been linked to the improved climatic conditions after ∼70 ka ago in eastern Africa and contradicts the recent suggestion of population continuity in eastern Arabia ∼120 ka ago.9,10
Strictly speaking, haplogroups N and R could have arisen anywhere in the region between Southwest Asia and Australasia; basal branches are found in this region today.1,5 However, given L3's genesis in eastern Africa, the most parsimonious location for their origin is in the vicinity of the Arabian Peninsula.3,5 Modern humans arrived in the Near East only ∼45–50 ka ago,11 most likely as a result of the desert barrier until climatic improvement ∼50 ka ago.1,3,7,12
Aside from the widespread haplogroup R, the deepest branches in western Eurasians are the non-R members, which for convenience we denote N(xR), of haplogroup N. These members comprise three basal clades, haplogroups N1, N2, and X. Other N(xR) haplogroups include N5 in Southern Asia, N9 and A in Eastern Asia,13,14 N21 and N22 in Southeast Asia,1 and O and S in Australasia.15 By screening Indian and Iranian populations, Metspalu et al.13 concluded that the initial split between west- and east-Eurasian haplogroups was located between the Indus Valley and Southwest Asia.
The west-Eurasian haplogroups N1 (including I), N2 (including W), and X are all very rare, have patchy distributions across Eurasia,16 and have hitherto been relatively little studied. Perhaps the most noteworthy discovery has been finding haplogroup N1a in both high frequency and high diversity in Neolithic skeletons from central Europe.17 Complete sequencing of modern samples suggests that, although the origin for this haplogroup is Southwest Asian, several sources probably contributed to the Neolithic sequences, including the Near East, eastern Europe, and a local central-European source.18 Haplogroup N1b is also very rare, but one subclade, N1b2, is quite common in Jews, and a Near Eastern origin and founder effect in Ashkenazi ancestors has been suggested.19–21 Haplogroup X spread widely around the time of the last glacial maximum (LGM), and its presence among Native Americans remains a puzzle because the few Siberian X lineages that have been identified are not plausible ancestors of the Native American subclades X2a and X2g.22,23 Recently, Shlush et al.24 suggested that haplogroup X displays a relict distribution across the Near East, where it reaches both appreciable frequencies and high diversities. Such distribution points to a Near Eastern origin, which would represent a contemporary refugium or reservoir of ancient diversity.
Here, we describe the diversity of 85 complete mtDNA sequences from the triangle encompassing eastern Africa, Arabia, and the Near East in the context of 300 publicly available lineages that are largely European.25 We show that haplogroups N1 and N2, as well as haplogroup X, are ancient relicts of the dispersal of modern humans from Africa ∼60 ka ago and can provide insight into the earliest stages of the process.
We previously characterized mtDNA diversity in populations from eastern Africa (102 from Sudan, 77 from Ethiopia, and 148 from Somalia),6 the Arabian Peninsula (185 from Yemen,26 65 from Soqotra,27 and 249 from Dubai),28 northern Africa (81 from Morocco29 and 304 from Tunisia),30 and the Near East and Caucasus.16 We sequenced hypervariable segments I and II (HVS-I and HVS-II) in samples selected from these datasets and assigned them to haplogroups. We then selected for complete mtDNA sequencing 85 haplotypes that belonged to the N(xR) paragroup, sequenced them as described previously,31 and scored mutations relative to the revised Cambridge reference sequence.32 The work was approved by the Faculty of Biological Sciences Ethics Committee at the University of Leeds and the Ethics Committee of the University of Porto (11/CEUP/2011).
For the complete mtDNAs (Table S1), we used a total of 385 N1, N2, and X sequences (85 new and 300 published) in the reconstruction of the tree. We also used published HVS-I and complete N1, N2, and X sequences for comparison, although considerable caution is needed when interpreting HVS-I data because of the reduced level of information that they contain and homoplasies, which can obscure phylogeographic patterns.24 We analyzed a total of 2,362 N(xR) HVS-I sequences from the literature from a total of 32,812 individuals surveyed (Table S2) and classified them with the aid of PhyloTree.33
For the phylogeny reconstruction, preliminary reduced-median network analyses34 led to a suggested branching order for the trees, which we then constructed most parsimoniously by hand. For estimation of the time to most recent common ancestor (TMRCA) for specific clades in the phylogeny, we used the ρ statistic35 and maximum likelihood (ML) as described previously.8 In order to detect population growth associated with the N(xR) lineages, we obtained Bayesian skyline plots (BSPs)36,37 from BEAST 1.4.638 in a total of 363 complete sequences (we left only one representative of the Native American haplogroups X2a1 and X2a2 in order to avoid a signal of American expansion) with a relaxed molecular clock as described before.6,39 We generated BSPs for each of the main subclades and subregions and visualized the plots with Tracer v1.3. We had two goals in performing these two subsets of analyses. First, we aimed to distinguish which haplogroups were mainly responsible for the increases in effective population sizes observed in the overall N(xR) analysis. Second, we aimed to observe whether a given region contained the signal for a given population increase in its specific N(xR) sequences. Such a signal would indicate a possible expansion involving several subclades within that region. To visualize the geographical distribution of N(xR) and its subclades, we constructed interpolation maps of HVS-I data by using the “Spatial Analyst Extension” of ArcView version 3.2 as described before.6,39
We reconstructed, haplogroup by haplogroup, HVS-I networks between nucleotide positions 16,051 and 16,400.32 In order to detect migrations from Southwest Asia to Europe and northern Africa, we employed a founder analysis for the N(xR) sequences and two criteria (f1 and f2) for identifying founder sequences.6,16 We scanned the distribution of founder ages for each region and defined equally spaced 200 yr intervals for each migration from 0–100 ka ago.
Figure 1 presents an outline topology of the three basal west-Eurasian haplogroups within N(xR) and indicates the primary branches with ages scaled against the ML estimates. The lineages coalesce at ∼60 ka ago, a plausible estimate for the early stages of the out-of-Africa migration in western Eurasia, considering that at least 50 ka ago, modern humans were already present in Southeast Asia.40 The complete phylogeny is shown in Tree S1 and includes age estimates obtained from complete genome (ρ and ML) and synonymous (ρ) clocks.
Figure 1.
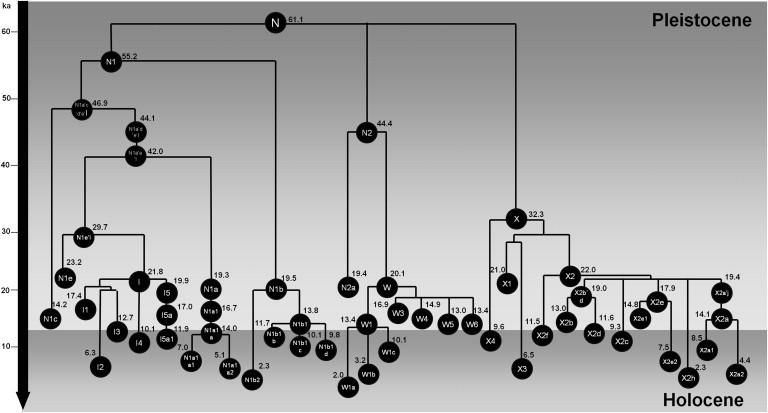
Schematic Tree of Haplogroup N
Ages indicated are maximum likelihood estimates obtained with the complete mtDNA genome (in ka).
Before focusing in detail on the history of the three haplogroups, we summarize here the overall pattern. Assuming a Near Eastern source and migrations into Europe and using an extensive HVS-I database, we obtained the following results (Figure S1): (1) a poorly defined peak ∼12 ka ago with the f1 criterion and (2) two other peaks, a small one dating to ∼6 ka ago and a larger one dating to ∼15 ka ago, with the f2 criterion. These results suggest that the three clades are primarily related to Late Glacial or postglacial expansions into Europe. We also performed a similar founder analysis of the three clades from the Near East into northern Africa, and we obtained a single peak, dating to 10.4 ka ago with the f1 criterion and to 13.8 ka ago with the f2 criterion. These peaks also indicate a primarily postglacial or Late Glacial expansion into this region.
The BSP obtained from the overall data (Figure S2A) shows a continuous, slightly stepped increase from ∼15 ka ago almost to the present (Table 1). The BSP with only the European data (Figure S2B) separates two steps (∼13 ka and ∼6 ka ago), whereas the BSP for the pool of the Near East and Arabian Peninsula (Figure S2C) indicates only a period of increase, which was initially gradual, from ∼15 ka ago.
Table 1.
Peaks of Rate of Population-Size Change through Time as Obtained from the BSPs
| Data | Peak (ka) | Range (ka) | Incrementa |
|---|---|---|---|
| Region | |||
| Overall | 5.6; 12.63 | 1.78–14.67 | 42.49 |
| Near East, Caucasus, Arabian Peninsula | 9.34 | 7.70–14.21 | 16.85 |
| Europe |
2.94 | 0.78–5.29 | 5.32 |
| 12.80 | 11.18–14.72 | 2.71 | |
| Haplogroup | |||
| N1 | 3.60 | 1.51–6.06 | 20.05 |
| 11.29 | 11.77–13.37 | 3.80 | |
| N2 | 6.29 | 3.15–10.11 | 19.99 |
| N2 (without haplogroup W in Finns) | 7.81 | 4.59–11.22 | 3.70 |
| X | 6.36 | 4.49–8.30 | 5.71 |
| 13.72 | 11.73–16.16 | 3.46 | |
The rate of population-size increase was of at least one individual per 100 individuals in a period of 100 yr.
Increment rate corresponds to the number of times the effective population size increased during this period.
Haplogroup N1, at ∼50–63 ka of age, is the oldest N(xR) clade, and it probably originated in Southwest Asia and split early into two branches. The first branch, N1a′c′d′e′I, comprises a series of subclades (N1a, N1c, N1d, N1e, and I) dating to 46–57 ka ago and was found across Southwest Asia (including the Near East and Arabia) and Europe, but many of the most basal lineages within the subclades were restricted to Southwest Asia.
Within N1′a′c′d′e′I, there is a series of consecutive splits. N1c represents the earliest, at ∼47 ka old, and it is seen primarily in Southwest Asia, especially in Arabia (Figure 2D). It is followed by N1d (the sample does not allow dating), detected so far only in India. Then, N1a separated from N1e′I ∼42 ka ago. N1a dates to ∼20 ka ago and, like N1c, is most frequent in Arabia (Figure 2B). Strikingly, there are several deeply rooted Ethiopian, Somali, and Yemeni lineages within N1a. The position in the tree of the mutation at position 152 within N1a is ambiguous; potentially, this subclade could split before the main N1a clade, but it is more likely (given the diversity of the subclade, dating to ∼15 ka ago, compared to the age of N1a of ∼20 ka) that it split within N1a and can be referred to as N1a2. Either way, the N1a samples display deep diversity within eastern Africa and the southern part of the Arabian Peninsula, two places where the clade is most frequent, and probably reflects ancient gene flow (quite likely dating to the Late Glacial period) across the Red Sea. N1a1 is found at very low frequency across Europe, where it also dates to the Late Glacial period (between 16–20 ka ago). HVS-I data also indicate a Late Glacial entrance into Europe (with both f1 and f2 criteria), although some clades (N1a1a1 and N1a1a2) might have re-expanded locally in the Neolithic period, as indicated by the presence of these lineages at high frequencies in central-European Neolithic burials.17,18,41,42
Figure 2.
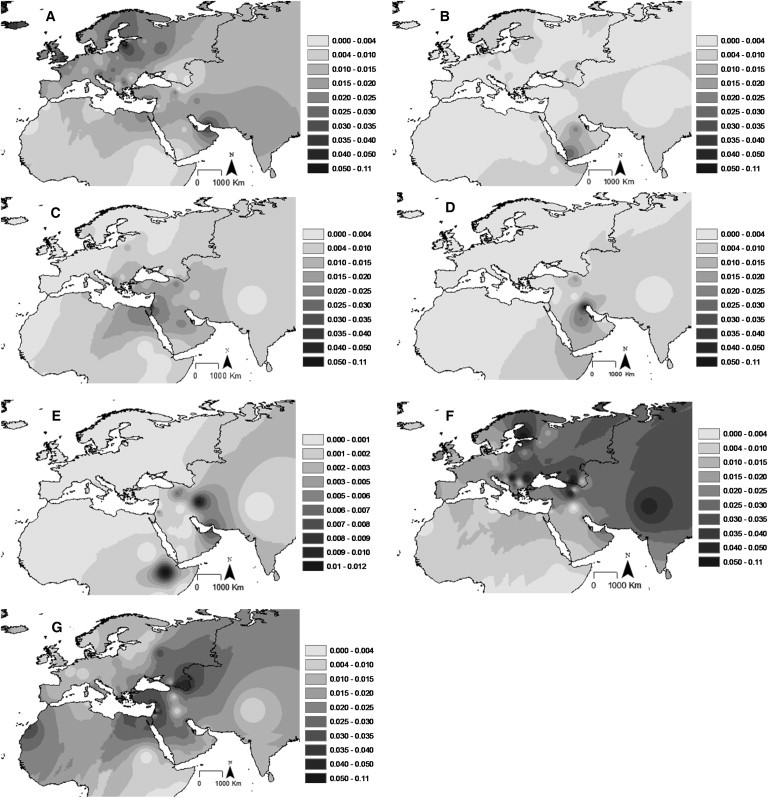
Frequency Maps Based on HVS-I Data for Haplogroups I, N1a, N1b, N1c, N2a, W, and X
(A) Haplogroup I.
(B) Haplogroup N1a.
(C) Haplogroup N1b.
(D) Haplogroup N1c.
(E) Haplogroup N2a.
(F) Haplogroup W.
(G) Haplogroup X.
Finally, ∼30 ka ago, N1e split from haplogroup I. The three N1e sequences in the tree are located in the Arabian Peninsula and Russia. Haplogroup I, which is by far the most frequent clade within N1, dates to ∼25 ka ago and is overall most frequent in Europe (Figure 2A), but the facts that it has a frequency peak in the Gulf region and that its highest diversity values are in the Gulf, Anatolia, and southeast Europe suggest that its origin is most likely in the Near East and/or Arabia (Figures S4A and S5A). A subhaplogroup of I5a shows a recent tight founder effect ∼2 ka ago on Soqotra, an island that is found in the Gulf of Aden and which was settled during the Holocene.27 I4 and I2′I3, dating to 10–15 ka ago, are both predominantly European. In the HVS-I founder analysis, haplogroup I indicates a primarily Late Glacial expansion, but the I1a subclade peaks in the Neolithic period at ∼6 ka ago under both founder analysis criteria. This pattern is confirmed by the complete sequence tree and again indicates expansion from a probable Near Eastern source dating to ∼5 ka ago.
N1b, on the other hand, dates to 19–25 ka ago and is primarily found in Southwest Asia. N1b is, in fact, part of a deeper clade, which we call N1b′f, dating to 33–40 ka ago. We found two Somali samples sharing 8 out of 15 polymorphisms with N1b, indicating a deeper split between N1b and these east-African lineages, which we labeled as belonging to N1f. Given the distribution of N1b, and N(xR) more generally, N1f probably resulted from ancient gene flow between Arabia and the Horn of Africa.43
N1b itself has three basal branches: N1b1, N1b2, and a third, which we labeled N1b3, represented by a single sample from Anatolia. N1b2 is found mainly in Ashkenazi Jews, and its estimated age of ∼2 ka indicates a recent founder effect among Ashkenazi ancestors.21 The main subclade, N1b1, dates to ∼13–14 ka ago and includes several branches from the Near East, Europe (rarely; mainly in central and eastern Mediterranean Europe), Arabia, and northern Africa (Figure 2C). HVS-I founder ages in Europe indicate a primarily Neolithic expansion (∼8 ka ago) with the f1criterion but a Late Glacial expansion (∼15 ka ago) with the f2 criterion. This last scenario is perhaps more plausible given the HVS-I network (Figure S3) and suggests that N1b2 evolved within Europe. The predominantly European subclades, which date to ∼10–13 ka ago, indicate that the expansion was indeed most likely pre-Neolithic.
The BSP of N1 (Figure S6A) shows major increments between 1.5 and 6.1 ka ago and between 8.8 and 13.4 ka ago (Table 1). These increments are consistent with the inferred sequential Neolithic and Late Glacial and/or postglacial expansions observed in the more common haplogroup I, but also in N1a and N1b.
N2 dates to around 44–50 ka ago. The few complete sequences of the rare N2a44 are from eastern Europe and the Caucasus, but the HVS-I database also indicates a minor presence in Iran, Arabia, and Ethiopia (Figure 2E). The major subclade of N2, haplogroup W, is much more frequent and widespread than N2a (Figure 2F) and reaches >10% frequency in some eastern-European populations (for example, it shows a strong founder effect in Finland 2–3 ka ago but also in the Black Sea region), but it is less common in the Near East and Arabia. Haplogroup W dates to ∼20 ka ago and has diversity indices for HVS-I peaking in southeast Europe, northwest Africa, and the Arabian Peninsula (Figures S4B and S5B). The HVS-I network suggests that an origin within Europe is plausible, given that Near Eastern lineages appear largely nested within primarily European clades. The complete sequence tree broadly supports this; there is a primary split between W1, which is predominantly European and dates to ∼13 ka ago, and a clade including W3–W6, all dating to the Late Glacial period. The major clades within W are not recognizable at the HVS-I level, so we rely on the complete sequence tree for more detailed phylogeographic inferences.
The W3′6 subclade, dating to ∼20 ka ago, includes some basal lineages from the Caucasus, Anatolia, and Yemen, suggesting in this case a center of gravity in the Near East. The fact that W3, W4, and W6 have basal lineages in the South Caucasus and Anatolia points to these regions as the source of the European diversity. The possible founders (in W4, W6, W3a, and W3b) and the European W5 mostly date to ∼13 ka ago, suggesting a Late Glacial expansion. Founder ages of W in HVS-I level indicate a peak at 11.5 ka ago with the f1 criterion and at 14.8 ka ago with the f2 criterion.
The BSP for N2 (Figure S6C) indicates an expansion period from 3–10 ka ago (Table 1). Without the data from the highly drifted Finnish haplogroup W (Figure S6D), the expansion peaks at ∼8 ka ago (Table 1). This peak suggests that although haplogroup W began its expansion during the Late Glacial period, it expanded locally within Europe during the Neolithic period.
Haplogroup X is most frequent in the Near East (Figure 2G), and the diversity indices (Figures S4C and S5C) also clearly indicate the Near East as its point of origin. It dates to ∼30 ka ago, and the TMRCA corresponds to the split between the very rare X4 (just two samples from Anatolia and Armenia) and the remaining clades. The second major split leads to X1, X3, and X2. X1 is largely restricted to the Near East and northeast Africa (from the HVS-I database). X3 is not recognizable at the HVS-I level, but the complete sequence tree suggests a similar Mediterranean distribution.
Haplogroup X2 is by far the most frequent and widespread subclade. Its basal branches (including X2f) are largely restricted to the Near East, the Caucasus, and northern Africa, but the main subclade of X2, defined by a transition at position 225 in HVS-II, includes Near Eastern, north-African, and European-specific subclades, as well as the X2a subclade, famously restricted to Native Americans. The root of X2+225 is probably the major founder sequence for dispersals involving haplogroup X, and its age of ∼21 ka offers an upper bound for the time of these dispersals.45 A curious feature of the tree is the possible connection of X2a to the north-African clade X2j through a mutation at position 12,397. However, this mutation might be a recurrence; X2j appears to be extremely recent. The rare X2g, also found only in Native Americans, indicates that the spread from the Near East toward the Americas could have begun as early as the emergence of the X2+225 clade, given that this could have been the only founder sequence.
X2b′d and X2c are most likely European in origin; the former dates to ∼20 ka ago and the latter to ∼9 ka ago (although the lower age may be indicating only an expansion within Europe). The founder sequence between the Near East and Europe is again the root of X2+225, suggesting the possibility that the expansion of this clade into Europe and toward America originated from the same initial process in the Near East. However, X2e2, which dates to ∼7 ka ago, might have spread to Europe during the Neolithic period.
In Europe, HVS-I founder ages for haplogroup X peak at ∼15 ka with the f1 criterion and at 16.5 ka with the f2 criterion, indicating that X, mostly X2+225, in Europe is primarily the result of Late Glacial expansions. The BSP (Figure S6B) indicates an increment beginning around this time (Table 1) and an additional increment in the Neolithic period, as suggested by the analysis of clades X2c and X2e2.
Although very rare and with patchy distributions today across western Eurasia, haplogroups N1, N2, and X, along with the much more common and widespread haplogroup R, were the first to branch from their haplogroup L3 ancestor as modern humans emerged from eastern Africa. The estimated age of their common ancestor, the root of haplogroup N, is ∼55–65 ka—very close to the upper bound for the out-of-Africa migration defined by the origin of L3 in eastern Africa 60–70 ka ago.6 This suggests that haplogroup N had an origin immediately outside Africa, most likely in the Arabian Peninsula. This region was probably also the cradle for haplogroup R, dating to ∼59 ka ago.14 In Southern Asia, only one new extant N(xR) branch, N5, arose; N5 is extremely rare and has also been recently described in Iran,46 raising the possibility that this lineage could also have arisen in Southwest Asia. A greater number of N(xR) branches exist in Eastern Asia, Southeast Asia, and Australasia, showing that N(xR) certainly crossed into this region, along with lineages within R.
It is thought that the arid conditions of marine isotope stage 4 (MIS 4; 75–60 ka ago), along with the Rub' al Khali desert and Asir Mountains as major barriers, closed off the corridors from the Arabian Peninsula to the Levant until ∼50 ka ago.9,12 This could explain the faster dispersal toward Southern Asia than toward Europe.7 Even during the most hyperarid phases, however, there were several refugia that provided food and fresh water in Arabia: the Red Sea basin and Asir-Yemeni highlands, the southwest Arabian littoral zone (including the Hadramawt in Yemen and southern Oman), and the Gulf Oasis.9 The latter, which lasted from 74–8 ka ago and formed the southeastern tip of the Fertile Crescent, included the exposed basin of the Arabo-Persian Gulf. The Oasis experienced periodic contractions into coastal margins during periods of low sea level and aridity and experienced expansions from the exposed shelf into the hinterland during pluvial episodes (from 55–24 ka ago during MIS 3 and again from 12–6 ka ago, after the LGM).9
The presence of archaeological sites in the Gulf basin demonstrates a long tradition of human occupation.9 However, neither direct cultural influences from the Levant nor any African influence has been detected in the Upper Palaeolithic (Late Pleistocene) lithics observed in eastern Arabia, pointing to a local development of cultural techniques.9,47 Curiously, however, the fact that some of the branches studied here include deep lineages in eastern Africa (haplogroups I, N1a, and N1f) shows that migration back to Africa occurred a number of times between 15 and 40 ka ago.
The hypothesized Gulf Oasis9 appears to be the most likely locus of the earliest branching of haplogroup N, including the three relict basal N(xR) haplogroups studied here, as well as the major Eurasian haplogroup R. Time estimates, frequencies, and genetic diversities reported here for these haplogroups are often similar between the Levant and Arabia, challenging the hypothesis of long-term isolation between these two regions. The other two refugia identified in the south and southwest of the Peninsula might have acted as a corridor for migrations west, back toward eastern Africa. Y chromosome microsatellite diversity in the Arabian Peninsula has suggested that Dubai and Oman share genetic affinities with other Near Eastern populations, whereas Saudi Arabia and Yemen show signs of greater isolation (although for fast-evolving microsatellites, these differences might reflect more recent events).48
Although the main branches of the haplogroup N tree appeared between 32 and 55 ka ago during the MIS 3 pluvial stage, these ancient episodes have been, to a considerable extent, overwritten by stronger signals of expansion at the end of the last ice age. These Late Glacial and postglacial expansions led to the dispersal of many subclades within these haplogroups across a much wider geographic area. All of the haplogroups analyzed here provide signs that Southwest Asia saw local population expansions from refugia, but Southwest Asia also acted as a reservoir for dispersals toward Africa (to northern Africa through the Levant and to eastern Africa via the Red Sea; for example, the deep lineages within N1a) and Europe. These N(xR) expansions match signals from several haplogroup R lineages both within Arabia49 and toward Africa.49,50
A possible exception is haplogroup W, within N2. W might conceivably have arrived in Europe prior to the LGM, but even for W, the most prominent signals are again Late Glacial and postglacial (including Neolithic) expansions. Indeed, a number of these lineages show evidence of Neolithic expansions, but these expansions were often of lineages that had already been residing in Europe since the end of the ice age. In the case of haplogroup W, there is also a strong signal of expansion within Europe, into the northeast ∼1.5–4 ka ago. Two branches within N1a (N1a1a1 and N1a1a2), detected at high frequencies in LBK (Linearbandkeramik) burials, also appear to have participated in local Neolithic expansions into central Europe but appear to have subsequently dwindled dramatically in frequency.17,18 Other lineages, such as I1a and X2e2, evidently did enter Europe from the Near East during the Neolithic period, indicating that lineages that are now found only at low frequencies participated in Neolithic dispersals from the Fertile Crescent. One of the most intriguing and mysterious signals is the migration of the major haplogroup X2 subclade not only across Europe and into central Asia but also into North America.
Whereas distinct episodes of dispersal and expansion into and within Europe (and indeed America) can be detected, demographic expansion in Southwest Asia appears as a continuous phenomenon from the Late Glacial period through to the Neolithic period. This genetic evidence is consistent with archaeological interpretations of the expansion of sedentary Natufian hamlets in the Levant during the wet phase between 15 and 13 ka ago. Such expansion lead to the techniques of agriculture and domestication under the harsher conditions of the Younger Dryas and ultimately to the Neolithic cultures of the early Holocene.51
Evidence that the Neolithic came to Arabia from the Fertile Crescent suggests the “Levantine hypothesis,” which states that there was a major population discontinuity between the Late Pleistocene and Early Holocene in Arabia and that Arabia was recolonized by Pre-Pottery Neolithic B Levantine people ∼9–8 ka ago.52 Our data suggest that, even if there were dispersals from the Near East into Arabia during the Neolithic period, not only do some lineages, such as R0a, of Near Eastern origin predate the spread of the Neolithic in Arabia,49 but a number of much more ancient lineages within N(xR) have survived, albeit at low frequencies. These lineages, which include N1a2, N1f, and possibly also N1c, N1d, and N1e, date to 15–55 ka ago and coalesce to the most ancient non-African mtDNA lineage ∼60 ka ago. Thus, they are most likely relicts from the first modern-human settlement in Arabia during the earliest stage of the southern coastal dispersal from the Horn of Africa to the rest of the world.
Acknowledgments
We thank Sergei and Oksana Rychkov, Mukaddes Golge, Jiří Hatina, Ariella Oppenheim, Dimitar Dimitrov, Mark Thomas, and the donors themselves for generously providing DNA samples. FCT, the Portuguese Foundation for Science and Technology, supported this work through the research project PTDC/CS-ANT/113832/2009 and the personal grants to V.F. (SFRH/BD/61342/2009), N.M.S. (SFRH/BD/69119/2010), J.B.P. (SFRH/BD/45657/2008), M.D.C. (SFRH/BD/48372/2008), and P.S. (SFRH/BPD/64233/2009). We also thank the Leverhulme Trust (research project grant 10 105/D) and the DeLaszlo Foundation for financial support to P.S. The Instituto de Patologia e Imunologia Molecular da Universidade do Porto is an Associate Laboratory of the Portuguese Ministry of Science, Technology, and Higher Education and is partially supported by FCT.
Supplemental Data
Web Resources
The URLs for data presented herein are as follows:
ArcView version 3.2, http://www.esri.com/software/arcgis/arcview/index.html
Calculator for converting ρ values and ML estimates to age estimates, http://www.fbs.leeds.ac.uk/staff/Richards/Soares_mtDNA_rate_calculator.xls
mtDNA-GeneSyn, http://www.ipatimup.pt/downloads/mtDNAGeneSyn.zip
Accession Numbers
The GenBank accession numbers for the sequences reported in this paper are JQ245723–JQ245807.
References
- 1.Macaulay V., Hill C., Achilli A., Rengo C., Clarke D., Meehan W., Blackburn J., Semino O., Scozzari R., Cruciani F. Single, rapid coastal settlement of Asia revealed by analysis of complete mitochondrial genomes. Science. 2005;308:1034–1036. doi: 10.1126/science.1109792. [DOI] [PubMed] [Google Scholar]
- 2.Thangaraj K., Chaubey G., Kivisild T., Reddy A.G., Singh V.K., Rasalkar A.A., Singh L. Reconstructing the origin of Andaman Islanders. Science. 2005;308:996. doi: 10.1126/science.1109987. [DOI] [PubMed] [Google Scholar]
- 3.Oppenheimer S. Robinson Publishing; London: 2003. Out of Eden: The peopling of the World. [Google Scholar]
- 4.Torroni A., Achilli A., Macaulay V., Richards M., Bandelt H.-J. Harvesting the fruit of the human mtDNA tree. Trends Genet. 2006;22:339–345. doi: 10.1016/j.tig.2006.04.001. [DOI] [PubMed] [Google Scholar]
- 5.Richards M., Bandelt H.J., Kivisild T., Oppenheimer S. A model for the dispersal of modern humans out of Africa. In: Bandelt H.-J., Macaulay V., Richards M., editors. Mitochondrial DNA and the evolution of Homo sapiens. Springer-Verlag; Berlin: 2006. pp. 225–265. [Google Scholar]
- 6.Soares P., Alshamali F., Pereira J.B., Fernandes V., Silva N.M., Afonso C., Costa M.D., Musilova E., Macaulay V., Richards M.B. The expansion of mtDNA haplogroup L3 within and out of Africa. Mol. Biol. Evol. 2012 doi: 10.1093/molbev/msr245. Published online November 16, 2011. [DOI] [PubMed] [Google Scholar]
- 7.Olivieri A., Achilli A., Pala M., Battaglia V., Fornarino S., Al-Zahery N., Scozzari R., Cruciani F., Behar D.M., Dugoujon J.-M. The mtDNA legacy of the Levantine early Upper Palaeolithic in Africa. Science. 2006;314:1767–1770. doi: 10.1126/science.1135566. [DOI] [PubMed] [Google Scholar]
- 8.Soares P., Ermini L., Thomson N., Mormina M., Rito T., Röhl A., Salas A., Oppenheimer S., Macaulay V., Richards M.B. Correcting for purifying selection: An improved human mitochondrial molecular clock. Am. J. Hum. Genet. 2009;84:740–759. doi: 10.1016/j.ajhg.2009.05.001. [DOI] [PMC free article] [PubMed] [Google Scholar]
- 9.Rose J.I. New light on human prehistory in the Arabo-Persian Gulf Oasis. Curr. Anthropol. 2010;51:849–883. [Google Scholar]
- 10.Armitage S.J., Jasim S.A., Marks A.E., Parker A.G., Usik V.I., Uerpmann H.P. The southern route “out of Africa”: Evidence for an early expansion of modern humans into Arabia. Science. 2011;331:453–456. doi: 10.1126/science.1199113. [DOI] [PubMed] [Google Scholar]
- 11.Shea J.J. Transitions or turnovers? Climatically-forced extinctions of Homo sapiens and Neandertals in the East Mediterranean Levant. Quat. Sci. Rev. 2008;27:2253–2270. [Google Scholar]
- 12.van Andel T.H., Tzedakis P.C. Palaeolithic landscapes of Europe and environs, 150,000-25,000 years ago: An overview. Quat. Sci. Rev. 1996;15:481–500. [Google Scholar]
- 13.Metspalu M., Kivisild T., Metspalu E., Parik J., Hudjashov G., Kaldma K., Serk P., Karmin M., Behar D.M., Gilbert M.T. Most of the extant mtDNA boundaries in south and southwest Asia were likely shaped during the initial settlement of Eurasia by anatomically modern humans. BMC Genet. 2004;5:26. doi: 10.1186/1471-2156-5-26. [DOI] [PMC free article] [PubMed] [Google Scholar]
- 14.Soares P., Achilli A., Semino O., Davies W., Macaulay V., Bandelt H.J., Torroni A., Richards M.B. The archaeogenetics of Europe. Curr. Biol. 2010;20:R174–R183. doi: 10.1016/j.cub.2009.11.054. [DOI] [PubMed] [Google Scholar]
- 15.Hudjashov G., Kivisild T., Underhill P.A., Endicott P., Sanchez J.J., Lin A.A., Shen P., Oefner P., Renfrew C., Villems R., Forster P. Revealing the prehistoric settlement of Australia by Y chromosome and mtDNA analysis. Proc. Natl. Acad. Sci. USA. 2007;104:8726–8730. doi: 10.1073/pnas.0702928104. [DOI] [PMC free article] [PubMed] [Google Scholar]
- 16.Richards M., Macaulay V., Hickey E., Vega E., Sykes B., Guida V., Rengo C., Sellitto D., Cruciani F., Kivisild T. Tracing European founder lineages in the Near Eastern mtDNA pool. Am. J. Hum. Genet. 2000;67:1251–1276. [PMC free article] [PubMed] [Google Scholar]
- 17.Haak W., Forster P., Bramanti B., Matsumura S., Brandt G., Tänzer M., Villems R., Renfrew C., Gronenborn D., Alt K.W., Burger J. Ancient DNA from the first European farmers in 7500-year-old Neolithic sites. Science. 2005;310:1016–1018. doi: 10.1126/science.1118725. [DOI] [PubMed] [Google Scholar]
- 18.Palanichamy M.G., Zhang C.L., Mitra B., Malyarchuk B., Derenko M., Chaudhuri T.K., Zhang Y.P. Mitochondrial haplogroup N1a phylogeography, with implication to the origin of European farmers. BMC Evol. Biol. 2010;10:304. doi: 10.1186/1471-2148-10-304. [DOI] [PMC free article] [PubMed] [Google Scholar]
- 19.Kivisild T., Reidla M., Metspalu E., Rosa A., Brehm A., Pennarun E., Parik J., Geberhiwot T., Usanga E., Villems R. Ethiopian mitochondrial DNA heritage: Tracking gene flow across and around the gate of tears. Am. J. Hum. Genet. 2004;75:752–770. doi: 10.1086/425161. [DOI] [PMC free article] [PubMed] [Google Scholar]
- 20.Behar D.M., Metspalu E., Kivisild T., Achilli A., Hadid Y., Tzur S., Pereira L., Amorim A., Quintana-Murci L., Majamaa K. The matrilineal ancestry of Ashkenazi Jewry: Portrait of a recent founder event. Am. J. Hum. Genet. 2006;78:487–497. doi: 10.1086/500307. [DOI] [PMC free article] [PubMed] [Google Scholar]
- 21.Behar D.M., Metspalu E., Kivisild T., Rosset S., Tzur S., Hadid Y., Yudkovsky G., Rosengarten D., Pereira L., Amorim A. Counting the founders: The matrilineal genetic ancestry of the Jewish Diaspora. PLoS ONE. 2008;3:e2062. doi: 10.1371/journal.pone.0002062. [DOI] [PMC free article] [PubMed] [Google Scholar]
- 22.Reidla M., Kivisild T., Metspalu E., Kaldma K., Tambets K., Tolk H.V., Parik J., Loogväli E.L., Derenko M., Malyarchuk B. Origin and diffusion of mtDNA haplogroup X. Am. J. Hum. Genet. 2003;73:1178–1190. doi: 10.1086/379380. [DOI] [PMC free article] [PubMed] [Google Scholar]
- 23.Perego U.A., Achilli A., Angerhofer N., Accetturo M., Pala M., Olivieri A., Kashani B.H., Ritchie K.H., Scozzari R., Kong Q.-P. Distinctive Paleo-Indian migration routes from Beringia marked by two rare mtDNA haplogroups. Curr. Biol. 2009;19:1–8. doi: 10.1016/j.cub.2008.11.058. [DOI] [PubMed] [Google Scholar]
- 24.Shlush L.I., Behar D.M., Yudkovsky G., Templeton A., Hadid Y., Basis F., Hammer M., Itzkovitz S., Skorecki K. The Druze: A population genetic refugium of the Near East. PLoS ONE. 2008;3:e2105. doi: 10.1371/journal.pone.0002105. [DOI] [PMC free article] [PubMed] [Google Scholar]
- 25.Pereira L., Freitas F., Fernandes V., Pereira J.B., Costa M.D., Costa S., Máximo V., Macaulay V., Rocha R., Samuels D.C. The diversity present in 5140 human mitochondrial genomes. Am. J. Hum. Genet. 2009;84:628–640. doi: 10.1016/j.ajhg.2009.04.013. [DOI] [PMC free article] [PubMed] [Google Scholar]
- 26.Cerný V., Mulligan C.J., Rídl J., Zaloudková M., Edens C.M., Hájek M., Pereira L. Regional differences in the distribution of the sub-Saharan, West Eurasian, and South Asian mtDNA lineages in Yemen. Am. J. Phys. Anthropol. 2008;136:128–137. doi: 10.1002/ajpa.20784. [DOI] [PubMed] [Google Scholar]
- 27.Cerný V., Pereira L., Kujanová M., Vasíková A., Hájek M., Morris M., Mulligan C.J. Out of Arabia-the settlement of island Soqotra as revealed by mitochondrial and Y chromosome genetic diversity. Am. J. Phys. Anthropol. 2009;138:439–447. doi: 10.1002/ajpa.20960. [DOI] [PubMed] [Google Scholar]
- 28.Alshamali F., Brandstätter A., Zimmermann B., Parson W. Mitochondrial DNA control region variation in Dubai, United Arab Emirates. Forensic Sci. Int. Genet. 2008;2:e9–e10. doi: 10.1016/j.fsigen.2007.08.005. [DOI] [PubMed] [Google Scholar]
- 29.Harich N., Costa M.D., Fernandes V., Kandil M., Pereira J.B., Silva N.M., Pereira L. The trans-Saharan slave trade - clues from interpolation analyses and high-resolution characterization of mitochondrial DNA lineages. BMC Evol. Biol. 2010;10:138. doi: 10.1186/1471-2148-10-138. [DOI] [PMC free article] [PubMed] [Google Scholar]
- 30.Cherni L., Fernandes V., Pereira J.B., Costa M.D., Goios A., Frigi S., Yacoubi-Loueslati B., Amor M.B., Slama A., Amorim A. Post-last glacial maximum expansion from Iberia to North Africa revealed by fine characterization of mtDNA H haplogroup in Tunisia. Am. J. Phys. Anthropol. 2009;139:253–260. doi: 10.1002/ajpa.20979. [DOI] [PubMed] [Google Scholar]
- 31.Pereira L., Gonçalves J., Franco-Duarte R., Silva J., Rocha T., Arnold C., Richards M., Macaulay V. No evidence for an mtDNA role in sperm motility: Data from complete sequencing of asthenozoospermic males. Mol. Biol. Evol. 2007;24:868–874. doi: 10.1093/molbev/msm004. [DOI] [PubMed] [Google Scholar]
- 32.Andrews R.M., Kubacka I., Chinnery P.F., Lightowlers R.N., Turnbull D.M., Howell N. Reanalysis and revision of the Cambridge reference sequence for human mitochondrial DNA. Nat. Genet. 1999;23:147. doi: 10.1038/13779. [DOI] [PubMed] [Google Scholar]
- 33.van Oven M., Kayser M. Updated comprehensive phylogenetic tree of global human mitochondrial DNA variation. Hum. Mutat. 2009;30:E386–E394. doi: 10.1002/humu.20921. [DOI] [PubMed] [Google Scholar]
- 34.Bandelt H.-J., Forster P., Sykes B.C., Richards M.B. Mitochondrial portraits of human populations using median networks. Genetics. 1995;141:743–753. doi: 10.1093/genetics/141.2.743. [DOI] [PMC free article] [PubMed] [Google Scholar]
- 35.Forster P., Harding R., Torroni A., Bandelt H.-J. Origin and evolution of Native American mtDNA variation: A reappraisal. Am. J. Hum. Genet. 1996;59:935–945. [PMC free article] [PubMed] [Google Scholar]
- 36.Drummond A.J., Rambaut A., Shapiro B., Pybus O.G. Bayesian coalescent inference of past population dynamics from molecular sequences. Mol. Biol. Evol. 2005;22:1185–1192. doi: 10.1093/molbev/msi103. [DOI] [PubMed] [Google Scholar]
- 37.Atkinson Q.D., Gray R.D., Drummond A.J. Bayesian coalescent inference of major human mitochondrial DNA haplogroup expansions in Africa. Proc. Biol. Sci. 2009;276:367–373. doi: 10.1098/rspb.2008.0785. [DOI] [PMC free article] [PubMed] [Google Scholar]
- 38.Drummond A.J., Rambaut A. BEAST: Bayesian evolutionary analysis by sampling trees. BMC Evol. Biol. 2007;7:214. doi: 10.1186/1471-2148-7-214. [DOI] [PMC free article] [PubMed] [Google Scholar]
- 39.Pereira L., Silva N.M., Franco-Duarte R., Fernandes V., Pereira J.B., Costa M.D., Martins H., Soares P., Behar D.M., Richards M.B., Macaulay V. Population expansion in the North African late Pleistocene signalled by mitochondrial DNA haplogroup U6. BMC Evol. Biol. 2010;10:390. doi: 10.1186/1471-2148-10-390. [DOI] [PMC free article] [PubMed] [Google Scholar]
- 40.Barker G., Barton H., Bird M., Daly P., Datan I., Dykes A., Farr L., Gilbertson D., Harrisson B., Hunt C. The ‘human revolution’ in lowland tropical Southeast Asia: The antiquity and behavior of anatomically modern humans at Niah Cave (Sarawak, Borneo) J. Hum. Evol. 2007;52:243–261. doi: 10.1016/j.jhevol.2006.08.011. [DOI] [PubMed] [Google Scholar]
- 41.Haak W., Balanovsky O., Sanchez J.J., Koshel S., Zaporozhchenko V., Adler C.J., Der Sarkissian C.S., Brandt G., Schwarz C., Nicklisch N., Members of the Genographic Consortium Ancient DNA from European early neolithic farmers reveals their near eastern affinities. PLoS Biol. 2010;8:e1000536. doi: 10.1371/journal.pbio.1000536. [DOI] [PMC free article] [PubMed] [Google Scholar]
- 42.Bramanti B., Thomas M.G., Haak W., Unterlaender M., Jores P., Tambets K., Antanaitis-Jacobs I., Haidle M.N., Jankauskas R., Kind C.J. Genetic discontinuity between local hunter-gatherers and central Europe's first farmers. Science. 2009;326:137–140. doi: 10.1126/science.1176869. [DOI] [PubMed] [Google Scholar]
- 43.Richards M., Rengo C., Cruciani F., Gratrix F., Wilson J.F., Scozzari R., Macaulay V., Torroni A. Extensive female-mediated gene flow from sub-Saharan Africa into near eastern Arab populations. Am. J. Hum. Genet. 2003;72:1058–1064. doi: 10.1086/374384. [DOI] [PMC free article] [PubMed] [Google Scholar]
- 44.Derbeneva O.A., Starikovskaia E.B., Volod'ko N.V., Wallace D.C., Sukernik R.I. Mitochondrial DNA variation in Kets and Nganasans and the early peoples of Northern Eurasia. Genetika. 2002;38:1554–1560. [PubMed] [Google Scholar]
- 45.Hooshiar Kashani B., Perego U.A., Olivieri A., Angerhofer N., Gandini F., Carossa V., Lancioni H., Semino O., Woodward S.R., Achilli A. Mitochondrial haplogroup C4c: A rare lineage entering America through the ice-free corridor? Am. J. Phys. Anthropol. 2012;147:35–39. doi: 10.1002/ajpa.21614. Published online October 24, 2011. [DOI] [PubMed] [Google Scholar]
- 46.Ashrafian-Bonab M., Lawson Handley L.J., Balloux F. Is urbanization scrambling the genetic structure of human populations? A case study. Heredity (Edinb) 2007;98:151–156. doi: 10.1038/sj.hdy.6800918. [DOI] [PMC free article] [PubMed] [Google Scholar]
- 47.Maher L.A. The Late Pleistocene of Arabia in relation to the Levant. In: Petraglia M.D., Rose J.I., editors. The Evolution of Human Populations in Arabia: Paleoenvironments, Prehistory, and Genetics. Springer; New York: 2009. pp. 187–202. [Google Scholar]
- 48.Alshamali F., Pereira L., Budowle B., Poloni E.S., Currat M. Local population structure in Arabian Peninsula revealed by Y-STR diversity. Hum. Hered. 2009;68:45–54. doi: 10.1159/000210448. [DOI] [PubMed] [Google Scholar]
- 49.Černý V., Pereira L., Musilová E., Kujanová M., Vašíková A., Blasi P., Garofalo L., Soares P., Diallo I., Brdička R., Novelletto A. Genetic structure of pastoral and farmer populations in the African Sahel. Mol. Biol. Evol. 2011;28:2491–2500. doi: 10.1093/molbev/msr067. [DOI] [PubMed] [Google Scholar]
- 50.Musilová E., Fernandes V., Silva N.M., Soares P., Alshamali F., Harich N., Cherni L., Gaaied A.B., Al-Meeri A., Pereira L., Cerný V. Population history of the Red Sea—genetic exchanges between the Arabian Peninsula and East Africa signaled in the mitochondrial DNA HV1 haplogroup. Am. J. Phys. Anthropol. 2011;145:592–598. doi: 10.1002/ajpa.21522. [DOI] [PubMed] [Google Scholar]
- 51.Bar-Yosef O. The Natufian culture in the Levant, threshold to the origins of agriculture. Evol. Anthropol. 1998;6:159–177. [Google Scholar]
- 52.Uerpmann H.P., Potts D.T., Uerpmann M. Holocene (re-)occupation of Eastern Arabia. In: Petraglia M.D., Rose J.I., editors. The Evolution of Human Populations in Arabia: Paleoenvironments, Prehistory, and Genetics. Springer; New York: 2009. pp. 205–214. [Google Scholar]
Associated Data
This section collects any data citations, data availability statements, or supplementary materials included in this article.