

Abstract
Protein aggregates that accumulate in neurodegenerative diseases are important targets of radiotracer discovery efforts. Although multiple scaffold classes have been reported to bind cross-beta sheet structure, their mechanism of binding and their ability to interact selectively with aggregates of varying protein composition are not well understood. Here we take a ligand-based quantitative structure activity relationship approach to identify descriptors of binding affinity and selectivity for a series of fifty closely related benzothiazole derivatives reported to displace Thioflavin T fluorescent probe from synthetic aggregates composed of beta-amyloid peptide and insulin. Using a two-step workflow involving both partial least squares and multiple linear regression methods, compound polarizability and hydrophobicity were identified as tunable mediators of binding selectivity. The correlations also revealed how polarizability could be modulated in neutral compounds having push-pull character. These data suggest that the relative affinity of small molecules for binding sites exposed on aggregate surfaces can be modulated by simple chemical design considerations that are compatible with multiple scaffolds.
Keywords: Protein ligand interaction, QSAR, polarizability, dispersion forces, Alzheimer's disease
1. Introduction
Whole-brain imaging is a powerful approach for premortem diagnosis of Alzheimer's disease (AD) and potentially other neurodegenerative disorders associated with protein misfolding.1 Although radiotracers capable of binding AD lesions composed of Aβ aggregates are in advanced clinical trials, neither their mechanism of binding nor their target binding specificity is well defined. This is because the protein aggregates that appear in neurodegenerative disorders share cross-ß sheet conformation, characterized by parallel, in register β sheets oriented perpendicular to fibril axes.2 Unlike three-dimensional pockets that appear on traditional globular protein targets, fibril surfaces present only shallow grooves and channels that are shaped primarily by amino acid residue side chains.3, 4 The resulting common structural organization would appear to limit opportunities for selective molecular interactions. Nonetheless, recent studies have reported binding selectivity for small molecules among aggregates at the level of binding affinity, suggesting the feasibility of tuning binding interactions.5, 6 If the problem of binding selectivity were overcome, the utility of whole-brain imaging for differential diagnosis and staging of individual neurodegenerative disorders could be greatly improved.
Few experimentally-derived structural models of small molecule binding sites on amyloid fibrils have been disclosed to date,4 and structure-activity relationship studies, which aim to rationalize compound affinity for biological targets, have not been interpreted in the context of target selectivity.7–10 Our investigation of binding selectivity has focused on protein aggregate targets associated with Alzheimer's and Lewy body diseases such as Aβ, tau, and α-synuclein.6 Using a competition assay with Thioflavin T (ThT), a fluorescent probe of cross-β sheet structure, we identified cationic polymethine dyes as especially potent displacers of ThT from AD lesions composed of tau protein.11 These compounds share a planar, fairly rigid structure combined with highly delocalized aromatic π-electrons. Because of these properties, the most potent compounds investigated were highly polarizable, and therefore capable of supporting strong van der Waals interactions with flat surfaces exposed on fibrils. These data suggested compound polarizability as a descriptor for the tau-fibril binding affinity of dyes.11 Nonetheless, it was not clear from the correlations whether polarizability could be leveraged to generate selective binding among protein aggregates, or how this parameter could be maintained in neutral analogs capable of crossing the blood brain barrier.
To address these questions and to identify additional descriptors of aggregate binding affinity, we have turned to quantitative structure activity relationship (QSAR) analysis. The experimental input data for this computational study was compiled from the literature, and consisted of closely related neutral and cationic benzothiazole derivatives tested for their ability to displace ThT from synthetic aggregates prepared from Aβ40 and insulin.12 The datasets, which included 50 compound structures and their associated AC50 values (Table 1), were chosen for QSAR analysis because they probed two aggregate targets of distinct composition while spanning three orders of magnitude in affinity for each. Second, the benzothiazole scaffold is under extensive investigation for whole-brain imaging purposes, with demonstrated affinity for aggregates composed of tau or Aβ.13, 14 Importantly, the potency of certain compounds in the series extend to radiotracer concentrations (low nanomolar). Finally, certain members of the series have been extensively characterized with respect to optical and electrical properties.15–19 The results confirm polarizability as a major descriptor of relative binding affinity of the series for cross-β sheet aggregates, and show how this parameter can be maximized in neutral analogs.
Table 1.
Compound structures and characteristics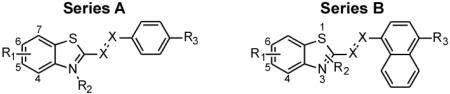
| AC50 | |||||||||||
|---|---|---|---|---|---|---|---|---|---|---|---|
| # | R1 | R2a | R3 | X | Aβb (nM) | Insulinb (nM) | Slc | α (Å3) | μ (D) | clogP | RBF (%) |
| 1A | 5-Cl | --- | NMe2 | c | >100000 | >100000 | 1 | 70.7 | 10.9 | 5.24 | 7.9 |
| 2A | H | --- | NMe2 | C | >100000 | 1200 | 83 | 66.7 | 7.71 | 4.58 | 7.9 |
| 3A | 6-NMe2 | --- | NMe2 | C | >100000 | 6000 | 16 | 79.1 | 3.69 | 4.66 | 8.7 |
| 4A | H | Et | NMe2 | C | 400 | 6 | 67 | 79.9 | 3.24 | 1.80 | 8.9 |
| 5A | H | Me | NMe2 | C | 1000 | 3 | 333 | 77.7 | 3.10 | 1.42 | 7.1 |
| 6A | 5-Cl | Me | NMe2 | C | 430 | 5.2 | 83 | 82.1 | 7.58 | 2.08 | 7.1 |
| 7A | 5-F | Me | NMe2 | C | 1000 | 10 | 100 | 78.2 | 5.74 | 1.56 | 7.1 |
| 8A | 5-Me | Me | NMe2 | C | 400 | 7.5 | 53 | 80.9 | 3.54 | 1.85 | 6.7 |
| 9A | 6-Me | Me | NMe2 | C | 180 | 6 | 30 | 81.2 | 3.47 | 1.85 | 6.7 |
| 10A | 6-OMe | Me | NMe2 | C | 300 | 8 | 38 | 83.6 | 5.23 | 1.45 | 8.7 |
| 11A | 6-NO2 | Me | NMe2 | C | 1000 | 12 | 83 | 85.1 | 13.1 | 1.42 | 9.1 |
| 12A | H | --- | NMe2 | N | 22000 | 1200 | 18 | 72.3 | 10.7 | 4.79 | 8.3 |
| 13A | 6-OMe | --- | NMe2 | N | 3200 | 700 | 5 | 79.7 | 9.57 | 4.82 | 10.0 |
| 14A | 6-Cl | --- | NMe2 | N | 1300 | 1300 | 1 | 77.1 | 13.3 | 5.44 | 8.3 |
| 15A | 6-OMe | Me | NMe2 | N | 410 | 10 | 41 | 87.6 | 8.82 | 1.15 | 9.1 |
| 16A | H | Me | NMe2 | N | 1300 | 60 | 22 | 79.0 | 7.35 | 1.12 | 7.5 |
| 17A | H |
|
NMe2 | C | 110 | 12 | 9 | 91.6 | 4.00 | 3.02 | 9.4 |
| 18A | H | CH2CHCH2 | NMe2 | C | 300 | 12 | 25 | 82.5 | 2.47 | 2.07 | 10.9 |
| 19A | H | (CH2)3Me | NMe2 | C | 160 | 27 | 6 | 84.7 | 2.46 | 2.86 | 11.8 |
| 20A | H | (CH2)6Me | NMe2 | C | 93 | 83 | 1 | 91.7 | 5.31 | 4.37 | 15.0 |
| 21A | 5-F |
|
NMe2 | C | 170 | 32 | 5 | 92.6 | 8.42 | 3.16 | 9.4 |
| 22A | 6-Me |

|
NMe2 | C | 130 | 50 | 3 | 95.3 | 4.57 | 3.44 | 8.9 |
| 23A | 6-OMe | (CH2)6Me | NMe2 | C | 140 | 40 | 4 | 97.4 | 4.41 | 4.41 | 15.6 |
| 24A | H |
|
NMe2 | C | 120 | 42 | 3 | 91.4 | 6.27 | 3.18 | 9.4 |
| 25A | H |
|
NMe2 | C | 240 | 34 | 7 | 107.1 | 8.80 | 4.81 | 9.4 |
| 26A | H |
|
NMe2 | C | 100 | 80 | 1 | 106.2 | 5.74 | 4.76 | 9.4 |
| 27A | H |
|
NMe2 | C | 230 | 130 | 2 | 109.2 | 9.12 | 4.86 | 11.9 |
| 28A | H |
|
NMe2 | C | 120 | 180 | 1 | 106.4 | 9.54 | 4.75 | 10.8 |
| 29A | H |
|
NMe2 | C | 200 | 210 | 1 | 95.5 | 6.78 | 3.74 | 11.9 |
| 30A | H |
|
NMe2 | C | 100 | 80 | 1 | 99.1 | 6.67 | 3.77 | 10.5 |
| 31A | H |
|
NMe2 | C | 460 | 210 | 2 | 111.9 | 10.3 | 5.15 | 12.3 |
| 32A | H |
|
NMe2 | C | 140 | 52 | 3 | 98.8 | 5.60 | 3.27 | 14.3 |
| 33A | H |
|
NMe2 | C | 170 | 93 | 2 | 98.9 | 7.41 | 3.64 | 14.3 |
| 34A | H |
|
NMe2 | C | 170 | 80 | 2 | 100.5 | 10.9 | 4.52 | 13.8 |
| 35A | H |
|
NMe2 | C | 170 | 80 | 2 | 100.5 | 10.9 | 4.15 | 13.8 |
| 36A | H |
|
NMe2 | C | 120 | 52 | 2 | 93.3 | 4.74 | 4.16 | 9.7 |
| 37A | H | (CH2)6Me | NEt2 | C | 140 | 120 | 1 | 97.5 | 3.80 | 5.13 | 16.7 |
| 38A | H | (CH2)6Me | N((CH2)3Me)2 | C | 600 | 90 | 7 | 108.0 | 4.59 | 7.25 | 19.2 |
| 39A | H | (CH2)6Me | pyrrolyl | C | 160 | 42 | 4 | 89.0 | 9.54 | 4.53 | 14.8 |
| 40A | (4,5) benzyl | Me | NMe2 | C | 210 | 53 | 4 | 92.1 | 4.70 | 2.58 | 6.1 |
| 41A | (4,5) benzyl | Me | NMe2 | C | 210 | 41 | 5 | 94.8 | 5.00 | 2.96 | 7.7 |
| 42A | (5,6) benzyl | Me | NMe2 | C | 120 | 120 | 1 | 96.5 | 7.80 | 2.58 | 6.1 |
| 43A | (6,7) benzyl | Me | NMe2 | C | 210 | 41 | 5 | 93.9 | 6.15 | 2.96 | 7.7 |
| 44A | H |
|
NMe2 | C | 120 | 13 | 9 | 103.1 | 6.96 | 4.20 | 9.5 |
| 45B | H | 3-(CH2)6Me | NMe2 | C | 160 | 40 | 4 | 103.4 | 3.29 | 5.31 | 13.4 |
| 46B | 6-OMe | 3-Me | NMe2 | C | 430 | 26 | 17 | 96.0 | 4.41 | 2.76 | 8.9 |
| 47B | (4,5) benzyl | 1-Me | NMe2 | C | 250 | 42 | 6 | 114.0 | 4.27 | 3.37 | 6.8 |
| 48B | H | --- | NH2 | N | 120 | 130 | 1 | 78.0 | 5.27 | 5.28 | 5.4 |
| 49B | 6-OMe | --- | NMe2 | N | 2500 | 340 | 7 | 94.6 | 9.42 | 5.93 | 8.5 |
| 50B | (4,5) benzyl | --- | NMe2 | N | 52000 | 16000 | 3 | 104.5 | 9.69 | 7.06 | 6.0 |
R2 group abbreviations: none (---), methyl (Me), ethyl (Et).
AC50 is the concentration of compound needed to decrease ThT probe fluorescence by 50%. Inactive compounds, defined as AC50 ≥ 100,000 nM, were arbitrarily assigned an AC50 of 100,000 nM for QSAR training and testing.
Selectivity Index (SI) is the ratio of Aβ40:insulin AC50 values.
2. Results
2.1. Experimental data, descriptor sets, and workflow
To identify potential drivers of binding affinity and selectivity for Aβ40 and insulin aggregates, a three-step workflow was adopted (Fig. 1). First, the > 1600 descriptors available in E-DRAGON were calculated for all Series A and B molecules (shown in Table 1). Because these compounds were flat and dye-like, the starting E-DRAGON descriptor set was pruned on the basis of reported dye adsorption QSAR studies20, 21 to yield a focused molecular property set comprising 278 descriptors representing five logical blocks: 48 constitutional descriptors, 33 connectivity indices, 154 functional group counts, 14 charge descriptors, and 29 molecular properties. The pruned descriptor set was then augmented with separately calculated clogP and topological polar surface area values to improve estimation accuracy,22 and polarizability (α) and dipole moment (μ) values to explicitly capture the contribution of these quantum parameters to biological activity. In the second step, a partial least squares regression (PLR) QSAR approach was taken to screen for candidate descriptors for displacement activity. Finally, the top descriptors identified by PLR were used to build and validate multiple linear regression (MLR) models for both Aβ40 and insulin targets. This was done to generate unambiguous predictive models that could be interpreted in mechanistic terms with maximum simplicity, transparency, and portability.
Fig. 1.

QSAR modeling workflow, in which chemical structure and affinity data (circles) were integrated with calculated molecular descriptors (pentagons) and screened using PLR methods (diamond). Top descriptors were then subjected to MLR to create the final QSAR models (rectangle).
2.2. Descriptors for relative ThT displacement affinity
To identify the best combination of the descriptors described above for predicting ThT displacement AC50, the datasets were subjected to QSAR analysis using a genetic algorithm-PLR method. The optimal Aβ40 model consisted of 28 molecular descriptors (x variables) collapsed into 11 linear combinations (latent t variables), whereas the insulin model consisted of 22 x variables collapsed into four latent t variables (Table 2). The resulting Y-correlations were adequately strong (as judged by the correlation coefficient, R2) and stable (on the basis of bootstrap cross validation; Q2boot) for both target models (Table 2).23
Table 2.
PLR models and statistics for Aβ and insulin.
| PLR statistic | Aβ model | insulin model |
|---|---|---|
| t variables | 10 | 4 |
| x variables | 28 | 22 |
| Y correlation | 0.96 | 0.89 |
| X correlation | 0.99 | 0.96 |
| RMSEloo | 0.48 | 0.51 |
| Q 2 loo | 0.77 | 0.74 |
The four highest-weighted and therefore top-ranked descriptors for the Aβ40 model represented four different logical blocks, and included average high-order valence connectivity 5χv, α, clogP, and rotatable bond fraction (RBF) (Table 3). Valence connectivities 4χv and 5χv describe the summed contributions of contiguous four- and five-bond fragments to activity, and are particularly sensitive to the presence of high-valence heteroatoms and double bonds.24, 25 Although lacking a straightforward chemical interpretation in the current context, the negative coefficient for average 5χv indicates that increasing higher order average valence connectivity correlates with decreasing ThT displacement activity. The polarizability term α describes how easily electron density can shift about the molecule when exposed to an external electric field, such as an adjacent dipole or ion.26 The positive coefficient indicates that increasing polarizability correlates with increasing potency. ClogP is the log of the calculated octanol/water partition coefficient.27 Although logP^2 descriptors were part of the molecular descriptor set screened with PLR, a linear dependence on hydrophobicity yielded the best correlation of the dataset. The negative sign of clogP indicates that hydrophobicity decreases displacement potency in the context of Series A and B molecules. RBF is the fraction of rotatable bonds (i.e., the ratio of rotatable to total number of bonds).27 The positive sign of RBF indicates that increasing torsional freedom of atoms outside the rigid aromatic core allows these compounds to achieve maximal displacement potency.
Table 3.
Top-ranked PLR descriptors for Aβ40 and insulin pAC50 (+, direct correlation; −, inverse correlation)
| Rank | Aβ40 descriptors | Logical block | Insulin descriptors | Logical block |
|---|---|---|---|---|
| 1 | (−) average 5χv | Topological | (+) hydrophilic factor (Hy) | Chemical |
| 2 | (+) polarizability (α) | Quantum | (+) topological electronic factor (TE1) | Topological |
| 3 | (–) clogP | Chemical | (+) average 4χv | Topological |
| 4 | (+) RBF | Constitutional | (+) charge polarization factor (Qmean) | Topological |
The model for insulin aggregate displacement activity identified molecular descriptors complementary to the Aβ40 model including hydrophilic factor, topological electronic factor, charge polarization factor, and average 4χv (Table 3). The hydrophilic factor is an empirically determined index based on the number of hydrophilic groups in molecules.27 The positive coefficient for this parameter indicates that hydrophilic groups increased displacement activity against insulin aggregates. The topological electronic factor calculates the differences in partial atomic charges with respect to interatomic distance.27 It correlated weakly with polarizability in Series A and B molecules (R2 = 0.63). The positive sign indicates that displacement affinity increased in parallel with this parameter. Finally, charge polarization, which incorporates the effect of large heteroatoms in electrotopology,27 also correlated with polarizability in the datasets (R2 = 0.75). The positive coefficient indicates that displacement potency against insulin aggregates increased in parallel with this descriptor.
Overall, these results are consistent with both molecular targets sharing a common cross-β sheet structure presenting similar yet distinct binding sites along their surfaces.
2.3. Construction and validation of predictive MLR models
To generate predictive QSAR models, the top-ranked chemical, quantum, and constitutional descriptors identified by PLR screening (α, clogP and RBF) were analyzed using an MLR approach. Dipole moment magnitude (μ) was used in place of topological descriptors so that each of the four final descriptors had simple chemical interpretations. Although dipole moment magnitude was not identified as a candidate descriptor in the PLR screen, it has been proposed to contribute to the aggregate binding affinity of small molecules,28 and so was included in the MLR analysis for this reason. The final four individual descriptors intercorrelated only weakly when compared pairwise in a correlation matrix (Table 4), and were appropriate in number for the size of training sets used in the analysis (i.e., the ratio of training compounds:descriptors was > 8:1).29 In addition, variance inflation values were low for all parameters (Table 4), indicating that the variance associated with each descriptor was independent of the others. These data indicated that the final descriptor set was appropriate for modeling the affinity and selectivity characteristics of Aβ40 and insulin aggregates.
Table 4.
Correlation matrixa
| Descriptor | α | μ | clogP | RBF | VIFb |
|---|---|---|---|---|---|
| α | 1 | 1.48 | |||
| μ | 0.08 | 1 | 1.13 | ||
| clogP | 0.34 | −0.02 | 1 | 1.36 | |
| RBF | 0.56 | 0.27 | 0.48 | 1 | 1.88 |
Correlation coefficient (Rij); where 0.5 < Rij < 0.8 signifies weak intercorrelation, and Rij < 0.5 signifies little or no intercorrelation.
Variance inflation factor (VIF) = 1/(1-R2j); VIF < 10 signifies weak multicollinearity
To prepare MLR models, the Aβ40 and insulin datasets were split into training and test sets of 44 and six molecules, respectively, with initial MLR calibration performed on the former. However, subsequent modeling identified compounds 3A, 14A and 48B as outliers (i.e., the calculated pAC50 deviated from the observed pAC50 by more than 1 log unit for both targets), and so these were excluded from further analysis. The final training sets consisted of 41 compounds, composed of 38 actives/3 inactives for Aβ40, and 40 actives/1 inactive for insulin. Final MLR calibration yielded two equations for the prediction of AC50:
| (1) |
| (2) |
These models were adequately correlated (as judged by R2 = 0.73 and 0.74 for Aβ40 and insulin training sets, respectively; Fig. 2), consistent (on the basis of residual standard error; s = 0.38 and 0.44 for Aβ40 and insulin, respectively) and stable (on the basis of bootstrap cross validation; Q2boot = 0.63 and 0.60 for Aβ40 and insulin, respectively). To test statistical robustness, the models were subjected to Y-randomization tests. When the response data for each calibration compound was randomly shuffled 250 times and correlated with unchanged descriptor values, observed Q2boot values ranged from 0 – 0.453 for Aβ40 and 0 – 0.507 for insulin, with only two models generating Q2boot > 0.4. The poor correlations indicated that the probability of eqs 1 and 2 occurring by chance was low. When the randomized response data were correlated with different subsets of four descriptors (out of the original set of 84 descriptors identified through PLR screening), observed Q2boot values for Aβ40 and insulin ranged from 0 – 0.470 and 0 – 0.391, respectively, with only one model generating Q2boot > 0.4. These poor correlations indicate that the chance of eqs 1 and 2 occurring through biased selection of descriptors (x variables) was low.
Fig. 2.

Correlation plots for MLR models of ThT displacement from Aβ40 and insulinaggregates. Each point represents observed vs. predicted log AC50 values for training and test sets of 41 and six compounds, respectively, whereas the lines represent linear regression of the data points (solid lines, training set; dashed lines, test set). The quality of regressions is indicated by R2 values.
The predictive capability of the MLR models was validated using an external test set (i.e., six compounds not used in the calibration) and the statistical criteria proposed by Golbraikh and Tropsha.30 The resulting correlations show that the models met target slope and goodness of fit criteria for predictive utility (Table 5; Fig. 2). Together, the internal and external validation experiments indicated that an acceptable characterization of compound bioactivity against both targets over the low nanomolar-low micromolar concentration range was achieved.
Table 5.
MLR external validation
| R 2 | R 0 2 | R'02 | (R2-R02)/R2 | (R2-R'02)/R2 | |R02-R'02| | k | k' | |
|---|---|---|---|---|---|---|---|---|
| Aβ40: | 0.79 | 0.79 | 0.74 | 0.000 | 0.06 | 0.05 | 1.02 | 0.96 |
| Insulin: | 0.74 | 0.73 | 0.61 | 0.004 | 0.17 | 0.12 | 0.88 | 1.07 |
|
|
|
|||||||
| Target:a | >0.6 | — | — | either <0.1 | <0.3 | 0.85 < either < 1.15 | ||
Target values are taken from Golbraikh and Tropsha.30
2.4. Descriptors for relative ThT displacement selectivity
Although eqs 1 and 2 show that the descriptors of displacement activity against insulin and Aβ40 aggregates paralleled each other, selectivity was observed for many library members (Table 1). To test whether selectivity correlated with any of the four descriptors quantified by MLR QSAR, the magnitude of their coefficients in the Aβ40 and insulin MLR models was compared directly with each other. First, the t-statistic for each descriptor coefficient (defined as the ratio of the coefficient to its standard error) was calculated. All values were ≥ 2.7, corresponding to rejection of the null hypothesis at p ≤ 0.01, and confirming that the coefficients were determined with precision. Second, coefficient magnitudes from the Aβ and insulin models were directly compared by z-test (Fig. 3). Results showed that compound hydrophobicity and polarizability were the major drivers of displacement selectivity in these datasets. As the clogP coefficient increased, pAC50 increased for both molecular targets, but ~1.4-fold more strongly for insulin than for Aβ40. The differences were significant at p < 0.05. These data indicate that insulin aggregates were more sensitive to compound hydrophobicity than were Aβ40 aggregates. Similarly, as α increased, pAC50 decreased for both molecular targets, but ~1.6-fold more strongly for Aβ40 than for insulin. The difference only trended toward statistical significance (p = 0.064), but suggested that binding to Aβ40 aggregates was incrementally favored relative to insulin aggregates by highly polarizable compounds. In contrast, RBF and μ coefficient magnitudes differed by only ~20%, with poor statistical significance (p > 0.3; Fig. 3), suggesting that these parameters did not contribute to differences in displacement potency between Aβ40 and insulin aggregates. Together these data show that selective binding to insulin and Aβ40 aggregates of up to ~2 log AC50 units is feasible within the benzothiazole series investigated, and that compound hydrophobicity and polarizability are two candidate drivers of this selectivity.
Fig. 3.

Comparison of Aβ and insulin MLR equation coefficients. The bars represent the absolute value of coefficient magnitude ± standard error for Aβ40 and insulin molecular targets, whereas the p value corresponds to z-test of null hypothesis between these two targets.
3. Discussion
This QSAR study indicates that Aβ and insulin aggregates yield populations of binding sites that are dominated by differing modes of interaction. It further suggests strategies for maximizing the affinity and selectivity of ligands for cross-β sheet aggregates of defined composition. In the context of the benzothiazole series investigated here, affinity for Aβ relative to insulin aggregates was modulated by compound hydrophobicity and polarizability. For example, starting compounds 1A – 3A displaced ThT from Aβ only weakly. Like other members of Series A and B, these compounds shared a donor-π-acceptor architecture, where a dimethylamine electron donor was connected to the benzothiazole electron acceptor through a π-electron rich bridge containing a vinyl linker (Fig. 4). The push-pull character of this architecture leads to the delocalization of π-electrons that drives compound polarizability.31 Displacement potency for Aβ was increased by combining donor and acceptor groups so as to maximize polarizability while modulating the strength and orientation of the dipole moment.18 The inverse correlation between dipole moment magnitude and displacement potency suggests that affinity is driven by an ability to form induced dipoles in conjunction with binding surfaces rather than by the existence of a ground-state permanent dipole. However, the results also may reflect oversimplification of the dipole descriptor, which captured dipole moments as scalar magnitudes instead of vectors with magnitude and directionality. Induced dipoles, which are directly correlated to polarizability, were not represented at all. These considerations may rationalize why polarizability but not dipole magnitude correlated with displacement potency.
Fig. 4.

Structural features influencing ThT displacement activity. The donor-Π-acceptor organization generates a delocalized electron distribution and a permanent ground state dipole oriented parallel to the long molecular axis.
The most efficacious affinity-driving modification was to quarternize N3 in the benzothiazole heterocycle so as to create a stronger electron acceptor. Although many different substituents on N3 served this function in Series A, a simple methyl substituent was adequate to drive affinity (5A – 11A). In fact, large hydrophobic N-substituents tended to slightly weaken potency (perhaps through steric effects), leading to the inverse correlation of clogP with affinity in this series. However, higher potency could be fostered without introducing a quaternary nitrogen by replacing the vinyl linker with an azo linker (12A – 14A). On the basis of ab initio calculations, the azo linker has been reported to increase compound polarizability by acting as an auxiliary electron acceptor to the benzothiazole ring.32 Alternatively, displacement affinity could be raised by increasing the surface area of the π-bridge (48B and 49B). Both of these π-bridge modifications promote polarizability in the context of neutral molecules. Overall, to generate electronic properties that favor Aβ relative to insulin aggregate ThT displacement potency, a neutral Series A or B compound should contain a strong electron donor flanking a π-bridge that maximizes push-pull electronic structure while retaining compound planarity. The nonspecific cross-β sheet binding agent [1-(6-{[2-fluoroethyl](methyl)aminaphthalen-2-yl)ethylidene]propanedinitrile (FDDNP) shares a similar structural organization,28 suggesting these affinity driving concepts can be extended to other scaffolds besides benzothiazoles.
Because Series A and B potency was quantified in displacement format, our QSAR approach interrogated only those sites occupied by ThT probe. On the basis of molecular dynamics simulations, both ThT and its neutral analog Pittsburgh Compound B (PIB) bind up to six distinct sites on Aβ protofilaments.33, 34 Total binding energy decomposition analysis identified van der Waals forces and non-electrostatic solvation energy (i.e., the hydrophobic effect) as the dominant descriptors of binding energy at these sites. In contrast, electrostatic interactions were found to antagonize binding. The two sites predicted to yield the highest binding energy for ThT and PIB are reproduced in Fig. 5. In one calculated mode (Site A), the ligands preferentially bound shallow, hydrophobic clefts formed by the side chains of aromatic residues, resulting in favorable van der Waals interactions between their benzothiazole and benzaminic ring systems and the planar surface created by in-register aromatic sidechains of Phe20 (Fig. 5A). Interestingly, a neighboring negatively charged residue (Glu22) did not interact with the ThT tertiary amine despite it being accessible in this binding mode. In the second hypothetical binding mode (Site B, Fig. 5B), ThT and PIB ligands entered extra wide hydrophobic channels formed by Gly residues exposed on the aggregate surface. Deep insertion of ligand into these channels would allow direct interaction with the hydrogen-bonded β-sheet core through dispersion and induced-dipole effects.11, 35, 36 QSAR analysis predicts that highly polarizable Series A and B compounds should be especially well suited for competing with this mode of ThT interaction. Consistent with this hypothesis, PIB binding energy was predicted to be strongest at this site.34 In addition, this binding mode is consistent with the computational modeling of Rodriguez-Rodriguez et al., where a quantum-refined docked pose of ThT was predicted to preferentially occupy the wide channels formed by Gly residues of the Aβ42 protofibril.36 These modeling studies highlight the importance of planar aromatic moieties of ligands for ThT-like binding interactions, as well as the need for adequate rotatability of neighboring groups so that surface contact at the binding sites is maximized. They also highlight the heterogeneity of binding sites that results from varying side chain composition despite commonality in main chain secondary structure.
Fig. 5.

Reported binding modes for Pittsburgh Compound B (PIB, a neutral benzothiazole derivative) on synthetic Aβ40 protofibrils53 as deduced by molecular dynamics simulation.33 Aβ40 atoms are colored grey (carbon), blue (nitrogen), and red (oxygen), whereas PIB atoms are colored orange (carbon), blue (nitrogen), and yellow (sulfur), and overlaid with a transparent molecular surface area. Black arrows mark the points of contact between ligand and protein. (A) Site A consists of a shallow channel flanked by Phe20 and Val18 side chains whereas (B) Site B consists of a wide channel created by Gly33 flanked by Ile31 and Met35. Site B supports deeper insertion of ligand so that it can interact with the hydrogen-bond network of the cross-β sheet backbone through dispersion and induced-dipole effects. These models show how side chain composition can influence depth and width of channels dispersed along the surface of cross-β sheet aggregates. Images were created using UCSF Chimera Alpha Version 1.5 (build 31329) software.
Overall, the proposed interaction of Series A and B compounds with cross-β sheet aggregates is reminiscent of the interaction between cellulose-based textiles and acidic dyes, both of which present flat surfaces that support adsorption. Interaction is reportedly mediated by van der Waals interactions, with the enthalpic portion of binding energy reflecting the flatness of the dyes and how close their planes can contact the cellulosic surface.37 Both Series A and B ligands that displace ThT from Aβ aggregates with submicromolar affinity resemble acid dyes in being highly polarizable and flat, and by having their binding affinity influenced by compound surface area. Although these structural features also support compound self association,38, 39 benzothiazoles were assayed at concentrations where interference with probe displacement was minimal.40
Radiotracer utility depends on binding site density (Bmax) as well as on binding affinity.41 Large differences in Bmax have been reported for Aβ-aggregate binding ligands, although the structural basis for these observations is not clear.42 In the context of tau cross-β sheet structure, we identified polarizability as a potential descriptor for Bmax as well as for Kd.11 It is conceivable that differences between active and inactive Series A compounds reflect the contribution of polarizability to Bmax in addition to Kd.
In summary, this QSAR study reveals that aggregates composed of Aβ and insulin present binding sites that interact differentially with small molecules, and that binding selectivity at the level of affinity can be tuned by leveraging the molecular properties indentified by the MLR model, including compound polarizability and hydrophobicity. These concepts are likely to be applicable to a range of scaffolds not limited to benzothiazoles.
4. Experimental Procedures
4.1. Bioactivity data
AC50 data for displacement of ThT probe from aggregates composed of Aβ (4.6 μM protomer) and insulin (1.4 μM protomer) were taken from the literature.12 Test compound concentrations ranged from 0.001 – 30 μM. The assays were performed at the apparent probe Kd for each protein substrate to facilitate direct comparison (0.5 and 20 μM for insulin and Aβ, respectively). Within this in vitro format, it was assumed that displacement efficacy was complete for all compounds, and that total compound concentration approximated free concentration at equilibrium.
4.2 Chemical structures and calculation of molecular descriptors
Compound structures (Table 1) were built (Chem3D Pro 12 software) and minimized (Allinger's molecular mechanics MM2 force field43) using default convergence criteria of 0.100 for the minimum RMS gradient and 10,000 iterations. Molecular descriptors and properties were then generated using various semi-empirical and ab initio methods. First, semi-empirical descriptors were generated with E-DRAGON 1.0, an online implementation of the DRAGON 5.4 molecular descriptor generator44 that computes >1,600 descriptors categorized into 20 logical blocks.27
Second, because of the variable accuracy of molecular lipophylicity predictions among various semi-empirical methods (owing to inadequate training sets and method parameterization22), the E-DRAGON descriptor set was augmented with clogP and topological polar surface area estimations calculated using the highly parameterized and robustly trained fragment-based algorithm of the Molinspiration Property Calculation Service (www.molinspiration.com).
Finally, compound dipole moment and polarizability were calculated at the quantum level using density functional theory methods implemented in Gaussian 09 (G09)45 software package available on Ohio Supercomputing Center clusters. Each compound structure was evaluated using the three-step approach of Perpete, et al.46, 47 consisting of: i) a ground-state geometry optimization with 3×10⁻⁴ a.u. residual mean square convergence criteria (default OPT threshold); ii) confirmation of ground-state geometry with vibrational spectrum determination (structure minima verified by real vibrational frequencies); iii) calculation of α in a static (ω = 0) external electric field (default 1 a.u. in principal axes), at the optimized ground-state geometry. All calculations were performed using hybrid density functional B3LYP and the 6–311++G(d,p) basis set. Bulk solvent effects were implicitly modeled with the polarizable continuum model (G09 keywords SCRF=(Solvent=Methanol)).48 Polarizabilities are reported as the mean, <α>, or the average of the three polarizability tensor quantities that correspond to x, y, and z components of parallel external field principal axes:26
| (3) |
given in units of polarizability volume (Å3). All calculated descriptors were merged prior to model generation.
4.3. Model generation
Genetic algorithm-PLR analysis was performed using the Virtual Computational Chemistry Laboratory (VCCL), an online portal for computational chemistry tools available at www.vcclab.org (last accessed 1 November 2011).49 Calibration analyses (i.e., training set models) for Aβ and insulin molecular targets were performed using default parameters (minimum residual variance of factors = 0.0010; number of latent t-variables ≤ 12). Descriptors were identified as redundant (i.e., constant or flat) and deleted if ≥90% of the subject compounds shared identical values, yielding 84 descriptors for the final genetic algorithm fitting. PLR models were optimized on the basis of leave-one-out cross validation (Q2loo) as implemented in the VCCL.
MLR was performed using the open source statistical software R version 2.13.0, available at www.r-project.org (last accessed 1 November 2011).50 Training set fits were generated using the linear model lm function, and cross validated using the crossval function in the bootstrap package. The descriptor correlation matrix was generated using the cor function in the bootstrap package.
4.4. Model validation
Internal validation of MLR models was performed in R version 2.13.0.50 Correlations were cross validated using bootstrap resampling51 as implemented in the crossval function of the R bootstrap package, whereas variance inflation factors were calculated using the vif function. Y-randomization52 was performed in R in two steps. First, new MLR models were developed by randomly shuffling (250 shuffles) the 41 dependent variables (i.e., AC50 values for the training set) while keeping the independent variables (i.e., α, μ, clogP, and RBF descriptor values) constant. Dependent variables were shuffled using the sample function, whereas refitting to independent variables was performed using the lm function. In the second step, which assessed potential bias in selection of independent variable sets, randomly shuffled dependent variables were correlated with stepwise selected subsets of four out of the original 84 descriptors identified through PLR screening. This was performed using a custom-written R script that incorporated the sample function to shuffle dependent variables and the regsubsets function (exhaustive search algorithm) in the leaps package to fit each set of independent variables to the shuffled dependent variables. Both steps of y-randomization were run for 250 iterations, with the original dependent variables being independently shuffled with each iteration. The linear model resulting from each shuffle was cross validated (Q2boot) using the crossval function.
External validation was performed as described previously, where R02, R'02, k, and k' correspond to the correlation coefficients and slopes of linear regressions constrained through the origin.30
4.5. Statistical methods
Differences between regression MLR coefficients were assessed by z-test:
| (4) |
where x1 ± Sx1 and x2 ± Sx2 are the pair of estimates ± standard error being compared, and z is the 1-α point of the standard normal distribution.
Acknowledgments
We thank Drs. Christopher Hadad and Paul Hurtado for helpful discussions of theory and practical considerations for G09 and R, respectively, and the Shea, Tycko, Buehler and Sodupe research groups for providing coordinate files for amyloid structures. This work was supported by a grant from the Alzheimer's Drug Discovery Foundation (281205) and an allocation of computing time from the Ohio Supercomputer Center (PAS0453).
Abbreviations
- AC50
half-maximal activity concentration
- AD
Alzheimer's disease
- MLR
multiple least squares regression
- PLR
partial least squares regression
- QSAR
quantitative structure activity relationship
- ThT
Thioflavin T
Footnotes
Publisher's Disclaimer: This is a PDF file of an unedited manuscript that has been accepted for publication. As a service to our customers we are providing this early version of the manuscript. The manuscript will undergo copyediting, typesetting, and review of the resulting proof before it is published in its final citable form. Please note that during the production process errors may be discovered which could affect the content, and all legal disclaimers that apply to the journal pertain.
References
- 1.Nordberg A, Rinne JO, Kadir A, Langstrom B. Nat. Rev. Neurol. 2010;6:78. doi: 10.1038/nrneurol.2009.217. [DOI] [PubMed] [Google Scholar]
- 2.Sawaya MR, Sambashivan S, Nelson R, Ivanova MI, Sievers SA, Apostol MI, Thompson MJ, Balbirnie M, Wiltzius JJ, McFarlane HT, Madsen AO, Riekel C, Eisenberg D. Nature. 2007;447:453. doi: 10.1038/nature05695. [DOI] [PubMed] [Google Scholar]
- 3.Groenning M. J. Chem. Biol. 2010;3:1. doi: 10.1007/s12154-009-0027-5. [DOI] [PMC free article] [PubMed] [Google Scholar]
- 4.Krebs MR, Bromley EH, Donald AM. J. Struct. Biol. 2005;149:30. doi: 10.1016/j.jsb.2004.08.002. [DOI] [PubMed] [Google Scholar]
- 5.Fodero-Tavoletti MT, Okamura N, Furumoto S, Mulligan RS, Connor AR, McLean CA, Cao D, Rigopoulos A, Cartwright GA, O'Keefe G, Gong S, Adlard PA, Barnham KJ, Rowe CC, Masters CL, Kudo Y, Cappai R, Yanai K, Villemagne VL. Brain. 2011;134:1089. doi: 10.1093/brain/awr038. [DOI] [PubMed] [Google Scholar]
- 6.Honson NS, Johnson RL, Huang W, Inglese J, Austin CP, Kuret J. Neurobiol. Dis. 2007;363:229. doi: 10.1016/j.nbd.2007.07.018. [DOI] [PMC free article] [PubMed] [Google Scholar]
- 7.Chen XJ. J. Mol. Struct. THEOCHEM. 2006;763:83. [Google Scholar]
- 8.Kim MK, Choo IH, Lee HS, Woo JI, Chong Y. Bull. Kor. Chem. Soc. 2007;28:1231. [Google Scholar]
- 9.Leuma Yona R, Mazeres S, Faller P, Gras E. ChemMedChem. 2008;3:63. doi: 10.1002/cmdc.200700188. [DOI] [PubMed] [Google Scholar]
- 10.Wang WS, Zhang JM, Lin BL. J. Radioanal. Nucl. Chem. 2005;266:107. [Google Scholar]
- 11.Jensen JR, Cisek K, Honson NS, Kuret J. Bioorg. Med. Chem. 2011;19:5147. doi: 10.1016/j.bmc.2011.07.016. [DOI] [PubMed] [Google Scholar]
- 12.Caprathe BW, Gilmore JL, Hays SJ, Jaen JC, LeVine H. U.S. Patent 6,001,331. 1999
- 13.Cai L, Innis RB, Pike VW. Curr. Med. Chem. 2007;14:19. doi: 10.2174/092986707779313471. [DOI] [PubMed] [Google Scholar]
- 14.Kemp S, Storey L, Storey J, Rickard J, Harrington C, Wischik C. Int. Patent WO 2010/034982 A1. 2010
- 15.Benkova Z, Cernusak I, Zahradnik P. Struct. Chem. 2006;17:287. [Google Scholar]
- 16.Hrobarik P, Horvath B, Sigmundova I, Zahradnik P, Malkina OL. Magn. Reson. Chem. 2007;45:942. doi: 10.1002/mrc.2074. [DOI] [PubMed] [Google Scholar]
- 17.Hrobarik P, Sigmundova I, Zahradnik P, Kasak P, Arion V, Franz E, Clays K. J. Phys. Chem. C. 2010;114:22289. [Google Scholar]
- 18.Liu Y, Liu Y, Kong X, Xia M, Liu C. Teor. Eksp. Khim. 2000;36:333. [Google Scholar]
- 19.Sigmundova I, Zahradnik P, Loos D. Collect. Czech. Chem. C. 2007;72:1069. [Google Scholar]
- 20.Kurunczi L, Funar-Timofei S, Bora A, Seclanian E. Int. J. Quantum Chem. 2007;107:2057. [Google Scholar]
- 21.Metivier-Pignon H, Faur C, Le Cloirec P. Chemosphere. 2007;66:887. doi: 10.1016/j.chemosphere.2006.06.032. [DOI] [PubMed] [Google Scholar]
- 22.Mannhold M, Poda GI, Ostermann C, Tetko IV. Chem. Cent. J. 2009;3 [Google Scholar]
- 23.Konovalov DA, Llewellyn LE, Vander Heyden Y, Coomans D. J. Chem. Inf. Model. 2008;48:2081. doi: 10.1021/ci800209k. [DOI] [PubMed] [Google Scholar]
- 24.Kier LB, Hall LH. Molecular connectivity in structure-activity analysis. Research Studies Press, Wiley; Letchworth, Hertfordshire, England: 1986. [Google Scholar]
- 25.Hall LH, Kier LB. J. Mol. Graph. Model. 2001;20:4. doi: 10.1016/s1093-3263(01)00097-3. [DOI] [PubMed] [Google Scholar]
- 26.Marder SR, Sohn JE, Stucky GD. Materials for nonlinear optics: chemical perspectives. American Chemical Society; Washington, DC: 1991. [Google Scholar]
- 27.Consonni V, Todeschini R. Handbook of molecular descriptors. Wiley-VCH; New York: 2000. [Google Scholar]
- 28.Barrio JR, Satyamurthy N, Huang SC, Petric A, Small GW, Kepe V. Acc. Chem. Res. 2009;42:842. doi: 10.1021/ar800189x. [DOI] [PubMed] [Google Scholar]
- 29.Topliss JG, Costello RJ. J. Med. Chem. 1972;15:1066. doi: 10.1021/jm00280a017. [DOI] [PubMed] [Google Scholar]
- 30.Golbraikh A, Tropsha A. J. Mol .Graph. Model. 2002;20:269. doi: 10.1016/s1093-3263(01)00123-1. [DOI] [PubMed] [Google Scholar]
- 31.Albert IDL, Marks TJ, Ratner MA. J. Am. Chem. Soc. 1997;119:6575. [Google Scholar]
- 32.Shuto Y. Int. J. Quantum Chem. 1996;58:407. [Google Scholar]
- 33.Wu C, Bowers MT, Shea JE. Biophys. J. 2011;100:1316. doi: 10.1016/j.bpj.2011.01.058. [DOI] [PMC free article] [PubMed] [Google Scholar]
- 34.Wu C, Wang Z, Lei H, Duan Y, Bowers MT, Shea JE. J. Mol. Biol. 2008;384:718. doi: 10.1016/j.jmb.2008.09.062. [DOI] [PMC free article] [PubMed] [Google Scholar]
- 35.Jensen JR, Cisek K, Funk KE, Naphade S, Schafer K, Kuret J. J. Alzheimers Dis. 2011;26(S3):147. doi: 10.3233/JAD-2011-0003. [DOI] [PubMed] [Google Scholar]
- 36.Rodriguez-Rodriguez C, Rimola A, Rodriguez-Santiago L, Ugliengo P, Alvarez-Larena A, Gutierrez-de-Teran H, Sodupe M, Gonzalez-Duarte P. Chem. Commun. 2010;46:1156. doi: 10.1039/b912396b. [DOI] [PubMed] [Google Scholar]
- 37.Bird J, Brough N, Dixon S, Batchelor SN. J. Phys. Chem. B. 2006;110:19557. doi: 10.1021/jp063730n. [DOI] [PubMed] [Google Scholar]
- 38.Murakami K. Dyes Pigm. 2002;53:31. [Google Scholar]
- 39.Necula M, Chirita CN, Kuret J. Biochemistry. 2005;44:10227. doi: 10.1021/bi050387o. [DOI] [PubMed] [Google Scholar]
- 40.Honson NS, Jensen JR, Abraha A, Hall GF, Kuret J. Neurotox. Res. 2009;15:274. doi: 10.1007/s12640-009-9028-y. [DOI] [PMC free article] [PubMed] [Google Scholar]
- 41.Laruelle M, Slifstein M, Huang Y. Mol. Imaging Biol. 2003;5:363. doi: 10.1016/j.mibio.2003.09.009. [DOI] [PubMed] [Google Scholar]
- 42.Lockhart A, Ye L, Judd DB, Merritt AT, Lowe PN, Morgenstern JL, Hong G, Gee AD, Brown J. J. Biol. Chem. 2005;280:7677. doi: 10.1074/jbc.M412056200. [DOI] [PubMed] [Google Scholar]
- 43.Allinger NL. J. Am. Chem. Soc. 1977;99:8127. [Google Scholar]
- 44.Mauri A, Consonni V, Pavan M, Todeschini R. Commun. Math. Comp. Chem. 2006;56:237. [Google Scholar]
- 45.Frisch MJ, Trucks GW, Schlegel HB, Scuseria GE, Robb MA, Cheeseman JR, Scalmani G, Barone V, Mennucci B, Petersson GA, Nakatsuji H. Gaussian, Inc. 2009 [Google Scholar]
- 46.Jacquemin D, Perpete EA. Chem. Phys. Lett. 2006;429:147. [Google Scholar]
- 47.Perpete EA, Jacquemin D. J. Mol. Struct. THEOCHEM. 2009;914:100. [Google Scholar]
- 48.Tomasi J, Mennucci B, Cammi R. Chem. Rev. 2005;105:2999. doi: 10.1021/cr9904009. [DOI] [PubMed] [Google Scholar]
- 49.Tetko IV, Gasteiger J, Todeschini R, Mauri A, Livingstone D, Ertl P, Palyulin V, Radchenko E, Zefirov NS, Makarenko AS, Tanchuk VY, Prokopenko VV. J. Comput. Aid. Mol. Des. 2005;19:453. doi: 10.1007/s10822-005-8694-y. [DOI] [PubMed] [Google Scholar]
- 50.R Development Core Team . R: A language and environment for statistical computing. R Foundation for Statistical Computing; Vienna: 2011. [Google Scholar]
- 51.Wehrens R, Putter H, Buydens LMC. Chemom. Intell. Lab. Syst. 2000;54:35. [Google Scholar]
- 52.Rucker C, Rucker G, Meringer M. J. Chem. Inf. Model. 2007;47:2345. doi: 10.1021/ci700157b. [DOI] [PubMed] [Google Scholar]
- 53.Petkova AT, Yau WM, Tycko R. Biochemistry. 2006;45:498. doi: 10.1021/bi051952q. [DOI] [PMC free article] [PubMed] [Google Scholar]