

Abstract
Human carcinomas are defined by recurrent chromosomal aneuploidies, which result in tissue-specific distribution of genomic imbalances. In order to develop models for these genome mutations and determine their role in tumorigenesis, we generated 45 spontaneously transformed murine cell lines from normal epithelial cells derived from bladder, cervix, colon, kidney, lung, and mammary gland. Phenotypic changes, chromosomal aberrations, centrosome number, and telomerase activity were assayed in control uncultured cells and in three subsequent stages of transformation. Supernumerary centrosomes, bi-nucleate cells, and tetraploidy were observed as early as 48 hr after explantation. In addition, telomerase activity increased throughout progression. Live-cell imaging revealed that failure of cytokinesis, not cell fusion, promoted genome duplication. Spectral karyotyping demonstrated that aneuploidy preceded immortalization, consisting predominantly of whole chromosome losses (4, 9, 12, 13, 16, and Y) and gains (1, 10, 15, and 19). After transformation, focal amplifications of the oncogenes Myc and Mdm2 were frequently detected. Fifty percent of the transformed lines resulted in tumors upon injection into immuno-compromised mice. The phenotypic and genomic alterations observed in spontaneously transformed murine epithelial cells recapitulated the aberration pattern observed during human carcinogenesis. The dominant aberration of these cell lines was the presence of specific chromosomal aneuploidies. We propose that our newly derived cancer models will be useful tools to dissect the sequential steps of genome mutations during malignant transformation, and also to identify cancer-specific genes, signaling pathways, and the role of chromosomal instability in this process.
INTRODUCTION
Human invasive carcinomas develop slowly, sometimes over decades, through stages of increasing cellular dysplasia. This process requires the acquisition of disease-specific chromosomal imbalances, which are early and recurrent events, and the gain and loss of function of oncogenes and tumor suppressor genes, respectively (Ried et al., 1999; Albertson et al., 2003). Aberrant promotor methylation patterns, increased telomerase activity, and abnormalities of the centrosomes accompany the process of malignant transformation (Kalari and Pfeifer, 2010; Artandi et al., 2000; D’Assoro et al., 2002; Godinho et al., 2009).
Chromosomal aneuploidy and its consequence on the genome, i.e., the acquisition of specific genomic imbalances, are defining feature of human carcinomas (Heim and Mitelman, 2009; Ried, 2009; Hanahan and Weinberg, 2011; Kolodner et al., 2011). Their conservation and the degree of recurrence are remarkable. For example, the gain of chromosome arm 3q is the most common abnormality in cervical cancers, and in fact it is a conditio sine qua non for progression of dysplasia, which advances to premalignant cervical lesions and eventually to invasive disease (Heselmeyer et al., 1996; Heselmeyer-Haddad et al., 2005). In colorectal tumorigenesis, the gain of chromosome 7 is one of the earliest genome alterations observed in adenomas. This is complemented by gains of chromosome arms 8q, 13q, and 20q, and losses of 17p and 18q in invasive carcinomas (Vogelstein et al., 1988; Bardi et al., 1991; Ried et al., 1996; Postma et al., 2007; Heim and Mitelman, 2009). Human breast cancers are characterized by frequent gains of chromosome arms 1q, 8q, 16p, 17q, and 20q, and losses of 8p and 16q (Ried et al., 1995; Friedrich et al., 2009; Heim and Mitelman, 2009; Smid et al., 2011). The comprehensive evaluation of large datasets of high-resolution array comparative genomic hybridization (arrayCGH) from histologically distinct human tumors confirms these observations by solely using the distribution pattern of chromosomal gains and losses, it is possible to reproduce the classification of tumors according to their tissue of origin (Beroukhim et al., 2010).
Mouse models of cancer have become valuable tools to dissect the molecular events driving tumorigenesis. With respect to hematological malignancies, such as leukemias or lymphomas, the genetic aberration profiles resemble those observed in human diseases. Mutations of ATM in humans results in ataxia telangiectasia and in mice, the homozygous deletion of this gene results in thymic lymphomas after a relatively short latency (Barlow et el., 1996). The T-cell tumors contain translocations of chromosome 14, which contains the genes for the T-cell receptor chains α and δ; these translocations result in abnormal rearrangements of these loci, and such rearrangements are also present in human lymphomagenesis (Liyanage et al., 2000; Petiniot et al., 2002). Multiple transgenic mouse models have provided valuable information regarding the regulation of genes associated with leukemias and lymphomas (Janz, 2006; Li et al., 2009).
With respect to models of epithelial cancers, the situation is more complex. In a study of chemically induced murine colorectal tumors, we failed to detect genomic imbalances (Guda et al., 2004). In conrast, mouse mammary gland tumors exhibit multiple recurrent genomic imbalances, including frequent loss of the distal bands of chromosome 4 that is homologous to human chromosome arm 1p. Additionally, these tumors have chromosomal gains that map to chromosome 15, containing the Myc oncogene (Ried et al., 2004). However, when compared with human breast cancer we generally observed considerably fewer copy number changes in mammary gland carcinomas that occur in transgenic mouse models. This difference may be attributable to the mode of tumor induction, which in many instances requires strong tissue-specific expression of oncogenes. Such a powerful and dominant oncogenic stimulus, which is never observed in human premalignant conditions, may make the requirement for the acquisition of the recurrent aneuploidies that govern the genomic aberration profiles during the genesis of human epithelial cancers, superfluous. Since the sequential acquisition of these chromosomal imbalances is so central to the onset of human carcinogenesis, we set out to develop models that can be useful for identifying molecular mechanisms that lead to aneuploidy.
Typically, normal human cells that are grown in vitro cease to divide after 30–50 population doublings, then senesce and apoptose. This phenomenon is referred to as the “Hayflick Limit” (Hayflick and Moorhead, 1961). To circumvent this process numerous investigators used carcinogenic compounds to transform mammalian cells (Earle, 1943; Gey et al., 1949; Lee et al., 1989; Li et al., 1997). Additionally, it has been shown that mouse embryonic fibroblasts after multiple rounds of serial passaging, undergo cellular transformation, subsequently these cells subsequently developed into an immortal cell line they referred to as NIH 3T3 (Todaro and Green, 1963). The ability of cells to become immortal after prolonged in vitro culturing is referred to as “spontaneous transformation” (Sanford, 1967; Briand, 1970; Ponten, 1971; Sanford and Evans, 1982; Miller and Miller, 1983). In the majority of these models, the tissue of origin is mesenchymal in nature. We therefore developed an in vitro model to study sequential genetic and genomic alterations in epithelial cells, the cell lineage from which human carcinomas are derived. This study was initiated by culturing murine epithelial cells extracted from six organs: bladder, cervix, colon, kidney, lung, and mammary glands. We identified three major stages during the spontaneous transformation process and refer to them as pre-immortal, immortal, and transformed. Using various analytical approaches our goals were as follows: (1) determine whether the acquisition of chromosomal aneuploidies is required for spontaneous transformation; (2) determine the timing of this event; (3) identify if any tissue-specific differences occur during progression; and (4) explore to what extent which features are associated with human tumorigenesis, such as centrosome abnormalities and telomerase activation, are required for spontaneous transformation of murine epithelial cells.
MATERIALS AND METHODS
Mouse Genotypes
Wild type C57BL/6, five to six weeks of age (NIH-Frederick animal facility, Frederick, MD), and six-week-old nude mice (Athymic NCR-nu/nu 01B74; Frederick, MD) were used for the spontaneous transformation experiments and tumorigenic mouse assay, respectively. The following transgenic mice were used for the live cell imaging experiments: histone 2B–GFP wild type mice (kindly provided by V. Papaioannou, Columbia University, NY), and Trp53−/− mutants, derived as F1 progeny from heterozygous parents (NIH Mouse repository Trp53 null [B6.129S2-Trp53tm1Tyj] Strain number 01BM4). All animals were sacrificed using CO2 prior to dissection, following the protocols outlined in NIH Animal Protocol Study No. NCI-ASP-MB-045.
Tissue Culture
Bladder, cervix, colon, lung, kidney, and mammary gland organs were excised and mechanically minced using sterile scalpels. Further disassociation of cells was performed for 1 hr using 0.25% collagenase type I (Invitrogen, Carlsbad, CA), for colon and lungs type III (Invitrogen) for mammary glands, and type IV (Invitrogen) for bladder, cervix, and kidneys. Normal murine bladder, cervix, colon, kidney, lung, and mammary gland epithelial cells were selectively isolated by sedimentation (Adessi et al., 1996). The epithelial cells were grown in DMEM/F12 media without phenol-red indicator (Invitrogen), at 5% CO2 at 37°C. All primary cultures were initiated using media supplemented with low serum (2–5% fetal bovine serum) (Invitrogen), EGF (0.01 µg/ml, Invitrogen), 100x Antibiotic-Antimycotic (10,000 U/ml Penicillin G Sodium, 10,000 µg/ml Streptomycin sulfate, 25 µg/ml amphotoericin B, Invitrogen), and fungizone (0.25 µg/ml, Invitrogen). The cervix, colon, and mammary primary cells additionally required insulin (10 µg/ml, Invitrogen), hydrocortisone (0.5 µg/ml, Sigma-Aldrich, St. Louis, MO), and bovine pituitary extract (0.05 mg/ml, Invitrogen). Media without phenol-red was used, as this ingredient has been shown to have significant estrogen-like activity that increases cellular proliferation, particularly in mammary and cervical cells (Berthois et al., 1986). It has been previously reported that re-feeding primary rodent cells every 10 days rather than every three days promotes the in vitro cellular transformation process (Kodama et al., 2001). This method was therefore applied to all of the primary epithelial cultures.
Cell Lines
The spontaneously transformed cell lines created and assayed in this study are listed in Table 1. Karyotypes of the above mentioned cell lines are provided in the SKY/M-FISH & CGH database (Knutsen et al., 2005): http://www.ncbi.nlm.nih.gov/projects/sky/ (NCI45 Mouse Cell Line Panel-HPN). The mammary cell line Comma-D (Danielson et al., 1984) was kindly provided by Dr. Daniel Medina (Baylor College of Medicine, Houston, TX).
TABLE 1.
Spontaneously Transformed Murine Epithelial Cell Lines Analyzed by SKY
| Organ | |||||||
|---|---|---|---|---|---|---|---|
| Animal ID | Sample Name | Bladder | Cervix | Colon | Kidney | Lung | Mammary Gland |
| F1A | NCI-HPN-F1A Mam | X | |||||
| F3A | NCI-HPN-F3A Lung | X | |||||
| F5A | NCI-HPN-F5A Cervix | X | |||||
| M1A | NCI-HPN-M1A Lung | X | |||||
| M4A | NCI-HPN-M4A Lung | X | |||||
| F1B | NCI-HPN-F1B Kid | X | |||||
| F2B | NCI-HPN-F2B Lung | X | |||||
| M1C | NCI-HPN-M1C Blad | X | |||||
| NCI-HPN-M1C Colon | X | ||||||
| NCI-HPN-M1C Kid | X | ||||||
| NCI-HPN-M1C Lung | X | ||||||
| M2C | NCI-HPN-M2C Blad | X | |||||
| NCI-HPN-M2C Colon | X | ||||||
| NCI-HPN-M2C Kid | X | ||||||
| NCI-HPN-M2C Lung | X | ||||||
| F1D | NCI-HPN-F1D Kid | X | |||||
| F1G | NCI-HPN-F1G Blad | X | |||||
| NCI-HPN-F1G Kid | X | ||||||
| NCI-HPN-F1G Mam | X | ||||||
| F2G | NCI-HPN-F2G Blad | X | |||||
| NCI-HPN-F2G Kid | X | ||||||
| NCI-HPN-F2G Lung | X | ||||||
| M1G | NCI-HPN-M1G Kid | X | |||||
| NCI-HPN-M1G Lung | X | ||||||
| M2G | NCI-HPN-M2G Kidney | X | |||||
| NC-HPN-M2G Lung | X | ||||||
| F1I | NCI-HPN-F1I Cervix | X | |||||
| NCI-HPN-F1I Mam | X | ||||||
| F2I | NCI-HPN-F2I–Cervix | X | |||||
| M1I | NCI-HPN-M1I Blad | X | |||||
| F1K | NCI-HPN-F1K Colon | X | |||||
| F2K | NCI-HPN-F2K Colon | X | |||||
| F3K | NCI-HPN-F3K Colon | X | |||||
| F4K | NCI-HPN-F4K Colon | X | |||||
| M1K | NCI-HPN-M1K Colon | X | |||||
| M2K | NCI-HPN-M2K Colon | X | |||||
| F1L | NCI-HPN-F1L Cervix | X | |||||
| F2L | NCI-HPN-F2L Cervix | X | |||||
| F1Q | NCI-HPN-F1Q Kid | X | |||||
| M1N | NCI-HPN-M1N Kid | X | |||||
| M1P | NCI-HPN-M1P Kid | X | |||||
| F23 | NCI-HPN-F23 Mam | X | |||||
| F24 | NCI-HPN-F24 Mam | X | |||||
| F43 | NCI-HPN-F43 Mam | X | |||||
| F44 | NCI-HPN-F44 Mam | X | |||||
SKY
Preparation of mouse SKY probes, slide pre-treatment, slide denaturation, detection, and imaging have been described previously (Liyanage et al., 1996). Metaphase chromosomes were prepared according to standard protocols (Padilla-Nash et al., 2006). Approximately 15 metaphase spreads per sample were analyzed and scored for numerical and structural aberrations following mouse chromosome nomenclature rules established by the Jackson Laboratories (Bar Harbor, ME): http://www.informatics.jax.org/mgihome/nomen/gene.shtml. No specific rules exist for the mouse in distinguishing between unbalanced vs. reciprocal translocations (“T” is currently used for all mouse translocations). Therefore, in this report we refer to reciprocal translocations herein by using “rT”. Ploidy rules for mouse chromosome numbers established by Muriel Davisson (Jackson Laboratories, Maine), Turid Knutsen, and Hesed Padilla-Nash are provided in Supplementary Table 1.
FISH and Immunocytochemistry
BAC clones for gene-specific loci Tert (RP23–412H3, Chr 13), Terc (RP23–404G7, Chr 3), and Myc (D15Mit17, Chr 15) were purchased from Qiagen (Alameda, CA). Labeling of DNA was performed by nick-translation following protocols described in http://www.riedlab.nci.nih.gov/protocols. Telomere DNA repeats were visualized using Telomere PNA-FISH kit/Cy3 (DAKO Demark A/S, Denmark) following the manufacturer’s protocols. Cells were grown in polystyrene single-chamber slides (BD Biosciences, Bedford, MA) for all immunofluorescence assays. Cellular cytoskeleton was visualized with FITC anti-β-actin (Sigma-Adrich, St. Louis, MO). Cytokeratin 8 and FITC pan-cytokeratin (Sigma-Aldrich) were used to verify the identity of epithelial cells. Centrosomes were visualized using monoclonal anti-γ-tubulin (Sigma-Aldrich). All protocols are described in http://www.riedlab.nci.nih.gov/protocols.
All FISH and immuno-fluorescence images were acquired using a Leica 4000 microscope (Leica, Germany) and Q-FISH™ software (Leica).
Time-Lapse Imaging
Normal, Trp53 null, and GFP-H2B lung epithelial cells were isolated as described above. Cells were immediately plated and imaged as previously described (Ravin et al., 2008). The microscope (Axio Observer, Carl Zeiss Microimaging LLC, Thornwood, NY) was equipped with a 40x Phase objective, and the imaging chamber was warmed to 37°C before image acquisition. Images were captured from multiple areas every 2 min for 2 days using a LUDL Mac5000 motorized stage and MetaMorph software (Universal Imaging Corp., Downington, PA) software.
Telomerase Activity (TRAP Assay)
Cell lysates were prepared from freshly explanted normal epithelial cells derived from bladder, cervix, colon, lung, kidney, and mammary glands excised from five- to six- week-old C57BL/6 male and female mice. Telomerase activity was assessed from these control cells and their respective immortal and transformed stages. Negative controls consisted of lysates derived from freshly explanted spleen cells isolated from Tert-deficient mice (Chiang et al., 2004). Telomerase activity was detected with a gel-based TRAPeze detection kit (Intergen, Purchase, NY) following the manufacture’s instruction (Kim et al., 1994). Telomerase activity was expressed as telomerase units (TU)/5000 cells. For normalization, telomerase activity was measured using a lysate prepared from the mouse EL4 cell line, a T-cell tumor line that expresses high levels of telomerase (Hathcock et al., 2003). Three technical replicates were run per sample.
Nude Mouse Tumorigenicity Assay
Prior to performing the nude mouse assay, cell lines were tested (MTBM-M/R, Animal Health Diagnostic Laboratory-NCI Frederick, MD), to rule out the presence of bacteria and/or viruses. Nude mice were anesthetized with 0.25 ml of 1.25% Avertin delivered intraperitonealy. Approximately 1 × 10⁶ cells were injected subcutaneously into the inter-scapular region using a volume of 100 µl in 1x PBS. Animals were monitored twice weekly for a period of 16 weeks. The spontaneously derived and tumorigenic mammary cell line Comma-D served as our positive control. Animals were euthanized when palpable tumors (∼ 1–2 cm3) developed, and tumors were then harvested for further analysis.
RESULTS
Morphology
The spontaneous transformation of epithelial cells was a gradual process for all of the murine cell lines. The experimental design is shown in Figure 1. Based on morphological changes and different growth rates, we defined three sequential stages of transformation: pre-immortal, immortal, and transformed (Fig. 1). Cells were designated as pre-immortal upon initial adhesion of the primary explants, including the time in which cultures maintained contact inhibition. Subsequently, cells became flat and large, and when passaged required weeks to become confluent. Actin fibers were uniformly distributed and organized in a parallel fashion. Cultures were defined as entering the immortal stage when the cells became more spindle-shaped, and the cytoskeleton became disorganized, with long protrusions extending in multiple directions. Proliferation increased, with cultures becoming confluent within one to two days after passaging. Once cells lost their anchorage dependence and exhibited foci they were designated as transformed, as further defined by a smaller cytoplasmic to nuclear ratio. Fluorescence labeling of actin revealed numerous intensely stained foci. Examples of the distinct morphological changes and patterns of actin staining are displayed in Figure 2.
Figure 1. Experimental scheme used for spontaneous transformation of murine epithelial cells.

This figure describes the experimental design used for isolation and culture of murine epithelial cells derived from bladder, cervix, colon, kidney, lung, and mammary glands. Multiple techniques were used to monitor morphological and genomic changes that occurred throughout culture during spontaneous transformation. We identified three sequential stages: pre-immortal, immortal, and transformed based on distinct morphologies.
Figure 2. Pre-immortal, immortal and transformed stages exhibit distinct morphologies.
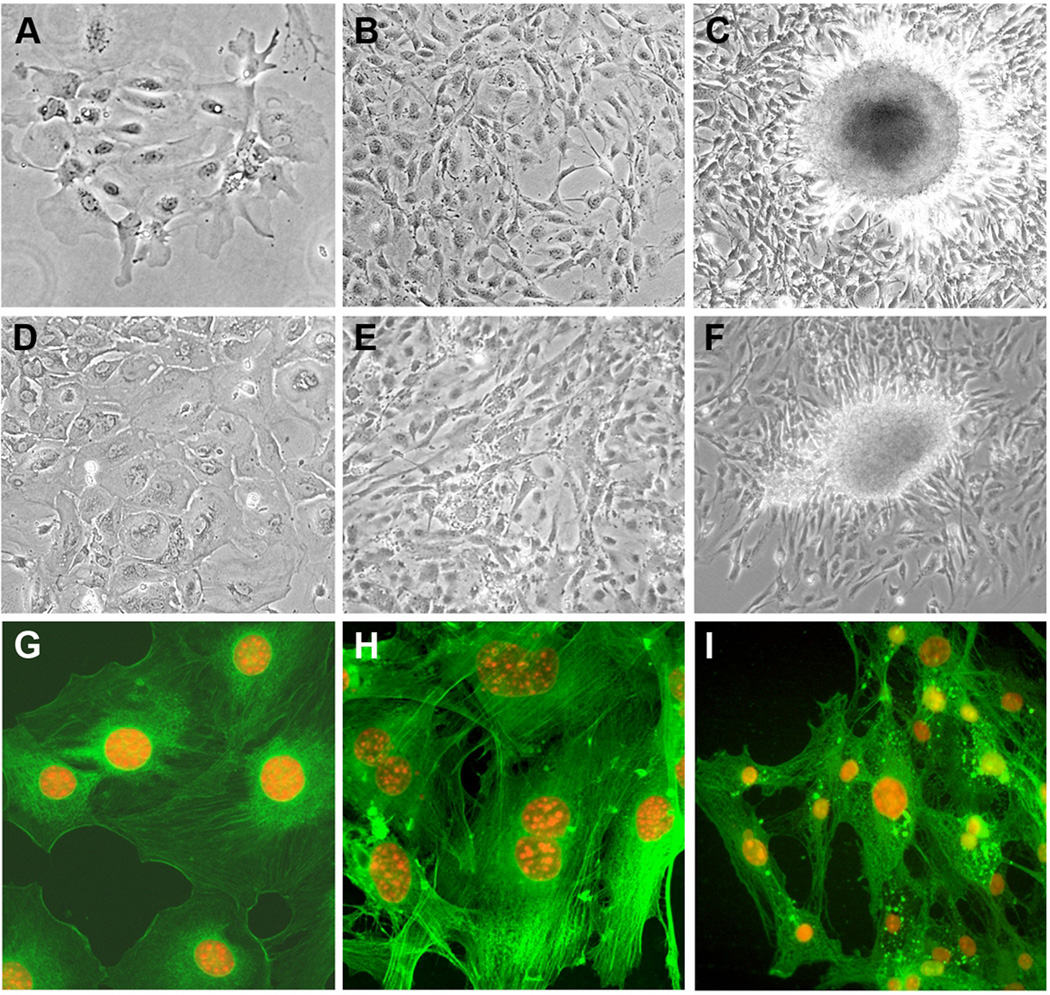
Sequential stages designated as (A) pre-immortal, (B) immortal, and (C) transformed for bladder epithelial cells. Sequential stages designated as (D) pre-immortal, (E) immortal, and (F) transformed for cervical epithelial cells. Note the pronounced formation of foci in (C) and (F). Actin staining (green) of mammary epithelial cells designated as pre-immortal (G), immortal (H) and transformed (I). DNA was counterstained with DAPI (orange pseudo-color). Note that at the immortal stage; the actin fibers are more disorganized compared with pre-immortal. At the transformed stage, actin becomes concentrated into dense figures. In (H) we show a binucleated cell (center of image). (I) Note the enlarged nucleus (center) resulting from increased DNA content.
The length of time epithelial cells remained in the three stages of spontaneous transformation varied for the different tissue-types. Lung epithelial cells became transformed in some cultures as quickly as two weeks. In contrast, kidney cells remained in the pre-immortal stage on average for about one month, and in the immortal stage for two months on average. Primary cultures derived from bladder, cervix, colon, and mammary gland remained in the pre-immortal stage for about three to four months. The immortal stage for cell lines derived from these organs, extended three to six months, with many requiring another six months to become fully transformed.
Chromosome Analysis by SKY and FISH
Next, we investigated whether the sequential steps of cellular transformation were associated with aneuploidy and genomic imbalances, as is the case for human carcinogenesis. Gains of the same chromosome in two or more cells or losses in three or more cells were considered clonal changes, and ploidy was determined for each cell (Supplementary Information Table 1). Table 2 and Supplementary Information Table 2 summarize the numerical and structural aberrations detected at the pre-immortal cultures. Figure 3 shows examples of aberrant chromosomes and nuclei observed during the spontaneous transformation process. The appearance of aneuploidy and tetraploidy (Fig. 3A and B, respectively), and anaphase bridge formation (Fig. 3C) was accompanied by the formation of dicentric chromosomes (Fig. 3D) identified as early as the pre-immortal stage and continuing into the immortal stage. At the transformed stage, DNA damage (Fig. 3E), complex rearrangements (Fig. 3F), and gene amplifications (Fig. 3G and H) prevailed. We detected clonal chromosome imbalances at the pre-immortal stage and observed that they were maintained throughout progression. Figure 4A displays the summary of recurrent and tissue-specific genomic imbalances at the transformed stage for each set of tissues.
TABLE 2.
Chromosome Imbalances in Pre-immortal Cultures: SKY Analysis
 |
 |
 |
Figure 3. Chromosomal aberrations during spontaneous transformation.
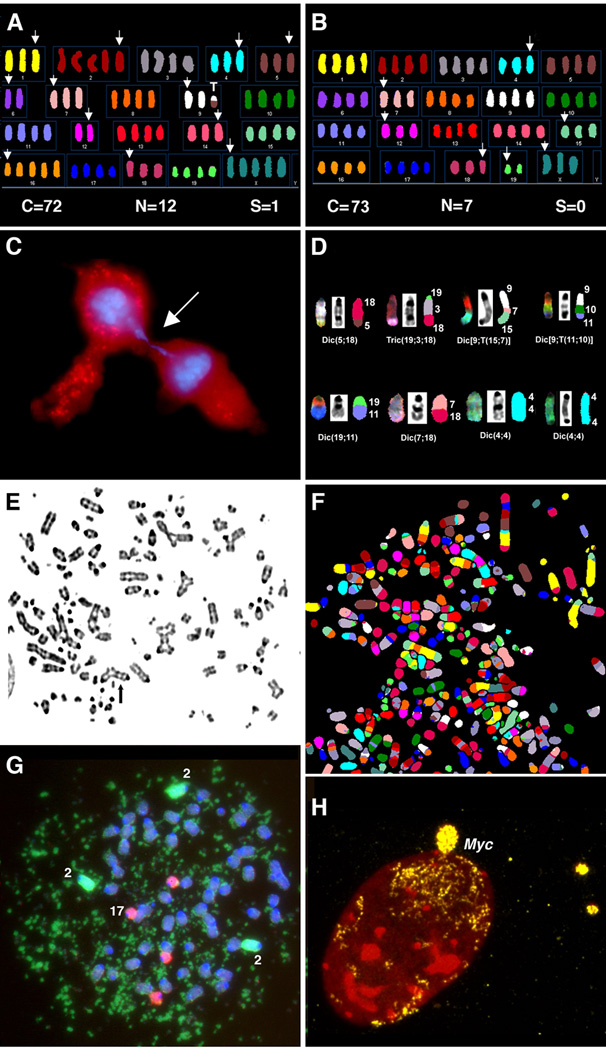
Representative karyotypes after SKY analysis of the pre-immortal stage from cells derived from the cervix (A) and colon (B). These karyotypes are all near-tetraploid (±4n) with recurrent chromosomal aneuploidies (loss of Chrs 4, 7, and 18). White arrows denote numerical aberrations. (C) Example of an anaphase bridge. DNA is stained with DAPI (blue) and cytoplasm with cytokeratin (red). (D) Additional examples of specific chromosomal aberrations, specifically dicentric chromosomes (upper and bottom panel). (E) Examples of profound chromosomal instability in immortal bladder cells in the form of acentric fragments, chromosome breakage, and tri-radial exchanges. (F) Example of metaphase spread from transformed kidney cell line analyzed by SKY containing multiple complex chromosome aberrations. (G) FISH analysis of transformed kidney cells. DAPI stain shows chromosomes in blue, chromosome 17 (red signal), and chromosome 2 (green signal). Note the presence of enormous numbers of double minute chromosomes (dmin) derived from chromosome 2. (H) FISH analysis using DNA probe for Myc (yellow) in a transformed bladder cell, with DNA counterstained with DAPI (pseudo-color red). Massive amplification of the Myc oncogene is seen in an interphase nucleus and micronuclei.
Figure 4. Chromosomal gains and losses and patterns of aneuploidy.
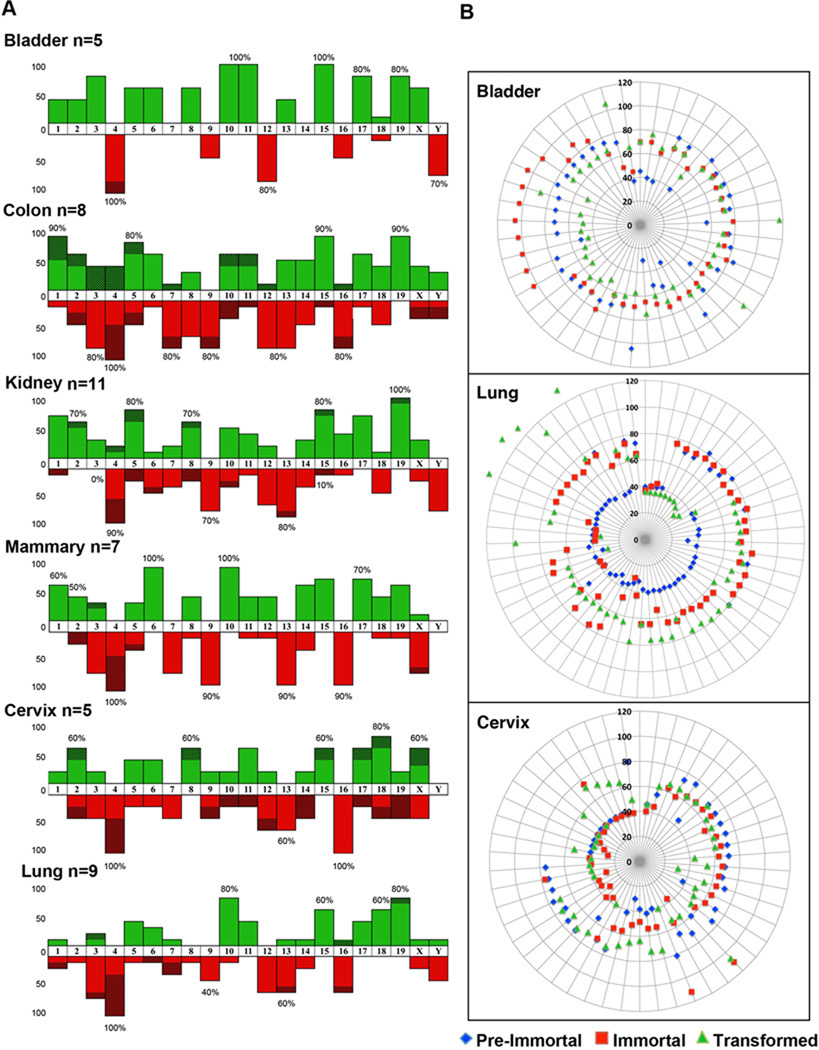
(A) Chromosomal gains and losses based on SKY analysis of cell lines from all six organs at the transformed stage (green, gains; red, losses). X-axis: chromosomes in numerical order starting with 1; Y-axis: total percentage of cases with a given aberration. Note that some chromosomes are subject to frequent gains (e.g., chromosome 15) or losses (chromosome 4). Dashed areas indicate that the chromosome is only partially gained or lost. In addition to chromosomes that are subject to imbalances in all tissues, we observed also tissue specific imbalances. Note that some aberrations occurred in all cases of a given tissue. (B) Distribution of ploidy levels determined by SKY analysis. These circular plots indicate ploidy ranges of the different tissues for the three different stages in different colors as determined by the number of chromosomes. For instance, regarding lung, the majority of the pre-immortal cells were diploid (2n=40), or near-diploid, ±2n). This was followed by a frequent tetraploidization (or near-tetraploidization) when the cells immortalized, and became near-triploid by the sequential loss of chromosomes when transformed. In contrast, regarding the bladder, most cells became immediately near-tetraploid at the pre-immortal stage, whereas in the cervix we observed a substantial fraction of triploid (or near-triploid) cells. Each radial line indicates an individual cell for which cytogenetic analysis was conducted in all three stages.
While there were subtle differences between the cultures, we observed several consistent features: 1) numerical changes outnumbered structural aberrations; 2) tetraploidy was a common and early phenomenon; 3) the loss and/or rearrangement of chromosome 4 was one of the most recurrent and earliest cytogenetic events; 4) chromosomal instability was in general more pronounced after the pre-immortal stage; 5) recurrent imbalances were found in cell lines from all six organs, but were accompanied by tissue specific aneuploidies at the immortal stage; and 6) gains of whole chromosomes, which occurred early, progressed at later stages to high-level copy number increases, often in the form of double minute chromosomes and hsr’s while the initial aneuploidy was maintained.
As early as the pre-immortal stage, cultures from the six organs revealed clones with distinct stem lines, i.e., with modal chromosome numbers in the near-diploid and near-tetraploid range, or, with much lower incidence, in the near triploid range (Fig. 4B). In the lung and kidney cultures, the majority of the cells in the pre-immortal stage were normal diploid/near-diploid, but increased in both ploidy and the number of chromosomal aberrations when becoming immortalized and transformed. In contrast, tetraploidization appeared to be the predominant initial event in mammary cultures, and it was accompanied by tissue specific genomic imbalances (Fig. 4B and Supplementary Information Fig. 1). In all spontaneously transformed cultures, both chromosome numbers and ploidies continuously underwent changes throughout the process.
Despite a considerable amount of chromosomal instability, the resulting distribution of genomic imbalances was non-random. We observed recurrent imbalances such as losses of chromosomes 4, 9, 12, and 16, and gains of chromosomes 1, 10, 15, and 19, as early as the pre-immortal stage. Some cell lines from the different organs revealed specific genomic patterns at the transformed stage, e.g., gains of chromosomes 1, 6, 11, 18, and 19 in colon, mammary, bladder, cervix and kidney cultures, respectively, and losses of chromosomes 8 in colon, and 16 in cervix cells (Fig. 4A). In addition, bladder cells rarely lost chromosome 13; mammary gland cells did not lose chromosomes 12, and kidney cells did not exhibit losses of chromosome 3.
At the transformed stage, cell lines continued to be aneuploid and additionally exhibited chromosome breakage, and complex unbalanced translocations. There is a type of chromosomal aberration called a jumping translocation, where a specific chromosomal arm or segment becomes fused to different chromosomes. These rearrangements are often observed in human carcinoma cell lines, and were also identified primarily at the later stages of transformation in our murine cell lines (Fig. 3E and F and Supplementary Information Fig. 2) (Padilla-Nash et al., 2001). Micronuclei were observed, and identified by FISH as containing hundreds of copies of oncogenes, e.g. Myc and Mdm2, particularly in the bladder cell lines (Fig. 3H). Many unbalanced structural aberrations involved chromosome 4 with breaks localized either near bands 4C3-C6 or bands 4D–E. (Supplementary Information Fig. 2 and Supplementary Information Table 2). In all cell lines, regardless of the organ of origin, reciprocal translocations were rare.
Human cancers of epithelial origin, i.e., carcinomas, are defined by a non-random distribution of genomic imbalances. This distribution is to a certain extent tissue specific, but the survey of all carcinomas clearly shows that some chromosomes are more often gained, while others are usually lost. For instance, chromosome arms 1p, 3p, and 9p show reduced copy numbers while 5p and 8q are subject to increased copy numbers among different cancer entities. We were curious as to whether these “master” chromosomes of human cancer were similarly affected accordingly in our mouse models of spontaneous transformation. This was achieved by comparing regions of frequent imbalances in human carcinomas with the orthologous regions mapping to mouse chromosomes (Fig. 5). Chromosome 4 has regions homologous to human chromosome arms 1p and 9p (Fig. 5A); both are frequently lost in many human cancers. Chromosome 9 was also lost in the majority of the cell lines that contains another region homologous to chromosome arm 3p, deleted in numerous human carcinomas (Fig. 5B). Conversely, mouse chromosome 15, containing chromosome regions homologous to human chromosome arms 8q and 5p, was also one of the most commonly gained chromosomes (Fig. 5C), both of which are subject to recurrent copy number increase in human carcinomas. A small region at the proximal end of chromosome 4 also has sequences homologous to human chromosome arm 8q (Fig. 5A). This region was also gained in four cell lines from the kidney and colon (Fig. 4A and Supplementary Information Table 4). Therefore, regions of frequent copy number changes in human carcinomas were also affected with the same directionality in the spontaneously transformed mouse epithelial cells.
Figure 5. Cross-species comparison of genomic imbalances in mouse (MMU) and human (HSA) chromosomes.
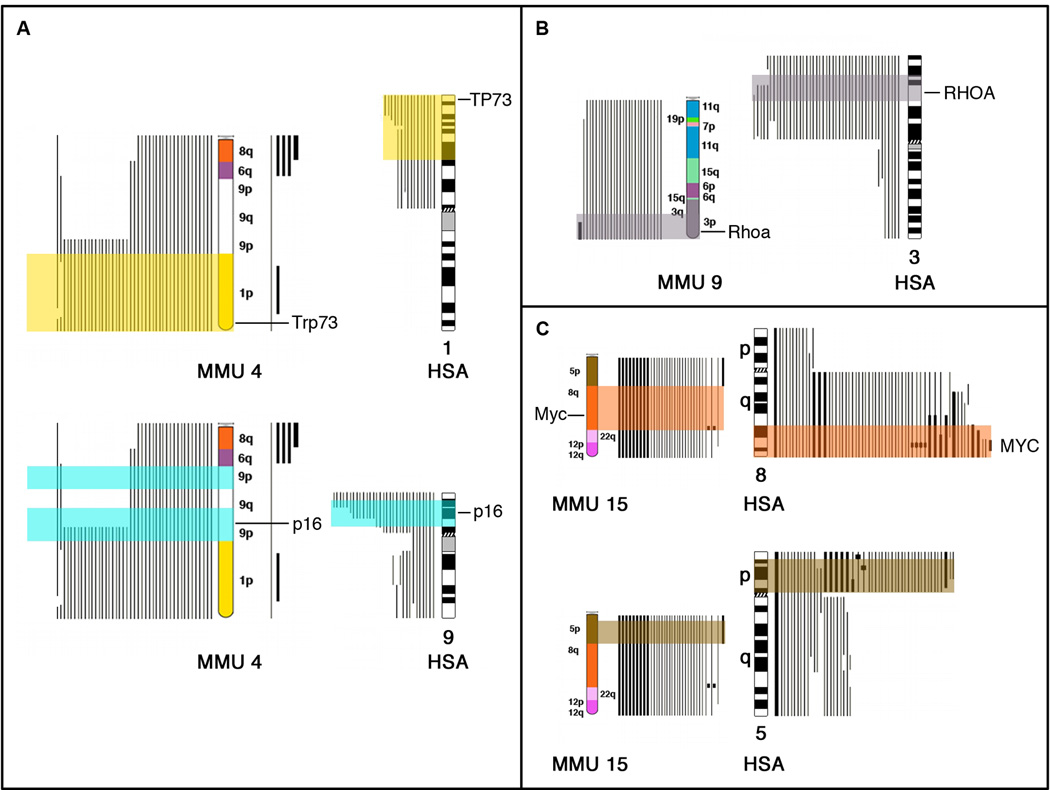
Visualization of genomic imbalances observed in human carcinomas (our own data derived from CGH analysis colon, breast, cervical, and lung cancers) and those detected in the mouse models (mammary gland, lung, colon, bladder, kidney, and cervix). (A) Ideogram of mouse chromosome 4 (MMU4) mapped with human orthologous regions. HSA 1p and 9p are frequently lost in human carcinomas, as are the orthologous regions on MMU 4. Note that the tumor suppressor gene CDKN2A/INK4A/p16, which maps to chromosome arm 9p, is included in the region frequently lost within MMU4, also containing the orthologous gene Cdkn2a/Ink4a/p16. (B) Display of chromosome arm lost from HSA3 in human cancers homologous to MMU 9. (C) MMU 15 contains two homologous segments from human chromosomes frequently subject to gains (HSA 8q and 5p). These regions contain the Myc oncogene, and the RNA component of the telomerase complex, Tert. All respective homologous segments are highlighted in color on MMU and HSA chromosomes. Data for mouse orthologous regions was obtained from: http://useast.ensembl.org/Mus_musculus/Location/Synteny/
Binucleated Cells and Live Cell Imaging at the Pre-Immortal Stage
SKY analysis frequently revealed karyotypes with a tetraploidization of the chromosome content. This was consistent with the presence of binucleated cells, which we observed as early as the pre-immortal stages (Fig. 6A and B). While the percentages of binucleated cells differed among tissues (Supplementary Information Fig. 3), they persisted throughout progression. In order to determine the mechanisms driving the formation of binucleated cells and genome tetraploidization, we used live-cell imaging of three different primary lung epithelial cell cultures, isolated as described above, from C57BL/6, Trp53 null, and GFP-H2B mice. Cells were imaged periodically for 48 hrs and found to form binucleated cells repeatedly. From the sequential images it was revealed that binucleation was a result of failure of cytokinesis (cell from C57BL/6 mouse, Fig. 6C) rather than cell fusion. It was observed in GFP-H2B cells that during mitoses these cells were prone to chromosome segregation errors consisting of loss of chromosomes, which was in agreement with our SKY results (Supplementary Information Fig. 4).
Figure 6. Binucleate cell analysis.

(A) Bi-nucleate mammary cells stained for actin (green) to visualize cytoskeletal structure; DNA stained with DAPI (pseudo-color red); (B) Binucleated cells (arrows) in bladder culture, passage 0; (C) Images taken from live-cell imaging of a primary C57BL/6 normal lung cell undergoing the process of binucleation. Arrows identify the number of nuclei present within the cell.
Centrosome Analysis
Proper centrosome physiology is crucial for faithful mitotic chromosome segregation and maintenance of genomic stability, with normal cell divisions requiring two centrosomes, whereas abnormal centrosome numbers are often a feature of cancer cells (Boveri, 1914; Ghadimi et al., 2000; D’Assoro et al., 2002; Nigg, 2002; Acilan and Saunders, 2008; Godinho et al., 2009). Using an antibody against γ-tubulin, one of the main centrosomal proteins, we analyzed centrosome numbers and morphology throughout the spontaneous transformation of epithelial cells. Abnormal centrosome numbers, and distributions, such as clusters or rings, were observed as early as 48 hrs in cells from all six organs (Fig. 7). Abnormal centrosome numbers were evident in mono-nucleate as well as in bi- or multi-nucleated cells (Fig. 7D). Of note, generally once cells reached the transformation stage, the majority of cells contained 1–2 centrosomes even though the cells were often highly aneuploid and exhibited extensive chromosome instability. Thus, there appears to be a reversal of the defective centrosome maintenance phenomenon concurrent with transformation.
Figure 7. Centrosome analysis.

Examples of centrosome amplifications. Centrosome abnormalities were observed early in the transformation process (48 hr). (A), Bladder cell exhibiting centrosome duplication; (B) Binucleated mammary cell with multiple centrosomes; and (C) mitotic colon-derived cell. (Yellow = FITC-labeled anti γ-tubulin; red = DNA). (D) Graph displaying numbers of cells containing abnormal centrosome counts for 17 cell cultures and their derived cell lines at three stages of spontaneous transformation.
Telomerase Assay
Another cellular parameter intricately involved in tumorigenesis relates to the activity of the telomerase complex (Blackburn et al., 2006; Belgiovine et al., 2008). Telomerase activity was measured in normal uncultured epithelial cells and from the six organ-derived cell lines. The average telomerase activity increased during the transformation process, yet varied between the cell lines from different organs as well as between stages (Fig. 8). Two specific cell lines, M1C Bladder and M2C Bladder, were found to have telomerase activities more than 50 – 100 fold higher than their normal counterparts. Both cell lines contained high-level amplifications (more than 100 dmin/cell) of the Myc oncogene (Supplementary Information Table 3). Robertsonian translocations were observed by SKY throughout progression, and in particular in the colon cell lines that had the lowest levels of telomerase enzyme activity. These translocations arise through the breakage and fusion of the short arms of the acrocentric mouse chromosomes. FISH probes for telomere DNA repeats revealed that specific chromosomes in M2C Colon cells/cell lines had weak or missing telomeres, which subsequently became involved in Robertsonian translocations at the different stages of transformation (Supplementary Information Fig. 5 and Supplementary Information Table 4). The number of chromosome fusions therefore appears to be directly attributed to the loss of telomere sequences. Additionally, the two bladder cell lines that showed the highest levels of telomerase activity carried genomic amplification of both the Terc and Tert loci, genes encoding the proteins that form the telomerase holoenzyme (Supplementary Information Table 3 and Supplementary Information Fig. 6).
Figure 8. Average telomerase activity.

Graphical display of the average telomerase activity levels using the TRAP-assay for normal uncultured cells from six different organs, and for spontaneously transformed cells at two stages of transformation (immortal and transformation). Tert-deficient cells served as the negative control, and murine E4 cells that over-express telomerase enzyme activity, were used for normalization.
Nude Mouse Assay
Finally, we were interested to learn to what extent the transformed cell lines had acquired the ultimate phenotype of malignancy, the potential to induce tumors when transplanted into nude mice. We injected 14 cell lines (five bladder, six kidney, two mammary, and positive control cell line Comma-D), and the experiment was terminated by 16 weeks, or earlier if the tumor reached 1 cm3 in size. Three kidney cultures and three bladder cultures yielded tumors, as did Comma-D. SKY of chromosomes prepared from various tumors revealed chromosomal aberrations similar to those detected in the parental cell line. Initially, one bladder cell line (M1I Bladder) that contained genomic amplifications of the oncogene Mdm2 did not form tumors. In a second round of injections, this cell line did produce tumors, but only after a prolonged latency of 52 weeks (Table 3). To determine how early a cell line developed its tumorigenic potential, M1C Bladder that contains multiple double minute chromosomes (dmin’s) for Myc and that had produced tumors in two weeks was re-injected with cells from its immortal stage, which does not contain any Myc amplifications. The immortal cells were not tumorigenic after 52 weeks of incubation. At present, we cannot identify any specific marker that would predict tumor formation, including the presence of dmin’s containing oncogenes or overt chromosomal instability.
TABLE 3.
Nude Mouse Assay of Spontaneously Transformed Murine Epithelial Cells
| Cell Line | Passage | Tumors (3 mice) |
Dmin’s | Centrosomes % abnormal cells |
Telomerase (TU) |
|---|---|---|---|---|---|
| M1C Blad | 57 | 3 | Myc | 1 | 2578 |
| M1C Blad | 68 | 3 | Myc | “ | “ |
| M1C Blad * (Immortal) | 16 | 0 | none | 31 | 946 |
| M2C Blad | 63 | 3 | Myc | 7 | 1134 |
| F1G Blad | 56 | 3 | Mdm2 | 15 | 9.5 |
| F2G Blad | 54 | 0 | none | 32 | 29.3 |
| M1I Blad | 53 | 0 | Mdm2 | 6.5 | 66 |
| M1I Blad * | 54 | 2 | Mdm2 | “ | “ |
| 23.7 (av) normal tissue | |||||
| M1C Kid | 44 | 0 | none | 14.5 | 52 |
| F1B Kid | 52 | 1 | yes (Chr19) | 31 | 36.6 |
| M2C Kid | 39 | 0 | none | 4.5 | 284 |
| F1G Kid | 35 | 0 | none | 14 | 52 |
| F2G Kid | 36 | 1 | yes (Chr19?) | 3 | 132 |
| M2G Kid | 35 | 3 | yes (Ch2) | 2 | 47 |
| 18.7 (av) normal tissue | |||||
| F1I Mam | 29 | 0 | no | 17.5 | 137.2 |
| F1G Mam | 40 | 0 | yes (Chr 6) | 3 | 176.4 |
| Comma-D (pos. control) | 18 | 2 | yes (Chr?) | NA | NA |
| 31 (av) normal tissue |
First nude mouse assay = 16 weeks
= second nude mouse assay, cells incubated for 52 weeks
In summary, we have established and characterized 45 spontaneously transformed epithelial cell lines from six different mouse organs. As in human carcinogenesis, aneuploidy and the acquisition of specific genomic imbalances define these new tumor models and our findings suggest that they will be useful for preclinical testing of candidate cancer therapeutics.
DISCUSSION
Tumors of epithelial origin, carcinomas, are the most common types of cancers in humans. They are defined by the presence of chromosomal aneuploidies, which result in specific genomic imbalances (Albertson et al., 2003; Baudis, 2007; Heim and Mitelman, 2009; Ried, 2009; Beroukhim et al., 2010). These imbalances result in a massive deregulation of the transcriptome of cancer cells, because genomic copy number directly influences transcript levels (Upender et al., 2004; Grade et al., 2007; Hanahan and Weinberg, 2011). The mouse has become a widely used model for the study of human tumorigenesis, including preclinical testing of novel drugs (Balmain and Harris, 2000; Hansen and Khanna, 2004; Hu et al., 2004; Green and Hudson, 2005; Foijer et al., 2008; Telang and Katdare, 2011). We and others have used molecular cytogenetic tools, such as SKY and CGH, to establish maps of chromosomal aberrations in murine tumor models (Ogawa et al., 1999; Liyanage et al., 2000; Sargent et al., 2002; Herzog et al., 2004; Ried et al., 2004; Zimonjic et al., 2009). From these analyses it has become clear that the translocation-induced activation of oncogenes, the paradigm of tumorigenesis, is recapitulated in relevant models of hematological malignancies (Janz, 2006; Potter, 2007; Li et al., 2009; Hamblin, 2010; Qi et al., 2010). However, many mouse models of human solid tumors reveal fewer chromosomal aneuploidies than their human counterparts (Ried et al., 2004; Schvartzman et al., 2010). This could be attributable to the fact that many of these tumor models require strong tissue specific expression of oncogenes, a situation not usually found in premalignant lesions of human carcinomas. Based on the presence of such a strong oncogenic stimulus, murine epithelial tumorigenesis does not require the acquisition of specific genomic imbalances. We hypothesized that spontaneous transformation of normal epithelial cells would more closely mimic the genomic aberration pattern observed in human cancers. Previous studies of spontaneous cellular transformation have primarily used viruses, radiation or chemical exposure, and largely relied on easily cultured fibroblasts, which may not accurately reflect the changes that lead to epithelial oncogenesis (Sanford and Evans, 1982). The study presented here is the first comprehensive analysis of morphological and genetic events associated with cellular transformation of murine epithelial cells derived from bladder, colon, cervix, kidney, lung, and mammary glands utilizing multiple molecular cytogenetic methods. In this study we established 45 murine epithelial cell lines using the isogenic C57BL/6 mouse strain that is MMTV-free (mouse mammary tumor virus), and has low propensities for spontaneous in vivo tumor formation in the organs selected for this study (http://www.informatics.jax.org/mtbwi/tumorFrequencyGrid.do). The morphological changes observed throughout the spontaneous transformation of murine epithelial cells recapitulated many of the phenotypes that have been described for human in vitro cultures, with the exception that normal epithelial mouse cells do not enter two distinct crisis stages that were described for the spontaneous transformation of human mammary epithelial cells (Stampfer and Yaswen, 2000; Tlsty et al., 2004). We identified three main stages that were similar among tissue types assayed: pre-immortal, immortal, and transformed stages. The pre-immortal and immortal stages were defined by morphological criteria, including cellular shape, and their cytoplasmic/nuclear ratio using actin staining, and on their proliferative activity. The transformed stage was further defined by the formation of elevated foci and an actin-staining pattern consistent with pseudopodia and podosomes, one of the prerequisites for cancer cell invasion and metastasis (McNiven et al., 2004; Murphy and Courtneidge, 2011).
Our main focus was directed on querying whether the process of spontaneous transformation required the acquisition of tissue-specific chromosomal aneuploidies. Indeed, the acquisition of chromosomal aneuploidies was present as early as the pre-immortal stage that increased upon immortalization and transformation. Interestingly, aneuploidy was observed in different genetic backgrounds, as for example in pre-immortal lung cultures where the majority of cells were diploid, and in mammary cultures where there existed a balance two states, cells containing either diploid or tetraploid genomes. Tetraploidy and polyploidization occurs frequently in human cancers (Vitale et al., 2010; Davoli and de Lange, 2011). For example, our diagnostic FISH applications in cervical carcinogenesis has revealed two distinct genome patterns as well, both resulting in either the acquisition of extra copies of chromosome arm 3q in a diploid cell, or copy number increases of this chromosome arm after acquiring a tetraploid intermediate (Heselmeyer-Haddad et al., 2005; Andersson et al., 2009).
Early investigations of primary murine brain and lung fibroblast and epithelial cells cultured in vitro revealed numerous morphological changes including the presence of abnormal mitotic figures, anaphase bridges, and lagging chromosomes (Levan and Biesele, 1958). In the pre-immortal stage, we also observed these mitotic abnormalities in our spontaneously transformed cells. In addition, dicentric chromosomes (Fig. 3C and D) and other structural aberrations, including deletions, Robertsonian translocations, and unbalanced translocations were detected (Supplementary Information Table 2). Reciprocal translocations were rarely observed in the majority of the cell lines throughout progression (Supplementary Information Table 4). This is also a consistent feature observed in human carcinomas.
Cowell established nine mouse epithelial bladder cell lines from C57BL/lcrf-at adult male bladders treated in vitro with the carcinogen DMBA (7,12-dimethylbenz[a]anthracene) (Cowell, 1980). The controls, normal epithelial bladder cell, became spontaneously transformed. Subsequently these were determined by G-banding as being either near-diploid or near-tetraploid. The transformed control and treated bladder cells exhibited recurrent gains of chromosomes X, 6, and 15 as well as loss of chromosomes 4 and Y. Our mouse bladder transformed cell lines also contained gains of these same chromosomes, with additional gains of chromosomes 5, 10, 11, and 19 (Fig. 4A). Cytogenetic studies of chemically-induced murine tumors derived from the cervix (Endo et al., 1994) and lung (Sargent et al., 2002; Herzog et al., 2004) revealed gains of chromosomes 1, 6, 15, and 19, and losses of 4, 7, and 12, also detected in our spontaneously transformed cervix and lung cultures. This observation supports the interpretation that it is rather the tissue of origin, and not the mode of induction, which eventually determines the signature of genomic imbalances, another consistent feature of human cancers (Ried et al., 1999; Beroukhim et al., 2010).
Mouse chromosomes are highly rearranged relative to their human homologues, with individual human chromosome arms often mapping to multiple mouse chromosomes (http://useast.ensembl.org/Mus_musculus/Info/Index). This provides an opportunity to further refine the regions of tissue-specific deletions, and amplifications observed in human cancers. By projecting the map of genomic imbalances we observed in our mouse model onto the homologous regions detected in human carcinomas, we observed remarkable similarities. The most consistently deleted region on mouse chromosome 4 is orthologous to human chromosome arm 9p, and contains the tumor suppressor gene Cdkn2a (Ink4a/p16), a gene frequently mutated, deleted, or epigenetically inactivated in a variety of immortalized murine cells and human cancers (Serrano, 2000; Munot et al., 2006; Tzatsos et al., 2009; Lomberk, 2011). Its frequent deletion in our mouse models supports the dominant role of this tumor suppressor and suggests that its function presents a bottleneck that must be removed in order for spontaneous transformation to procede.
Human 1p, a chromosome arm consistently subject to copy number losses in human carcinomas, maps to four different mouse chromosomes (1, 3, 4, and 5) with the largest portion localized to the distal end of chromosome 4. The central role of genes on distal mouse chromosome 4 involved with cellular transformation is further corroborated by the fact that it contains a number of genes involved in DNA repair (e.g. Rad54l and Mad2l2), the tumor suppressor gene Trp73, numerous apoptotic genes (Bcl10, Casp9, etc), as well as multiple micro-RNAs (e.g. Mir200a, Mir200b, and Mir34-a) (Payne et al., 2011). The same reasoning may also apply to mouse chromosome 9, which is always lost in our cell lines and that contains segments homologous to portions of human chromosome arm 3p (3p21.2–3). (Fig. 4B and Supplementary Information Table 5). Again, one can hypothesize that this is another critical region, whose loss is required for tumorigenesis. In both species this region contains genes such as Parp3, Dock3/Moca, and Rhoa, which are involved in regulating genomic stability, cytokinesis, and migration and invasion, respectively (Caspi and Rosin-Arbesfeld, 2008; Boehler et al., 2011; Vega et al., 2011).
Chromosome 15 is never lost in our transformed cell lines and contains portions homolgous to human chromosome arm 8q, where the oncogene MYC is localized (Fig. 4A and Supplementary Information Table 5). This oncogene is frequently amplified and overexpressed in human carcinomas and transformed rodent cell lines (Popescu and Zimonjic, 2002; Meyer and Penn, 2008; Prochownik, 2008). Other chromosomes that are most often gained in our mouse model includes other oncogenes such as Mdm2 (Chr10), Erbb2 (Chr11), and the homologous region HSA 5p (mapping to both mouse Chr15 and Chr17) gained with high frequency in multiple human carcinomas, highlighting the conservation of tissue-specific chromosome imbalances associated with transformation in both species.
The frequent presence of tetraploid clones was consistent with our observation of bi-nucleated cells in primary cultures as early as 48 hours for all cell types and present at all stages of transformation. Binucleated cells can arise through cell fusion or failure of cytokinesis (Duelli and Lazebnik, 2003; Shi and King, 2005). In order to identify which of these mechanisms is responsible for bi-nucleation in our model, we used live cell imaging of GFP-H2B lung cells. This analysis revealed that bi-nucleated cells were generated from failure of cytokinesis, with subsequent loss of chromosomal material (Supplementary Information Fig. 4), thereby providing a potential mechanism accounting for the chromosomal aneuploidy observed at the pre-immortal stage. Due to the fact that the ensuing tetraploidization was frequently observed and that it led to an increased rate of chromosome segregation errors, and hence genomic imbalances, we can conclude that one of the first oncogenic events in the spontaneous transformation of mouse epithelial cells is indeed failure of cytokinesis after DNA replication and chromosome segregation.
Chromosomal instability has been linked to abnormal numbers of centrosomes (Nigg, 2002; Acilan and Saunders, 2008; Difilippantonio et al., 2009; Ganem et al., 2009; Godinho et al., 2009). We observed centrosome abnormalities as early as 48 hr; they continued into the immortal stage, an observation that would be consistent with both tetraploidization and chromosome mis-segregation. Transformed cells exhibited extensive aneuploidy and numerous structurally aberrant chromosomes. However, at this later stage, centrosome numbers became normalized. These data suggest that abnormal centrosome numbers result in abnormal mitoses that produce daughter cells with genomic aberration patterns conducive for immortalization and clonal selection. Therefore, the maintenance of the transformed state, and the tumorigenic potential in this mouse model can occur with, or possibly requires, normalized centrosome numbers (Table 3).
Telomerase regulation in human cancers is a complex process, with activation of telomerase or decreased telomerase activity both associated with cellular immortalization and tumorigenicity of human and murine cancers (Artandi et al., 2000; Belgiovine et al., 2008). In our cell lines, telomerase activity usually increased during the transformation process yet was different for cells derived from the different organs (Fig. 8 and Supplementary Information Table 3). Telomere erosion has been implicated in the formation of chromosome aberrations in human cancers (Stimpson et al., 2010). The colon cell lines in particular exhibited loss of telomere sequences and continuously generated Robertsonian translocations and dicentric chromosomes during progression. (Supplementary Information Fig. 5). Two cell lines have both amplifications of Myc as well as copy number gains of both Tert and Terc. They also had greater than 50 – 100-fold higher telomerase activity than their normal counterparts, and additionally had high-level amplifications (>100 dmin/cell) of the Myc oncogene. In human mammary cells, MYC has been shown to directly interact and activate the promoter of the TERT telomerase gene (Wang et al., 1998; Bazarov et al., 2009). These two bladder cell lines potentially present a unique opportunity to determine the interactions between Tert, Terc, and Myc and their influence on telomerase activity throughout the transformation process.
To test the tumorigenic potential of the spontaneously transformed cell lines, we injected 14 cell lines into immuno-compromised mice. Half of the cell lines resulted in visible masses, which, upon histological evaluation, were confirmed as malignant tumors (Padilla-Nash et al., manuscript in preparation). This clearly suggests that the process of spontaneous immortalization and transformation and the emergence of aneuploidy and genomic imbalances resulted in an aberration pattern consistent with malignancy. However, neither the degree of aneuploidy, the presence of dmin and oncogene amplification, nor, in fact, any other parameter that we have assessed with these methods distinguished between tumorigenic vs. non-tumorigenic cell lines.
Comparative studies between in vivo tumors and carcinoma cell lines have previously shown that the genomic aberration pattern that so recurrently defines solid tumors of epithelial origin is maintained in cell lines derived from primary tumors (Ghadimi et al., 1999; Camps et al., 2009). In addition, using RNA microarrays we have demonstrated that approximately 75% of genes are deregulated in the same directionality when comparing primary tumors and cell lines (Grade et al., 2011). The selective pressures exerted on the in vitro culture of epithelial cells appear to be similar to the selective pressures found in vivo, in particular with respect to the conversion of the cellular morphology of a normal cell to a more invasive form, potentially creating a metastatic tumor.
Taken together, these results validate the use of cell lines as cancer models. Currently we are in the process of performing global gene expression profiling to potentially identify a set of differentially expressed genes that might explain the distinct phenotypes for the transformed cell lines with respect to their tumorigenic potential.
In summary, our mouse model of cellular transformation has revealed that the progression from the pre-malignant state to malignancy is driven by a specific pattern of genomic imbalances, mainly the result of non-random whole chromosomal aneuploidy and unbalanced structural aberrations. This observation is similar to the sequential acquisition of chromosomal aneuploidies that occurs during human carcinogenesis. As in human cancer, we have identified “master” chromosomes that were consistently gained or lost; it is noteworthy that these chromosomes contained orthologous segments to the “master” chromosomes in human cancers. Along with other changes representative of human tumorigenesis, such as centrosome abnormalities and telomerase activation, we conclude that our novel mouse model closely emulates the sequential stages of increasing cellular dysplasia towards invasive disease that is so specific for human tumors of epithelial origin. Therefore, our mouse models are valuable tools to study carcinogenesis, cancer prevention, and for testing novel therapeutic interventions.
Supplementary Material
ACKNOWLEDGMENTS
The authors sincerely thank the following for their contributions: Dr. Daniel Medina (Comma-D, mammary gland tumor cell line); Dr. Muriel Davison (development of new mouse nomenclature rules for ploidy); Dr. Andrew Griffin, Dr. Thomas B. Friedman, and Dr. Simone Difilippantonio (procurement of mice); Dr. Gil Smith, Dr. William G. Nash, Dr. Roger Reeves, and Dr. George M. Padilla (tissue culture advice and protocols); Dr. Zoë Weaver, Dr. Cristina Montagna, Dr. Tricia Downing, and Joshua Silverstein (technical support); Priya Mathews and Dara Wangsa (SKY probes); Joseph Cheng, Christy Worch, and Buddy Chen (IT support); Dr. Richard Hodes (telomerase assay); and Dr. Michael Difilippantonio (editing and technical consultation).
Supported by: The Intramural Research Program of the NIH, National Cancer Institute, Center for Cancer Research.
REFERENCES
- Acilan C, Saunders WS. A tale of too many centrosomes. Cell. 2008;134:572–575. doi: 10.1016/j.cell.2008.08.007. [DOI] [PubMed] [Google Scholar]
- Adessi GL, Beck L, Mahfoudi A. A model of glandular epithelium for studying secretion. In: Shaw AJ, editor. Epithelial Cell Culture: A Practical Approach. Oxford: Oxford University Press; 1996. pp. 135–156. [Google Scholar]
- Albertson DG, Collins C, McCormick F, Gray JW. Chromosome aberrations in solid tumors. Nat Genet. 2003;34:369–376. doi: 10.1038/ng1215. [DOI] [PubMed] [Google Scholar]
- Andersson S, Sowjanya P, Wangsa D, Hjerpe A, Johansson B, Auer G, Gravitt PE, Larsson C, Wallin KL, Ried T, Heselmeyer-Haddad K. Detection of genomic amplification of the human telomerase gene TERC, a potential marker for triage of women with HPV-positive, abnormal Pap smears. Am J Pathol. 2009;175:1831–1847. doi: 10.2353/ajpath.2009.090122. [DOI] [PMC free article] [PubMed] [Google Scholar]
- Artandi SE, Chang S, Lee SL, Alson S, Gottlieb GJ, Chin L, DePinho RA. Telomere dysfunction promotes non-reciprocal translocations and epithelial cancers in mice. Nature. 2000;406:641–645. doi: 10.1038/35020592. [DOI] [PubMed] [Google Scholar]
- Balmain A, Harris CC. Carcinogenesis in mouse and human cells: parallels and paradoxes. Carcinogenesis. 2000;21:371–377. doi: 10.1093/carcin/21.3.371. [DOI] [PubMed] [Google Scholar]
- Bardi G, Johansson B, Pandis N, Heim S, Mandahl N, Andren-Sandberg A, Hagerstrand I, Mitelman F. Trisomy 7 in short-term cultures of colorectal adenocarcinomas. Genes Chromosomes Cancer. 1991;3:149–152. doi: 10.1002/gcc.2870030211. [DOI] [PubMed] [Google Scholar]
- Barlow C, Hirotsune S, Paylor R, Liyanage M, Eckhaus M, Collins F, Shiloh Y, Crawley JN, Ried T, Tagle D, Wynshaw-Boris A. Atm-deficient mice: a paradigm of ataxia telangiectasia. Cell. 1996;86:159–171. doi: 10.1016/s0092-8674(00)80086-0. [DOI] [PubMed] [Google Scholar]
- Baudis M. Genomic imbalances in 5918 malignant epithelial tumors: an explorative meta-analysis of chromosomal CGH data. BMC Cancer. 2007;7:226. doi: 10.1186/1471-2407-7-226. [DOI] [PMC free article] [PubMed] [Google Scholar]
- Bazarov AV, Hines WC, Mukhopadhyay R, Beliveau A, Melodyev S, Zaslavsky Y, Yaswen P. Telomerase activation by c-Myc in human mammary epithelial cells requires additional genomic changes. Cell Cycle. 2009;8:3373–3378. doi: 10.4161/cc.8.20.9856. [DOI] [PubMed] [Google Scholar]
- Belgiovine C, Chiodi I, Mondello C. Telomerase: cellular immortalization and neoplastic transformation. Multiple functions of a multifaceted complex. Cytogenet Genome Res. 2008;122:255–262. doi: 10.1159/000167811. [DOI] [PubMed] [Google Scholar]
- Beroukhim R, Mermel CH, Porter D, Wei G, Raychaudhuri S, Donovan J, Barretina J, Boehm JS, Dobson J, Urashima M, Mc Henry KT, Pinchback RM, Ligon AH, Cho YJ, Haery L, Greulich H, Reich M, Winckler W, Lawrence MS, Weir BA, Tanaka KE, Chiang DY, Bass AJ, Loo A, Hoffman C, Prensner J, Liefeld T, Gao Q, Yecies D, Signoretti S, Maher E, Kaye FJ, Sasaki H, Tepper JE, Fletcher JA, Tabernero J, Baselga J, Tsao MS, Demichelis F, Rubin MA, Janne PA, Daly MJ, Nucera C, Levine RL, Ebert BL, Gabriel S, Rustgi AK, Antonescu CR, Ladanyi M, Letai A, Garraway LA, Loda M, Beer DG, True LD, Okamoto A, Pomeroy SL, Singer S, Golub TR, Lander ES, Getz G, Sellers WR, Meyerson M. The landscape of somatic copy-number alteration across human cancers. Nature. 2010;463:899–905. doi: 10.1038/nature08822. [DOI] [PMC free article] [PubMed] [Google Scholar]
- Berthois Y, Katzenellenbogen JA, Katzenellenbogen BS. Phenol red in tissue culture media is a weak estrogen: implications concerning the study of estrogen-responsive cells in culture. Proc Natl Acad Sci USA. 1986;83:2496–2500. doi: 10.1073/pnas.83.8.2496. [DOI] [PMC free article] [PubMed] [Google Scholar]
- Blackburn EH, Greider CW, Szostak JW. Telomeres and telomerase: the path from maize, Tetrahymena and yeast to human cancer and aging. Nat Med. 2006;12:1133–1138. doi: 10.1038/nm1006-1133. [DOI] [PubMed] [Google Scholar]
- Boehler C, Gauthier LR, Mortusewicz O, Biard DS, Saliou JM, Bresson A, Sanglier-Cianferani S, Smith S, Schreiber V, Boussin F, Dantzer F. Poly(ADP-ribose) polymerase 3 (PARP3), a newcomer in cellular response to DNA damage and mitotic progression. Proc Natl Acad Sci USA. 2011;108:2783–2788. doi: 10.1073/pnas.1016574108. [DOI] [PMC free article] [PubMed] [Google Scholar]
- Boveri T. Zur Frage der Entstehung maligner Tumoren. Jena: Verlag von Gustav Fischer; 1914. [Google Scholar]
- Briand P. Malignant transformation of cells cultivated in vitro. A model of carcinogenesis with special reference to “spontaneous” malignant transformation. Dan Med Bull. 1970;17:217–225. [PubMed] [Google Scholar]
- Camps J, Nguyen QT, Padilla-Nash HM, Knutsen T, McNeil NE, Wangsa D, Hummon AB, Grade M, Ried T, Difilippantonio MJ. Integrative genomics reveals mechanisms of copy number alterations responsible for transcriptional deregulation in colorectal cancer. Genes Chromosomes Cancer. 2009;48:1002–1017. doi: 10.1002/gcc.20699. [DOI] [PMC free article] [PubMed] [Google Scholar]
- Caspi E, Rosin-Arbesfeld R. A novel functional screen in human cells identifies MOCA as a negative regulator of Wnt signaling. Mol Biol Cell. 2008;19:4660–4674. doi: 10.1091/mbc.E07-10-1046. [DOI] [PMC free article] [PubMed] [Google Scholar]
- Chiang YJ, Hemann MT, Hathcock KS, Tessarollo L, Feigenbaum L, Hahn WC, Hodes RJ. Expression of telomerase RNA template, but not telomerase reverse transcriptase, is limiting for telomere length maintenance in vivo. Mol Cell Biol. 2004;24:7024–7031. doi: 10.1128/MCB.24.16.7024-7031.2004. [DOI] [PMC free article] [PubMed] [Google Scholar]
- Cowell JK. Consistent chromosome abnormalities associated with mouse bladder epithelial cell lines transformed in vitro. J Natl Cancer Inst. 1980;65:955–961. [PubMed] [Google Scholar]
- D’Assoro AB, Lingle WL, Salisbury JL. Centrosome amplification and the development of cancer. Oncogene. 2002;21:6146–6153. doi: 10.1038/sj.onc.1205772. [DOI] [PubMed] [Google Scholar]
- Danielson KG, Oborn CJ, Durban EM, Butel JS, Medina D. Epithelial mouse mammary cell line exhibiting normal morphogenesis in vivo and functional differentiation in vitro. Proc Natl Acad Sci USA. 1984;81:3756–3760. doi: 10.1073/pnas.81.12.3756. [DOI] [PMC free article] [PubMed] [Google Scholar]
- Davoli T, de Lange T. The causes and consequences of polyploidy in normal development and cancer. Annu Rev Cell Dev Biol. 2011;27:585–610. doi: 10.1146/annurev-cellbio-092910-154234. [DOI] [PubMed] [Google Scholar]
- Difilippantonio MJ, Ghadimi BM, Howard T, Camps J, Nguyen QT, Ferris DK, Sackett DL, Ried T. Nucleation capacity and presence of centrioles define a distinct category of centrosome abnormalities that induces multipolar mitoses in cancer cells. Environ Mol Mutagen. 2009;50:672–696. doi: 10.1002/em.20532. [DOI] [PMC free article] [PubMed] [Google Scholar]
- Duelli D, Lazebnik Y. Cell fusion: a hidden enemy? Cancer Cell. 2003;3:445–448. doi: 10.1016/s1535-6108(03)00114-4. [DOI] [PubMed] [Google Scholar]
- Earle W. Production of malignancy in vitro. IV. The mouse fibroblast cultures and changes seen in the living cells. J Natl Cancer Inst. 1943;4:165–212. [Google Scholar]
- Endo S, Kodama S, Newbold R, McLachlan J, Barrett JC. Cytogenetic analysis of murine cell lines from diethylstilbestrol-induced uterine endometrial adenocarcinomas. Cancer Genet Cytogenet. 1994;74:99–103. doi: 10.1016/0165-4608(94)90005-1. [DOI] [PubMed] [Google Scholar]
- Foijer F, Draviam VM, Sorger PK. Studying chromosome instability in the mouse. Biochim Biophys Acta. 2008;1786:73–82. doi: 10.1016/j.bbcan.2008.07.004. [DOI] [PMC free article] [PubMed] [Google Scholar]
- Friedrich K, von Heydebreck A, Haroske G, Scheithauer J, Meyer W, Kunze KD, Baretton G. Comparative genomic hybridization-based oncogenetic tree model for genetic classification of breast cancer. Anal Quant Cytol Histol. 2009;31:101–108. [PubMed] [Google Scholar]
- Ganem NJ, Godinho SA, Pellman D. A mechanism linking extra centrosomes to chromosomal instability. Nature. 2009;460:278–282. doi: 10.1038/nature08136. [DOI] [PMC free article] [PubMed] [Google Scholar]
- Gey GO, Gey MK, Firor WM, Self WO. Cultural and cytologic studies on autologous normal and malignant cells of specific in vitro origin. Conversion of normal into malignant cells. Acta Unio Internationalis Contra Cancrum. 1949;6:706–712. [Google Scholar]
- Ghadimi BM, Sackett DL, Difilippantonio MJ, Schrock E, Neumann T, Jauho A, Auer G, Ried T. Centrosome amplification and instability occurs exclusively in aneuploid, but not in diploid colorectal cancer cell lines, and correlates with numerical chromosomal aberrations. Genes Chromosomes Cancer. 2000;27:183–190. [PMC free article] [PubMed] [Google Scholar]
- Ghadimi BM, Schrock E, Walker RL, Wangsa D, Jauho A, Meltzer PS, Ried T. Specific chromosomal aberrations and amplification of the AIB1 nuclear receptor coactivator gene in pancreatic carcinomas. Am J Pathol. 1999;154:525–536. doi: 10.1016/S0002-9440(10)65298-4. [DOI] [PMC free article] [PubMed] [Google Scholar]
- Godinho SA, Kwon M, Pellman D. Centrosomes and cancer: how cancer cells divide with too many centrosomes. Cancer Metastasis Rev. 2009;28:85–98. doi: 10.1007/s10555-008-9163-6. [DOI] [PubMed] [Google Scholar]
- Grade M, Hormann P, Becker S, Hummon AB, Wangsa D, Varma S, Simon R, Liersch T, Becker H, Difilippantonio MJ, Ghadimi BM, Ried T. Gene expression profiling reveals a massive, aneuploidy-dependent transcriptional deregulation and distinct differences between lymph node-negative and lymph node-positive colon carcinomas. Cancer Res. 2007;67:41–56. doi: 10.1158/0008-5472.CAN-06-1514. [DOI] [PMC free article] [PubMed] [Google Scholar]
- Grade M, Hummon AB, Camps J, Emons G, Spitzner M, Gaedcke J, Hoermann P, Ebner R, Becker H, Difilippantonio MJ, Ghadimi BM, Beissbarth T, Caplen NJ, Ried T. A genomic strategy for the functional validation of colorectal cancer genes identifies potential therapeutic targets. Int J Cancer. 2011;128:1069–1079. doi: 10.1002/ijc.25453. [DOI] [PMC free article] [PubMed] [Google Scholar]
- Green JE, Hudson T. The promise of genetically engineered mice for cancer prevention studies. Nat Rev Cancer. 2005;5:184–198. doi: 10.1038/nrc1565. [DOI] [PubMed] [Google Scholar]
- Guda K, Upender MB, Belinsky G, Flynn C, Nakanishi M, Marino JN, Ried T, Rosenberg DW. Carcinogen-induced colon tumors in mice are chromosomally stable and are characterized by low-level microsatellite instability. Oncogene. 2004;23:3813–3821. doi: 10.1038/sj.onc.1207489. [DOI] [PubMed] [Google Scholar]
- Hamblin TJ. The TCL1 mouse as a model for chronic lymphocytic leukemia. Leuk Res. 2010;34:135–136. doi: 10.1016/j.leukres.2009.08.004. [DOI] [PubMed] [Google Scholar]
- Hanahan D, Weinberg RA. Hallmarks of cancer: the next generation. Cell. 2011;144:646–674. doi: 10.1016/j.cell.2011.02.013. [DOI] [PubMed] [Google Scholar]
- Hansen K, Khanna C. Spontaneous and genetically engineered animal models; use in preclinical cancer drug development. Eur J Cancer. 2004;40:858–880. doi: 10.1016/j.ejca.2003.11.031. [DOI] [PubMed] [Google Scholar]
- Hathcock KS, Kaech SM, Ahmed R, Hodes RJ. Induction of telomerase activity and maintenance of telomere length in virus-specific effector and memory CD8+ T cells. J Immunol. 2003;170:147–152. doi: 10.4049/jimmunol.170.1.147. [DOI] [PubMed] [Google Scholar]
- Hayflick L, Moorhead PS. The serial cultivation of human diploid cell strains. Exp Cell Res. 1961;25:585–621. doi: 10.1016/0014-4827(61)90192-6. [DOI] [PubMed] [Google Scholar]
- Heim S, Mitelman F. Cancer Cytogenetics: Chromosomal and Molecular Genetic Aberrations of Tumor Cells. 3rd Edition. Hoboken: Wiley & Blackwell; 2009. [Google Scholar]
- Herzog CR, Bodon N, Pittman B, Maronpot RR, Massey TE, Anderson MW, You M, Devereux TR. Carcinogen-specific targeting of chromosome 12 for loss of heterozygosity in mouse lung adenocarcinomas: implications for chromosome instability and tumor progression. Oncogene. 2004;23:3033–3039. doi: 10.1038/sj.onc.1207431. [DOI] [PubMed] [Google Scholar]
- Heselmeyer K, Schrock E, du Manoir S, Blegen H, Shah K, Steinbeck R, Auer G, Ried T. Gain of chromosome 3q defines the transition from severe dysplasia to invasive carcinoma of the uterine cervix. Proc Natl Acad Sci USA. 1996;93:479–484. doi: 10.1073/pnas.93.1.479. [DOI] [PMC free article] [PubMed] [Google Scholar]
- Heselmeyer-Haddad K, Sommerfeld K, White NM, Chaudhri N, Morrison LE, Palanisamy N, Wang ZY, Auer G, Steinberg W, Ried T. Genomic amplification of the human telomerase gene (TERC) in pap smears predicts the development of cervical cancer. Am J Pathol. 2005;166:1229–1238. doi: 10.1016/S0002-9440(10)62341-3. [DOI] [PMC free article] [PubMed] [Google Scholar]
- Hu Y, Sun H, Drake J, Kittrell F, Abba MC, Deng L, Gaddis S, Sahin A, Baggerly K, Medina D, Aldaz CM. From mice to humans: identification of commonly deregulated genes in mammary cancer via comparative SAGE studies. Cancer Res. 2004;64:7748–7755. doi: 10.1158/0008-5472.CAN-04-1827. [DOI] [PMC free article] [PubMed] [Google Scholar]
- Janz S. Myc translocations in B cell and plasma cell neoplasms. DNA Repair (Amst) 2006;5:1213–1224. doi: 10.1016/j.dnarep.2006.05.017. [DOI] [PubMed] [Google Scholar]
- Kalari S, Pfeifer GP. Identification of driver and passenger DNA methylation in cancer by epigenomic analysis. Adv Genet. 2010;70:277–308. doi: 10.1016/B978-0-12-380866-0.60010-1. [DOI] [PMC free article] [PubMed] [Google Scholar]
- Kim NW, Piatyszek MA, Prowse KR, Harley CB, West MD, Ho PL, Coviello GM, Wright WE, Weinrich SL, Shay JW. Specific association of human telomerase activity with immortal cells and cancer. Science. 1994;266:2011–2015. doi: 10.1126/science.7605428. [DOI] [PubMed] [Google Scholar]
- Knutsen T, Gobu V, Knaus R, Padilla-Nash H, Augustus M, Strausberg RL, Kirsch IR, Sirotkin K, Ried T. The interactive online SKY/M-FISH & CGH database and the Entrez cancer chromosomes search database: linkage of chromosomal aberrations with the genome sequence. Genes Chromosomes Cancer. 2005;44:52–64. doi: 10.1002/gcc.20224. [DOI] [PMC free article] [PubMed] [Google Scholar]
- Kodama S, Mori I, Roy K, Yang Z, Suzuki K, Watanabe M. Culture condition-dependent senescence-like growth arrest and immortalization in rodent embryo cells. Radiat Res. 2001;155:254–262. doi: 10.1667/0033-7587(2001)155[0254:ccdslg]2.0.co;2. [DOI] [PubMed] [Google Scholar]
- Kolodner RD, Cleveland DW, Putnam CD. Cancer. Aneuploidy drives a mutator phenotype in cancer. Science. 2011;333:942–943. doi: 10.1126/science.1211154. [DOI] [PMC free article] [PubMed] [Google Scholar]
- Lee LW, Tsao MS, Grisham JW, Smith GJ. Emergence of neoplastic transformants spontaneously or after exposure to N-methyl-N’-nitro-N-nitrosoguanidine in populations of rat liver epithelial cells cultured under selective and nonselective conditions. Am J Pathol. 1989;135:63–71. [PMC free article] [PubMed] [Google Scholar]
- Levan A, Biesele JJ. Role of chromosomes in cancerogenesis, as studied in serial tissue culture of mammalian cells. Ann N Y Acad Sci. 1958;71:1022–1053. doi: 10.1111/j.1749-6632.1958.tb46820.x. [DOI] [PubMed] [Google Scholar]
- Li R, Yerganian G, Duesberg P, Kraemer A, Willer A, Rausch C, Hehlmann R. Aneuploidy correlated 100% with chemical transformation of Chinese hamster cells. Proc Natl Acad Sci USA. 1997;94:14506–14511. doi: 10.1073/pnas.94.26.14506. [DOI] [PMC free article] [PubMed] [Google Scholar]
- Li Z, Luo RT, Mi S, Sun M, Chen P, Bao J, Neilly MB, Jayathilaka N, Johnson DS, Wang L, Lavau C, Zhang Y, Tseng C, Zhang X, Wang J, Yu J, Yang H, Wang SM, Rowley JD, Chen J, Thirman MJ. Consistent deregulation of gene expression between human and murine MLL rearrangement leukemias. Cancer Res. 2009;69:1109–1116. doi: 10.1158/0008-5472.CAN-08-3381. [DOI] [PMC free article] [PubMed] [Google Scholar]
- Liyanage M, Coleman A, du Manoir S, Veldman T, McCormack S, Dickson RB, Barlow C, Wynshaw-Boris A, Janz S, Wienberg J, Ferguson-Smith MA, Schrock E, Ried T. Multicolour spectral karyotyping of mouse chromosomes. Nat Genet. 1996;14:312–315. doi: 10.1038/ng1196-312. [DOI] [PubMed] [Google Scholar]
- Liyanage M, Weaver Z, Barlow C, Coleman A, Pankratz DG, Anderson S, Wynshaw-Boris A, Ried T. Abnormal rearrangement within the alpha/delta T-cell receptor locus in lymphomas from Atm-deficient mice. Blood. 2000;96:1940–1946. [PubMed] [Google Scholar]
- Lomberk GA. Epigenetic silencing of tumor suppressor genes in pancreatic cancer. J Gastrointest Cancer. 2011;42:93–99. doi: 10.1007/s12029-011-9256-2. [DOI] [PubMed] [Google Scholar]
- McNiven MA, Baldassarre M, Buccione R. The role of dynamin in the assembly and function of podosomes and invadopodia. Front Biosci. 2004;9:1944–1953. doi: 10.2741/1348. [DOI] [PubMed] [Google Scholar]
- Meyer N, Penn LZ. Reflecting on 25 years with MYC. Nat Rev Cancer. 2008;8:976–990. doi: 10.1038/nrc2231. [DOI] [PubMed] [Google Scholar]
- Miller DA, Miller OJ. Chromosomes and cancer in the mouse: studies in tumors, established cell lines, and cell hybrids. Adv Cancer Res. 1983;39:153–182. doi: 10.1016/s0065-230x(08)61035-0. [DOI] [PubMed] [Google Scholar]
- Munot K, Bell SM, Lane S, Horgan K, Hanby AM, Speirs V. Pattern of expression of genes linked to epigenetic silencing in human breast cancer. Hum Pathol. 2006;37:989–999. doi: 10.1016/j.humpath.2006.04.013. [DOI] [PubMed] [Google Scholar]
- Murphy DA, Courtneidge SA. The ‘ins’ and ‘outs’ of podosomes and invadopodia: characteristics, formation and function. Nat Rev Mol Cell Biol. 2011;12:413–426. doi: 10.1038/nrm3141. [DOI] [PMC free article] [PubMed] [Google Scholar]
- Nigg EA. Centrosome aberrations: cause or consequence of cancer progression? Nat Rev Cancer. 2002;2:815–825. doi: 10.1038/nrc924. [DOI] [PubMed] [Google Scholar]
- Ogawa K, Osanai M, Obata M, Ishizaki K, Kamiya K. Gain of chromosomes 15 and 19 is frequent in both mouse hepatocellular carcinoma cell lines and primary tumors, but loss of chromosomes 4 and 12 is detected only in the cell lines. Carcinogenesis. 1999;20:2083–2088. doi: 10.1093/carcin/20.11.2083. [DOI] [PubMed] [Google Scholar]
- Padilla-Nash HM, Barenboim-Stapleton L, Difilippantonio MJ, Ried T. Spectral karyotyping analysis of human and mouse chromosomes. Nat Protoc. 2006;1:3129–3142. doi: 10.1038/nprot.2006.358. [DOI] [PMC free article] [PubMed] [Google Scholar]
- Padilla-Nash HM, Heselmeyer-Haddad K, Wangsa D, Zhang H, Ghadimi BM, Macville M, Augustus M, Schrock E, Hilgenfeld E, Ried T. Jumping translocations are common in solid tumor cell lines and result in recurrent fusions of whole chromosome arms. Genes Chromosomes Cancer. 2001;30:349–363. doi: 10.1002/gcc.1101. [DOI] [PubMed] [Google Scholar]
- Payne CM, Crowley-Skillicorn C, Bernstein C, Holubec H, Bernstein H. Molecular and cellular pathways associated with chromosome 1p deletions during colon carcinogenesis. Clin Exp Gastroenterol. 2011;4:75–119. doi: 10.2147/CEG.S17114. [DOI] [PMC free article] [PubMed] [Google Scholar]
- Petiniot LK, Weaver Z, Vacchio M, Shen R, Wangsa D, Barlow C, Eckhaus M, Steinberg SM, Wynshaw-Boris A, Ried T, Hodes RJ. RAG-mediated V(D)J recombination is not essential for tumorigenesis in Atm-deficient mice. Mol Cell Biol. 2002;22:3174–3177. doi: 10.1128/MCB.22.9.3174-3177.2002. [DOI] [PMC free article] [PubMed] [Google Scholar]
- Ponten J. Spontaneous and virus induced transformation in cell culture. Virol Monogr. 1971;8:1–253. doi: 10.1007/978-3-7091-8258-1_1. [DOI] [PubMed] [Google Scholar]
- Popescu NC, Zimonjic DB. Chromosome-mediated alterations of the MYC gene in human cancer. J Cell Mol Med. 2002;6:151–159. doi: 10.1111/j.1582-4934.2002.tb00183.x. [DOI] [PMC free article] [PubMed] [Google Scholar]
- Postma C, Terwischa S, Hermsen MA, van der Sijp JR, Meijer GA. Gain of chromosome 20q is an indicator of poor prognosis in colorectal cancer. Cell Oncol. 2007;29:73–75. doi: 10.1155/2007/137592. [DOI] [PMC free article] [PubMed] [Google Scholar]
- Potter M. The early history of plasma cell tumors in mice, 1954–1976. Adv Cancer Res. 2007;98:17–51. doi: 10.1016/S0065-230X(06)98002-6. [DOI] [PubMed] [Google Scholar]
- Prochownik EV. c-Myc: linking transformation and genomic instability. Curr Mol Med. 2008;8:446–458. doi: 10.2174/156652408785747988. [DOI] [PubMed] [Google Scholar]
- Qi CF, Shin DM, Li Z, Wang H, Feng J, Hartley JW, Fredrickson TN, Kovalchuk AL, Morse HC., 3rd Anaplastic plasmacytomas: relationships to normal memory B cells and plasma cell neoplasms of immunodeficient and autoimmune mice. J Pathol. 2010;221:106–116. doi: 10.1002/path.2692. [DOI] [PMC free article] [PubMed] [Google Scholar]
- Ravin R, Hoeppner DJ, Munno DM, Carmel L, Sullivan J, Levitt DL, Miller JL, Athaide C, Panchision DM, McKay RD. Potency and fate specification in CNS stem cell populations in vitro. Cell Stem Cell. 2008;3:670–680. doi: 10.1016/j.stem.2008.09.012. [DOI] [PubMed] [Google Scholar]
- Ried T. Homage to Theodor Boveri (1862–1915): Boveri’s theory of cancer as a disease of the chromosomes, and the landscape of genomic imbalances in human carcinomas. Environ Mol Mutagen. 2009;50:593–601. doi: 10.1002/em.20526. [DOI] [PubMed] [Google Scholar]
- Ried T, Dorritie K, Weaver Z, Wangsa D, Difilippantonio M, Montagna C. Molecular cytogenetics of mouse models of breast cancer. Breast Disease. 2004;19:59–67. doi: 10.3233/bd-2004-19108. [DOI] [PMC free article] [PubMed] [Google Scholar]
- Ried T, Heselmeyer-Haddad K, Blegen H, Schrock E, Auer G. Genomic changes defining the genesis, progression, and malignancy potential in solid human tumors: a phenotype/genotype correlation. Genes Chromosomes Cancer. 1999;25:195–204. doi: 10.1002/(sici)1098-2264(199907)25:3<195::aid-gcc1>3.0.co;2-8. [DOI] [PubMed] [Google Scholar]
- Ried T, Just KE, Holtgreve-Grez H, du Manoir S, Speicher MR, Schrock E, Latham C, Blegen H, Zetterberg A, Cremer T, Auer G. Comparative genomic hybridization of formalin-fixed, paraffin-embedded breast tumors reveals different patterns of chromosomal gains and losses in fibroadenomas and diploid and aneuploid carcinomas. Cancer Res. 1995;55:5415–5423. [PubMed] [Google Scholar]
- Ried T, Knutzen R, Steinbeck R, Blegen H, Schrock E, Heselmeyer K, du Manoir S, Auer G. Comparative genomic hybridization reveals a specific pattern of chromosomal gains and losses during the genesis of colorectal tumors. Genes Chromosomes Cancer. 1996;15:234–245. doi: 10.1002/(SICI)1098-2264(199604)15:4<234::AID-GCC5>3.0.CO;2-2. [DOI] [PubMed] [Google Scholar]
- Sanford KK. “Spontaneous” neoplastic transformation of cells in vitro: some facts and theories. Natl Cancer Inst Monogr. 1967;26:387–418. [PubMed] [Google Scholar]
- Sanford KK, Evans VJ. A quest for the mechanism of “spontaneous” malignant transformation in culture with associated advances in culture technology. J Natl Cancer Inst. 1982;68:895–913. [PubMed] [Google Scholar]
- Sargent LM, Senft JR, Lowry DT, Jefferson AM, Tyson FL, Malkinson AM, Coleman AE, Reynolds SH. Specific chromosomal aberrations in mouse lung adenocarcinoma cell lines detected by spectral karyotyping: a comparison with human lung adenocarcinoma. Cancer Res. 2002;62:1152–1157. [PubMed] [Google Scholar]
- Schvartzman JM, Sotillo R, Benezra R. Mitotic chromosomal instability and cancer: mouse modelling of the human disease. Nat Rev Cancer. 2010;10:102–115. doi: 10.1038/nrc2781. [DOI] [PMC free article] [PubMed] [Google Scholar]
- Serrano M. The INK4a/ARF locus in murine tumorigenesis. Carcinogenesis. 2000;21:865–869. doi: 10.1093/carcin/21.5.865. [DOI] [PubMed] [Google Scholar]
- Shi Q, King RW. Chromosome nondisjunction yields tetraploid rather than aneuploid cells in human cell lines. Nature. 2005;437:1038–1042. doi: 10.1038/nature03958. [DOI] [PubMed] [Google Scholar]
- Smid M, Hoes M, Sieuwerts AM, Sleijfer S, Zhang Y, Wang Y, Foekens JA, Martens JW. Patterns and incidence of chromosomal instability and their prognostic relevance in breast cancer subtypes. Breast Cancer Res Treat. 2011;128:23–30. doi: 10.1007/s10549-010-1026-5. [DOI] [PubMed] [Google Scholar]
- Stampfer MR, Yaswen P. Culture models of human mammary epithelial cell transformation. J Mammary Gland Biol Neoplasia. 2000;5:365–378. doi: 10.1023/a:1009525827514. [DOI] [PubMed] [Google Scholar]
- Stimpson KM, Song IY, Jauch A, Holtgreve-Grez H, Hayden KE, Bridger JM, Sullivan BA. Telomere disruption results in non-random formation of de novo dicentric chromosomes involving acrocentric human chromosomes. PLoS Genet. 2010;6:e1001061. doi: 10.1371/journal.pgen.1001061. pii. [DOI] [PMC free article] [PubMed] [Google Scholar]
- Telang N, Katdare M. Preclinical in vitro models from genetically engineered mice for breast and colon cancer (Review) Oncol Rep. 2011;25:1195–1201. doi: 10.3892/or.2011.1215. [DOI] [PubMed] [Google Scholar]
- Tlsty TD, Crawford YG, Holst CR, Fordyce CA, Zhang J, McDermott K, Kozakiewicz K, Gauthier ML. Genetic and epigenetic changes in mammary epithelial cells may mimic early events in carcinogenesis. J Mammary Gland Biol Neoplasia. 2004;9:263–274. doi: 10.1023/B:JOMG.0000048773.95897.5f. [DOI] [PubMed] [Google Scholar]
- Todaro GJ, Green H. Quantitative studies of the growth of mouse embryo cells in culture and their development into established lines. J Cell Biol. 1963;17:299–313. doi: 10.1083/jcb.17.2.299. [DOI] [PMC free article] [PubMed] [Google Scholar]
- Tzatsos A, Pfau R, Kampranis SC, Tsichlis PN. Ndy1/KDM2B immortalizes mouse embryonic fibroblasts by repressing the Ink4a/Arf locus. Proc Natl Acad Sci USA. 2009;106:2641–2646. doi: 10.1073/pnas.0813139106. [DOI] [PMC free article] [PubMed] [Google Scholar]
- Upender MB, Habermann JK, McShane LM, Korn EL, Barrett JC, Difilippantonio MJ, Ried T. Chromosome transfer induced aneuploidy results in complex dysregulation of the cellular transcriptome in immortalized and cancer cells. Cancer Res. 2004;64:6941–6949. doi: 10.1158/0008-5472.CAN-04-0474. [DOI] [PMC free article] [PubMed] [Google Scholar]
- Vega FM, Fruhwirth G, Ng T, Ridley AJ. RhoA and RhoC have distinct roles in migration and invasion by acting through different targets. J Cell Biol. 2011;193:655–665. doi: 10.1083/jcb.201011038. [DOI] [PMC free article] [PubMed] [Google Scholar]
- Vitale I, Galluzzi L, Senovilla L, Criollo A, Jemaa M, Castedo M, Kroemer G. Illicit survival of cancer cells during polyploidization and depolyploidization. Cell Death Differ. 2010;18:1403–1413. doi: 10.1038/cdd.2010.145. [DOI] [PMC free article] [PubMed] [Google Scholar]
- Vogelstein B, Fearon ER, Hamilton SR, Kern SE, Preisinger AC, Leppert M, Nakamura Y, White R, Smits AM, Bos JL. Genetic alterations during colorectal-tumor development. N Engl J Med. 1988;319:525–532. doi: 10.1056/NEJM198809013190901. [DOI] [PubMed] [Google Scholar]
- Wang J, Xie LY, Allan S, Beach D, Hannon GJ. Myc activates telomerase. Genes Dev. 1998;12:1769–1774. doi: 10.1101/gad.12.12.1769. [DOI] [PMC free article] [PubMed] [Google Scholar]
- Zimonjic DB, Ullmannova-Benson V, Factor VM, Thorgeirsson SS, Popescu NC. Recurrent and nonrandom DNA copy number and chromosome alterations in Myc transgenic mouse model for hepatocellular carcinogenesis: implications for human disease. Cancer Genet Cytogenet. 2009;191:17–26. doi: 10.1016/j.cancergencyto.2008.12.014. [DOI] [PMC free article] [PubMed] [Google Scholar]
Associated Data
This section collects any data citations, data availability statements, or supplementary materials included in this article.