

Abstract
Purpose
The significance of ocular or corneal aberrations may be subject to misinterpretation whenever eyes with different pupil sizes or the application of different Zernike expansion orders are compared. A method is shown that uses simple mathematical interpolation techniques based on normal data to rapidly determine the clinical significance of aberrations, without concern for pupil and expansion order.
Methods
Corneal topography (Tomey, Inc.; Nagoya, Japan) from 30 normal corneas was collected and the corneal wavefront error analyzed by Zernike polynomial decomposition into specific aberration types for pupil diameters of 3, 5, 7, and 10 mm and Zernike expansion orders of 6, 8, 10 and 12. Using this 4×4 matrix of pupil sizes and fitting orders, best-fitting 3-dimensional functions were determined for the mean and standard deviation of the RMS error for specific aberrations. The functions were encoded into software to determine the significance of data acquired from non-normal cases.
Results
The best-fitting functions for 6 types of aberrations were determined: defocus, astigmatism, prism, coma, spherical aberration, and all higher-order aberrations. A clinical screening method of color-coding the significance of aberrations in normal, postoperative LASIK, and keratoconus cases having different pupil sizes and different expansion orders is demonstrated.
Conclusions
A method to calibrate wavefront aberrometry devices by using a standard sample of normal cases was devised. This method could be potentially useful in clinical studies involving patients with uncontrolled pupil sizes or in studies that compare data from aberrometers that use different Zernike fitting-order algorithms.
Keyword List: corneal topography, Zernike polynomial, wavefront error, ocular aberrations, corneal aberrations
Introduction
Wavefront error analysis for the evaluation of ocular function is now routinely applied clinically in ophthalmology and optometry and for research purposes in vision science. It is particularly useful in the postoperative evaluation of laser vision correction procedures where the asymmetry, decentration, and surface irregularity from laser ablation complications can be well described by aberration terms such as astigmatism, coma, spherical aberration, and others.1–6 Likewise, wavefront error analysis can be applied preoperatively in refractive surgery and used for guiding wavefront error-correction procedures, particularly in those eyes that are naturally aberrated or due to iatrogenic laser procedure complications.7–10 Wavefront error has also been useful for diagnostic purposes, such as in predicting visual performance,11–13 screening for corneal ectasia,14–17 or grading the severity of optical defects of the cornea or complications with intraocular lenses (IOLs).18–20
The standard method of describing wavefront error is the Zernike polynomial, which is used to decompose the complex and irregular surface shape of the wavefront error into a series of mathematically simpler components.21, 22 These components are expressed in terms of their radial and angular frequencies, and describe specific aberration components such as astigmatism, coma, trefoil, and spherical aberration. Aberrations that are rotationally symmetric such as defocus and spherical aberration are expressed by a single component, but aberrations that are not rotationally symmetric such as astigmatism and coma require 2 separate components, a vertical and an oblique component that are combined to form a specific aberration type. The relative amount of each term is indicated by the value of a numerical coefficient as a Root-Mean-Square (RMS) error of the surface height measured typically in micrometers (μm).
Wavefront error analysis can be performed for the optics of the whole eye or for the optics of individual ocular components or surfaces, such as the anterior corneal surface, which has particular relevance in refractive surgery, diagnosis of diseases, and evaluation of visual acuity.22 The total number of Zernike fitting terms that are extracted during wavefront decomposition is often user-determined and maybe varied from case to case. Highly complex surfaces will typically require more terms for achieving a complete and accurate fit to the total original wavefront error, while simple, smooth surfaces such as those found with normal conditions will require fewer Zernike terms to achieve a good fit.23–24 Whenever more terms are included to improve the quality of the fit, it is counter-balanced by the additional time required to calculate the terms. The optimum number of Zernike terms needed to adequately describe a complex wavefront error and the relevance of using Zernike polynomials for fitting as compared to other methods such as Fourier methods has been discussed previously in the literature.23–25
Clinicians often want to judge the severity (i.e., relative magnitude)of aberrations of a test eye by comparing the wavefront error to the error of a normal eye. 26–34 This judgment is based on the assumption that each aberration is normally distributed about a mean RMS error value for a normative sample, and that outlier results (i.e. > 2 standard deviations from the mean) are indicative of abnormal amounts of aberration. Unless the pupil diameter and Zernike fitting order are identical, comparisons between different cases may be invalid. Larger pupils tend to be associated with larger amounts of higher order aberrations, and a comparison of wavefront error for different pupil sizes may indicate a significant difference, even for the same eye. It has also been shown that using fewer Zernike orders may lead to an incomplete assessment of the aberrations that are present, which becomes a significant problem when individual aberrations are added together under the category of higher-order aberrations (HOA). 24
Some aberrometry applications may display the RMS error of various aberrations in comparison to those of a normal eye, but it may be unclear to the user whether the normal reference standard has been corrected for the effects of pupil size and Zernike fitting order. In addition, these displays may not indicate the 2 standard deviation threshold above the mean of the normative database aberrations, thus making it challenging to evaluate the true significance of the error in the test case. The determination of wavefront error significance is often made worse by the use of wavefront error maps that utilize adjustable color scales, which de-emphasize the true significance of the error.35 Absolute color scale standards for wavefront error maps help in evaluating and comparing cases, but color mapping standards do not address the problem associated with different pupil diameters or Zernike orders.
A method of standardizing or calibrating wavefront error measurement systems to a normative database is needed to allow clinical and experimental test case results to be fairly compared to the results of atypical normal eye under the exact same conditions of pupil size and fitting orders. Furthermore, the standard should be applicable to individual aberration types, and should be adjustable so that it conforms to the conditions dictated by the physiological state of the eye to be tested. A normative reference that accounts for pupil size and Zernike order would allow the user to fully realize the clinical significance of specific aberrations, rather than assuming that the pupil size and the size of the Zernike expansion series do not matter.
In this study, we developed a simple and reliable method in which aberrometry systems can be calibrated so that users can compare test eyes to the typical normative condition, irrespective of the physiological pupil size under the test condition or how many Zernike orders were used in the expansion series. The calibration of a given aberrometry system takes the form of two equations that describe the mean RMS error value of a particular aberration and its associated standard deviation as a function of both pupil diameter and Zernike fitting orders. These equations are derived through 3-dimensional curve fitting to experimentally acquired data points. Once derived, these equations can then be used to interpolate the normal mean and standard deviation for direct comparison to the test eye. This method allows the wavefront-based aberrations of any test eye to be assessed with more statistical rigor for significant differences relative to a normal mean, and to allow the number of standard deviations from the normal mean to be used as an indicator of both statistical and clinical significance, as well as the severity of the aberration.
Methods
This study conformed to the tenets of the Declaration of Helsinki concerning human research subjects. All data used in this study were acquired with informed patient consent and Institutional Review Board (IRB) approval. Corneal topography from 30 normal cases was acquired with a Tomey TMS videokeratographer (Tomey, Inc.; Nagoya, Japan). These cases were randomly selected from historical medical records of the LSU Eye Center Department of Ophthalmology clinic. The classification of normal was originally made by the attending physician, and the topography maps were further reviewed by three vision researchers with corneal topography interpretation experience. All mires were complete, no previous contact lens wear had been recorded in the medical history, and all corneas had less than 0.5 diopters (D) of astigmatism by simulated keratometry. A few examples of non-normal corneal topography were included in this study in order to illustrate the statistical significance of specific types of aberrations when compared to the average normal cornea. These abnormal example cases were not used in the creation of the mean and standard deviation aberration equations for the normative database.
Each topography map was analyzed with VolPro software (Sarver & Associates; Carbondale, IL) to extract wavefront error data. Specifically, the Zernike decomposition routine in VolPro was used in which the analyzed pupil diameter (i.e., the optical zone) in millimeters (mm) was systematically varied to 3, 5, 7, or 10 mm, while the extracted number of Zernike orders also was varied to 6, 8, 10 or 12 orders. This provided a 4×4 matrix of 16 data points for the collection of wavefront error data. At each combination of pupil diameter and Zernike fitting order, the wavefront error in micrometers (μm) of RMS error was recorded for the following 6 types of corneal aberration: 1st order prism, 2nd order defocus, 2nd order astigmatism, 3rd order coma, 4th order spherical aberration, and all combined higher-order aberrations(HOA) at the 3rd order and above. Data were recorded into a SigmaStat spreadsheet (Systat Software, Inc.; San Jose, CA) for each of the 30 corneas used in the study. The mean and standard deviation of the mean at each of the 16 matrix points were then calculated for each of the 6 aberration types.
The mean wavefront error data at each of the matrix points were recorded onto new spreadsheets for each of the 6 aberrations. The standard deviation of the mean wavefront error of each aberration type was also recorded in this fashion. Each spreadsheet was then imported into TableCurve 3D (Systat Software, Inc.) and processed for the best-fitting surface equation that fit all 16 points of the matrix. Ranking of the best-fit equation in TableCurve 3D can be accomplished by multiple factors including the F-statistic, the coefficient of determination r2 value, the degrees of freedom adjusted r2 value, or the Standard Error of the Fit value. We chose to first rank the best fitting equations using the coefficient of determination r2 value and then visually inspect the graphical representations of the surfaces starting with the best fit equation. Deviation of each data point of the 16-point matrix from the fitted surface was indicated by the color of its graphical symbol, which changed when the data point varied in unit steps of standard deviation from the fitted surface. Data points that were<1 SD were displayed in green; <2 SD in yellow; <3 SD in red; and < 4 SD in pink. In some instances, the top-ranked best-fit equations were clearly inappropriate because while they fit most of the 16 points well, the curves were discontinuous and therefore would not fit other interpolated or extrapolated points. In particular, we sought equations that provided a continuous, monotonic fit to points along the pupil diameter axis with a peak at the largest potential pupil diameter (10 mm). However, there were no constraints placed on the equation for the Zernike fitting order axis being monotonic, because the data indicated that some aberrations would not be fit well with a monotonic function at very large pupil diameters.
Results
The final selections for best-fitting equations for the mean value of the wavefront error for each of the aberrations and the corresponding surfaces are shown in the 6 graphs of Figure 1. The equations, fitting statistics, and the coefficients of these equations are provided with each graph. In all cases, RMS error increases with pupil diameter(or optical zone)as expected. The amount of increase varied with respect to the aberration term being considered. The relationship of RMS error to Zernike fitting orders is generally linear and essentially constant for a physiologically normal pupil diameter, but tends to become non-linear with very large optical zones (> 8 mm pupils). For example, the 3-D surface fit for corneal astigmatism, spherical aberration, and prism is not monotonic for 10-mm pupil diameters, with the functions showing a minimum in the range of 7 to 8 Zernike orders and peaking at 12 orders. The loss of monotonicity with respect to the Zernike fitting orders may be explained in part by the statistical noise of fitting a 3-D function.
Figure 1.

Mean value of six different aberrations as a function of pupil size and Zernike order number. Aberrations selected for analysis include defocus (top left); prism (top right); 2nd order astigmatism (center left); 3rd order coma (center right); 4th order spherical aberration (lower left); and all higher order aberrations above the 2nd order (lower right). Note the use of a floating Z-axis scale in all graphs.
The corresponding surface-fit equations for the standard deviation of the mean value of wavefront error for each of the aberrations are shown in Figure 2. The reader is cautioned to consider both the mean and the standard deviation 3-D functions together when interpreting the results. For the combined HOAs (the lower right-hand graph of Figure 1), there does appear to be a dramatic increase in RMS error when the number of Zernike fitting orders is increased from 6 to 12 orders with large optical zones. Large optical zones would include distortions of naturally occurring peripheral corneal shape change (such as nasal flattening and spherical aberration)as well as possibility of increased measurement noise from topographic height measurement errors.
Figure 2.

Standard deviation of the mean value of six different aberrations as a function of pupil size and Zernike order number. Aberrations selected for analysis include defocus (top left); prism (top right); 2nd order astigmatism (center left); 3rd order coma (center right); 4th order spherical aberration (lower left); and all higher order aberrations above the 2nd order (lower right). Note the use of a floating Z-axis scale in all graphs.
Discussion
The dependence of wavefront error and retinal image quality on pupil size is well-known. Walsh, Charman, and Howland described monochromatic aberrations in relation to pupil diameters in the normal human eye, as did Liang and Williams.26 –28 In addition, the effects of pupil size on refractive error has been described for contact lenses,29 radial keratotomy,30, 31 photorefractive keratectomy,32 laser in-situ keratomileusis,33 and intraocular lenses.34 One of the most significant limitations of wavefront error analysis has been in directly comparing investigational outcomes between studies conducted with different pupil diameters. How does one determine the wavefront error significance between a study conducted with 3 mm pupils and a study conducted with 6 mm pupils? More importantly, how do either of these results compare to the typical normal eye?
In this study, we investigated the establishment of a standardized method by which the corneal wavefront error of any novel test case can be compared to the average error of normal corneas, even if the pupil diameter and Zernike term number for the test case were not rigorously controlled. Specifically, we used a sample of clinically defined normal corneas to derive 3-D equations that describe both mean wavefront error and the standard deviation of the mean error for various aberrations (coma, spherical aberration, etc.) under different pupil size and Zernike fitting order conditions. These equations can be used to interpolate normal wavefront error significance for any pupil diameter and Zernike fitting order, and thus provide an immediate reference standard to which unknown test cases can be compared.
In general, pupil diameters less than 3 mm for normals asymptotically approach an error minimum as shown in Figure 1, whereas the theoretical upper pupil diameter is considered to be 10 mm and exhibits significant amounts of aberration and a correspondingly larger variance. The range of Zernike orders in our method was 6 to 10 orders, which corresponds with our typical use of aberrometry in the research laboratory. Optionally, fewer or more orders can be used to derive the equations; however, including more orders may make it more difficult to fit an equation to the data.
Our study results indicate that the Zernike order does not playa significant role in the calculation of aberrations of normal corneas when using physiological pupil diameters (e.g., 4-mm pupils), but becomes increasingly significant when larger optical zones are evaluated by comparison. This result confirms our findings made in an earlier study where we examined the goodness-of-prediction of Zernike fitting orders for various corneal conditions including normals.23 Highly aberrated eyes, such as corneas with keratoconus, can exhibit significant wavefront error even when small pupils are considered, and therefore the mean and standard deviation of the normal cornea’s wavefront error for small pupils were included in the study in order to provide a statistical reference of normality for the entire range of pupil diameters.
The equations derived in this study are specifically for use with VolPro analysis software and Tomey TMS topography; however, the approach we used can be applied to any wavefront aberrometry system, provided a normative database of reasonable size is used. Furthermore, the method is not limited only to corneal wavefront aberration analysis, but can be applied as well to whole eye aberrometry. Different wavefront analysis systems are expected to have unique aspects to the way data are handled that necessitates that each system be calibrated according to the normative database acquired by that system. For example, Hartmann-Shack-based wavefront sensors have a different data point sampling resolution than a system based on slit skiascopy. There may also be systematic differences which are based on numerical precision or the specific algorithm used with each system.
The only prerequisite for generating a normative database for deriving the equations is that a sufficiently large sample of normal eyes is used to define the normal mean and standard deviation across all potential pupil sizes and the number of orders expected for the Zernike expansion series. The calculation for the minimum sample size is well-documented in statistics textbooks and usually available on statistical software applications. In general, one must estimate the variance of the population and specify the acceptable margin of error (typically a probability level of p=0.05) in order to obtain the estimate of the n-value. In our study, we set the desired power of a one-tailed Student’s t-test to be 0.95 and assumed that the expected standard deviation would equal the minimum difference in means, which generated a minimum sample size of at least 28. We chose to round up the sample size to 30 cases in the normative database.
After determining the equations for the mean and standard deviations of the mean for each of the 6 types of aberrations we studied, we then encoded the equations into a software application where the input of pupil size, Zernike fitting orders applied, and the Zernike coefficient values of the aberrations of the test eye are all done with keyboard entry. In commercial applications, these values can all be accessed internally within the wavefront measurement device and fed automatically to the encoded equations in order to produce the statistical comparison to the normal mean and standard deviation. How this result is displayed can be modified by each wavefront device manufacturer to best fit the needs of their clients. In our laboratory, we designed a simple graphical display in the shape of a hexagon that is generated automatically by the aforementioned application. The center of the hexagon displays the pupil size and Zernike fitting order number, while 6 petal-shaped regions show the RMS error of each specific aberration. Each petal automatically changes color from green to yellow to orange to red to show the user how many standard deviations from the normal mean the test result value is for each aberration. This color-coded graphical method allows rapid visual assessment of wavefront error, particularly when the hexagon labeling is associated with a wavefront error map where it provides a permanent record of the statistical as well as clinical significance of the optical errors of that particular eye or cornea.
No matter what the optical zone diameter is, great care should be exercised when comparing RMS error data among cases where the pupil diameter differs by as little as one-half millimeter. This can be better understood when actually applying the equations to analyze the significance of the aberration for several different corneal examples as shown in Figures 3 through 6. In these figures, we have computed the RMS error for the 6 different aberrations and then added the hexagonal color-coded graphical display that indicates the number of Zernike orders in the fit, the pupil diameter in millimeters, and the RMS error value of each of the aberration types. As expected, an example from a normal cornea shown in Figure 3 has all green labeling which indicated that all aberrations were < 2 SD from the mean. In Figure 4, a post-LASIK case is shown with slightly elevated defocus and a highly significant amount of spherical aberration present (>4 SD). This spherical aberration is also indicated by the orange and yellow colors of the Smolek-Klyce absolute color scale for wavefront errors. The spherical aberration result of Figure 4 should be contrasted with that of Figure 5, which shows a case of mild keratoconus. Notice that the spherical aberration of the keratoconus cornea is 0.68 and labeled as green, even though the spherical aberration of the post-LASIK case was 0.70 and labeled in red. The difference between these cases is that the optical zone of the keratoconus case was 7 mm and the optical zone of the post-LASIK case was 6 mm. Both cases were analyzed with 12 Zernike fitting orders. Even though the RMS error has changed by only 0.02 μm and the pupil diameter by only 1 mm, this difference is sufficient to create a large statistically significant difference. Comparing these 2 cases illustrates that the clinical and statistical significance of the RMS error value cannot be determined unless the pupil diameter is taken into consideration.
Figure 3.
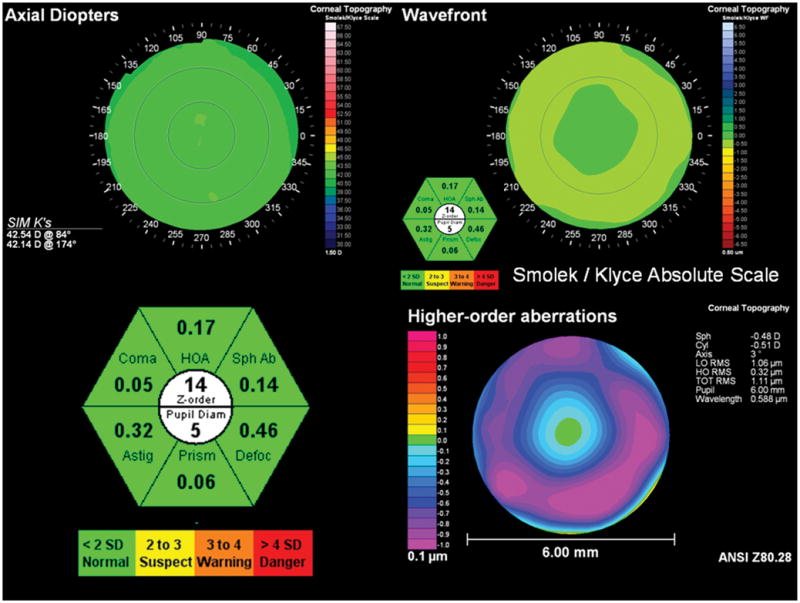
Example of how the calibrated aberration analysis method can be used to indicate a normal corneal wavefront. Upper left: corneal topography map; upper right: corneal wavefront in the Smolek-Klyce absolute scale; lower right: corneal wavefront in the ANSI scale; lower left: close-up view of the hexagonal warning label system described in the text. All aberrations are less than 2 standard deviations from the normal mean as specified during calibration. Note that the ANSI color mapping method uses a floating numerical scale that overemphasizes non-significant amounts of spherical aberration.
Figure 6.

Example of how the calibrated aberration analysis method can be used with a mild central keratoconus case. Upper left: corneal topography map; upper right: corneal wavefront in the Smolek-Klyce absolute scale; lower right: corneal wavefront in the ANSI scale; lower left: close-up view of the hexagonal warning label system described in the text.
Figure 4.

Example of how the calibrated aberration analysis method can be used with a post-LASIK case. Upper left: corneal topography map; upper right: corneal wavefront in the Smolek-Klyce absolute scale; lower right: corneal wavefront in the ANSI scale; lower left: close-up view of the hexagonal warning label system described in the text. The defocus value is between 2 and 3 standard deviations above normal, while the value for spherical aberration is 4 standard deviations or more above normal.
Figure 5.

Example of how the calibrated aberration analysis method can be used with a mild keratoconus case. Upper left: corneal topography map; upper right: corneal wavefront in the Smolek-Klyce absolute scale; lower right: corneal wavefront in the ANSI scale; lower left: close-up view of the hexagonal warning label system described in the text.
Figure 6 illustrates a case of mild central keratoconus that is notable in that coma aberration is not significantly different from normal with a 7-mm pupil diameter and the use of 8 Zernike orders. The appearance of coma is also not visually distinct in either of the two wavefront mapping methods (ANSI or the Smolek-Klyce absolute scale) because the ectasia is well-centered on the cornea. The higher-order aberration value (HOA) is between 2 and 3 standard deviations above normal, which is likely to be due to trefoil aberration, while the prism value is between 3 and 4 standard deviations above normal. Both HOA and prism indicate a significant difference from a normal cornea. First-order prism, which is often neglected on aberrometry systems, can be helpful for screening abnormal corneal wavefronts as shown in both Figures 5 and 6.
Conclusions
In this study we have shown a simple but effective method for calibrating wavefront analysis systems to display aberration results with improved statistical and clinical significance when compared to the mean aberrations of the normal eye. This technique can be further expanded to include more aberrations types than the ones shown here. The method can also incorporate additional pupil and Zernike order data points in order to refine the 3-D surface used to fit the equations, if more precision is needed for some devices or applications. We designed our method to specifically evaluate corneal topography wavefront error, but the approach can be applied to aberrometers that evaluate the optics of the entire eye.
We have also shown in this study how a standardized color-coded labeling of the aberration results based on a statistical comparison to a normative database can provide the clinical user with a rapid assessment of the aberration state. A well-designed labeling approach to indicate the significance of individual aberrations eliminates confusion, while providing the user with both quantitative and qualitative information about the statistical and clinical significance of the results relative to a normal eye. The current study describes a method by which the mean and standard deviation of various aberrations for a normative database were evaluated for different amounts of pupil diameter and Zernike fitting orders, and the results used to generate 3-D equations that describe the normal mean and standard deviation of wavefront error. These equations can be incorporated into aberrometry analysis software to statistically evaluate any new test case, no matter what pupil size or fitting order was used in acquiring the data. Examples of clinical application include the assessment of post-LASIK corneas for statistically significant indications of coma, which would indicate the presence of ectasia, or the evaluation of dry eye patients for significant levels of higher order aberrations compared to the normative reference. The method would also be useful for keratoconus screening and severity assessment.
Acknowledgments
This study was supported by National Eye Institute (NEI) research grant R01EY014162 from the National Institutes of Health (NIH), Bethesda, Maryland, USA, by an unrestricted departmental grant from Research to Prevent Blindness, New York, New York, USA, and by the Research Enhancement Fund of the Louisiana State University School of Medicine.
Footnotes
Financial Statement
The author has no commercial or financial interest in the products or methods described in this manuscript.
References
- 1.Mrochen M, Kaemmerer M, Seiler T. Clinical results of wavefront-guided laser in-situ keratomileusis 3 months after surgery. J Cataract Refract Surg. 2001;27:201–207. doi: 10.1016/s0886-3350(00)00827-0. [DOI] [PubMed] [Google Scholar]
- 2.Marcos S, Barbero S, Llorente L, Merayo-Lloves J. Optical response to LASIK surgery for myopia from total and corneal aberration measurements. Invest Ophthalmol Vis Sci. 2001;42:3349–3356. [PubMed] [Google Scholar]
- 3.Zhou C, Chai X, Yuan L, He Y, Jin M, Ren Q. Corneal higher-order aberrations after customized aspheric ablation and conventional ablation for myopic correction. Curr Eye Res. 2007;32:431–438. doi: 10.1080/02713680701329321. [DOI] [PubMed] [Google Scholar]
- 4.Scharma M, Wachler BS, Chan CC. Higher order aberrations and relative risk of symptoms after LASIK. J Refract Surg. 2007;23:252–256. doi: 10.3928/1081-597X-20070301-07. [DOI] [PubMed] [Google Scholar]
- 5.de Castro LE, Sandoval HP, Bartholomew LR, Vroman DT, Solomon KD. High-order aberrations and preoperative associated factors. Acta Ophthalmologica Scan. 2007;85:106–110. doi: 10.1111/j.1600-0420.2006.00757.x. [DOI] [PubMed] [Google Scholar]
- 6.Chung SH, Lee IS, Lee YG, Lee HK, Kim EK, Yoon G, Seo KY. Comparison of higher-order aberrations after wavefront-guided laser in situ keratomileusis and laser assisted subepithelial keratectomy. J Cataract Refract Surg. 2006;32:779–784. doi: 10.1016/j.jcrs.2005.10.033. [DOI] [PubMed] [Google Scholar]
- 7.Ambrosio R, Jardim D, Netto MV, Wilson SE. Management of unsuccessful LASIK Surgery. Comprehensive Ophthalmology Update. 2007;8:125–141. [PubMed] [Google Scholar]
- 8.McCormick GJ, Porter J, Cox IG, MacRae S. Higher-order aberrations in eyes with irregular corneas after laser refractive surgery. Ophthalmology. 2005;112:1699–1709. doi: 10.1016/j.ophtha.2005.04.022. [DOI] [PubMed] [Google Scholar]
- 9.Alio J, Galai A, Montalban R, Pinero D. Corneal wavefront-guided LASIK retreatments for correction of highly aberrated corneas following refractive surgery. J Refract Surg. 2007;23:760–773. doi: 10.3928/1081-597X-20071001-05. [DOI] [PubMed] [Google Scholar]
- 10.Randleman JB, Thompson KP, Staver PR. Wavefront aberrations from corneal ectasia after laser in situ keratomileusis demonstrated by InterWave aberrometry. J Refract Surg. 2004;20:170–175. doi: 10.3928/1081-597X-20040301-13. [DOI] [PubMed] [Google Scholar]
- 11.Chen L, Singer B, Guirao A, Porter J, Williams DR. Image metrics for predicting subjective image quality. Optometry Vis Sci. 2005;82:358–369. doi: 10.1097/01.OPX.0000162647.80768.7F. [DOI] [PubMed] [Google Scholar]
- 12.Applegate RA, Hilmantel G, Howland HC, Tu EY, Starck T, Zayac EJ. Corneal first surface optical aberrations and visual performance. J Refract Surg. 2000;16:507–514. doi: 10.3928/1081-597X-20000901-04. [DOI] [PubMed] [Google Scholar]
- 13.Watson AB, Ahumada AJ. Predicting visual acuity from wavefront aberrations. J Vision. 2008;8:17.1–19. doi: 10.1167/8.4.17. [DOI] [PubMed] [Google Scholar]
- 14.Schwiegerling J, Greivenkamp JE. Using corneal height maps and polynomial decomposition to determine corneal aberrations. Optometry Vis Sci. 1997;74:906–916. doi: 10.1097/00006324-199711000-00024. [DOI] [PubMed] [Google Scholar]
- 15.Marsack J, Milner T, Rylander G, Leach N, Roorda A. Applying wavefront sensors and corneal topography to keratoconus. Biomed Sci Instrum. 2002;38:471–476. [PubMed] [Google Scholar]
- 16.Jafri B, Li X, Yang H, Rabinowitz YS. Higher order wavefront aberrations and topography in early and suspected keratoconus. J Refract Surg. 2007;23:774–781. doi: 10.3928/1081-597X-20071001-06. [DOI] [PubMed] [Google Scholar]
- 17.Tabernero J, Klyce SD, Sarver EJ, Artal P. Functional optical zone of the cornea. Invest Ophthalmol Vis Sci. 2007;48:1053–1060. doi: 10.1167/iovs.06-0867. [DOI] [PubMed] [Google Scholar]
- 18.Lombardo M, Lombardo G, Serrao S. Long-term optical quality of the photoablated cornea. J Opt Soc Am A. 2007;24:588–596. doi: 10.1364/josaa.24.000588. [DOI] [PubMed] [Google Scholar]
- 19.Tabernero J, Piers P, Benito A, Redondo M, Artal P. Predicting the optical performance of eyes implanted with IOLs to correct spherical aberration. Invest Ophthalmol Vis Sci. 2006;47:4651–4658. doi: 10.1167/iovs.06-0444. [DOI] [PubMed] [Google Scholar]
- 20.Marcos S, Barbero S, Jimenez-Alfaro I. Optical quality and depth-of-field of eyes implanted with spherical and aspheric intraocular lenses. J Refract Surg. 2005;21:223–235. doi: 10.3928/1081-597X-20050501-05. [DOI] [PubMed] [Google Scholar]
- 21.Liang J, Grimm B, Goetz S, Bille JF. Objective measurement of wave aberrations of the human eye with the use of a Hartmann-Shack wave-front sensor. J Opt Soc Am A. 1994;11:1949–1957. doi: 10.1364/josaa.11.001949. [DOI] [PubMed] [Google Scholar]
- 22.Schweigerling J, Grievenkamp JE, Miller JM. Representation of videokeratoscopic height data with Zernike polynomials. J Opt Soc A. 1995;12:2105–2113. doi: 10.1364/josaa.12.002105. [DOI] [PubMed] [Google Scholar]
- 23.Smolek MK, Klyce SD. Goodness-of-prediction of Zernike polynomial fitting to corneal surfaces. J Cataract Refract Surg. 2005;31:2350–2355. doi: 10.1016/j.jcrs.2005.05.025. [DOI] [PubMed] [Google Scholar]
- 24.Smolek MK, Klyce SD. Zernike polynomial fitting fails to represent all visually significant corneal aberrations. Invest Ophthalmol Vis Sci. 2003;44:4676–4681. doi: 10.1167/iovs.03-0190. [DOI] [PubMed] [Google Scholar]
- 25.Wang L, Chernyak D, Yeh D, Koch DD. Fitting behaviors of Fourier transform and Zernike polynomials. J Cataract Refract Surg. 2007;33:999–1004. doi: 10.1016/j.jcrs.2007.03.017. [DOI] [PubMed] [Google Scholar]
- 26.Walsh G, Charman WN, Howland HC. Objective technique for the determination of monochromatic aberrations of the human eye. J Opt Soc Am A Opt Img Sci Vis. 1984;1:987–992. doi: 10.1364/josaa.1.000987. [DOI] [PubMed] [Google Scholar]
- 27.Walsh G, Charman WN. Measurement of the axial wavefront aberration of the human eye. Ophthal Physiol Opt. 1985;5:23–31. [PubMed] [Google Scholar]
- 28.Liang J, Williams DR. Aberrations and retinal image quality of the normal human eye. J Opt Soc Am A Opt Img Sci Vis. 1997;14:2873–2883. doi: 10.1364/josaa.14.002873. [DOI] [PubMed] [Google Scholar]
- 29.El-Nashar NF, Larke JR. Wave front aberration in the hydrogel lens-wearing eye. Am J Optom Physiol Opt. 1986;63:409–412. doi: 10.1097/00006324-198606000-00003. [DOI] [PubMed] [Google Scholar]
- 30.Holladay JT, Lynn MJ, Waring GO, 3rd, Gemmill M, Keehn GC, Fielding B. The relationship of visual acuity, refractive error, and pupil size after radial keratotomy. Arch Ophthalmol. 1991;109:70–76. doi: 10.1001/archopht.1991.01080010072036. [DOI] [PubMed] [Google Scholar]
- 31.Applegate RA, Howland HC, Sharp RP, Cottingham AJ, Yee RW. Corneal aberrations and visual performance after radial keratotomy. J Refract Surg. 1998;14:397–407. doi: 10.3928/1081-597X-19980701-05. [DOI] [PubMed] [Google Scholar]
- 32.Martinez CE, Applegate RA, Klyce SD, McDonald MB, Medina JP, Howland HC. Effect of pupillary dilation on corneal optical aberrations after photorefractive keratectomy. Arch Ophthalmol. 1998;116:1053–1062. doi: 10.1001/archopht.116.8.1053. [DOI] [PubMed] [Google Scholar]
- 33.Miller JM, Anwaruddin R, Staub J, Schwiegerling J. Higher order aberrations in normal, dilated, intraocular lens, and laser in situ keratomileusis corneas. J Refract Surg. 2002;18:S579–583. doi: 10.3928/1081-597X-20020901-16. [DOI] [PubMed] [Google Scholar]
- 34.Queiros A, Villa-Collar C, Gonzalez-Meijome JM, Jorge J, Gutierrez AR. Am J Ophthalmol. 2010;150:97–109. doi: 10.1016/j.ajo.2010.02.003. [DOI] [PubMed] [Google Scholar]
- 35.Smolek MK, Klyce SD. Absolute color scale for improved diagnostics in corneal wavefront error mapping. Ophthalmology. 2007;114:2022–2030. doi: 10.1016/j.ophtha.2007.03.051. [DOI] [PubMed] [Google Scholar]