Abstract
A CW interstitial diffuse optical tomography has been developed to characterize the in-vivo optical properties of prostate gland during photodynamic therapy. The spatial distributions of light fluence rate can be described by the diffusion equation. Optical properties of the prostate are reconstructed by solving the inverse problem with an adjoint method. The 3D reconstructed in-vivo optical properties for a human prostate is illustrated and compared with the results generated by a well-established point-by-point method. Moreover, the calculated fluence rate using the reconstructed optical properties matches the measured data.
1. Introduction
The therapeutic efficacy of photodynamic therapy (PDT) significantly depends on the quantification of light fluence rate distribution, sensitizer concentration, and oxygen transport and consumption during treatment. With the implementation of interstitial diffuse optical tomography (iDOT), the optical properties of tissue can be reconstructed spatially using an adjoint inverse algorithm [1]. Accurately characterizing the abnormal optical properties of tumor and thereby rigorously estimate patient-specific light fluence rate distribution is an important subject for PDT light dosimetry.
Prostate cancer is the most common cancer expected to occur in men and is also the second leading cause of cancer death in year 2008 among American male population [2]. In addition, there is a need for fast and economical diagnostic tool. Recently, there is an increasing interest in the field of continuous wave (CW)-DOT. Axelsson et al. [3] present promising results of reconstructing spatial distributions of photosensitizer in human prostate using iDOT, which is expected to facilitate the use of light-photosensitizer dosimetry model in a PDT clinical environment. A new globally accelerated reconstruction algorithm for CW-DOT is developed by Pantong et al. [4]. It has been demonstrated as a highly efficient and stable method for a large data set obtained from an organ with particular shape, such as prostate.
An iDOT system with multiple light diffusers and isotropic detectors has been developed in our group to characterize the optical properties of prostate gland during PDT [5, 6]. Several catheters paralleled with each other are inserted into prostate under ultrasound guidance. Inside the catheters, there are light point sources and detectors. For each source position, the isotropic detectors scan and record the light fluence rate distribution in the direction along with the catheter axis. For our CW-iDOT system, the spatial distributions of light fluence rate can be described by the steady state diffusion equation. Optical properties of the prostate gland are reconstructed by solving the inverse problem with the use of a CW diffusion model.
To exam our methodology, a mathematical phantom including anomalies with known optical properties is examined. Furthermore, the 3D reconstructed in-vivo optical properties for a human prostate is illustrated and compared with the results generated by an established point-by-point method [6]. Moreover, we show the calculated fluence rates match the measured data using the reconstructed optical properties.
2. Methods
2.1 Description of the patient being studied
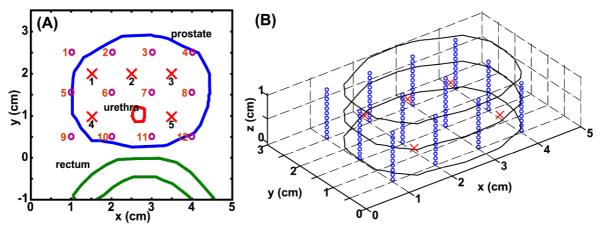
A Phase I clinical trial of motexafin lutetium (MLu)-mediated PDT in patients with locally recurrent prostate carcinoma was initiated at the University of Pennsylvania. The protocol was approved by the Cancer Therapy Evaluation Program of the National Cancer Institute, and the detail of the trial was published elsewhere [6]. Briefly, two weeks prior to the scheduled treatment a transrectal ultrasound (TRUS) was performed for treatment planning. An urologist drew the target prostate volume on each slice of the ultrasound images and these images were spaced 0.5 cm apart. A built-in template with a 0.5-cm grid projected the locations of light sources relative to the prostate. The interstitial-PDT treatment was conducted using cylindrical diffusing fibers (CDF). A treatment plan was then prepared to determine the location and length of the CDFs with active length 1 – 5 cm to cover the full volume of the prostate. The treatment light sources were spaced one centimeter apart and the light power per unit length was less than or equal to 150 mW/cm. Prior to PDT, point light source (Pioneer optics company, Bloomfield, CT) for optical properties measurement were inserted into patient prostate at the same locations of CDF. For one source position, there were four isotropic detectors (Rare Earth Medical Inc, West Yarmouth, MA) surrounding it (Fig. 1 (A)). These detectors are the same ones used to perform light fluence rate measurements during PDT. For the study patient shown in this work (#16), five source and 12 detector locations were used. A 15-W 732 nm diode laser (model 730, Diomed, Ltd., Cambridge, United Kingdom) was chosen as the light source.
Fig. 1.
(A) 2D orientation of prostate, urethra, and rectum contours for one cut of the patient prostate. Cross and circle are the locations of point sources and isotropic detectors, respectively. The actual sources and detectors are numbered. (B) Extension of the 2D case (A) in a 3D geometry: The prostate contour in (A) is extended 1 cm in z-axis direction. Circles are the detector locations used in the 3D reconstruction calculation.
2.2 Reconstruction procedure-DOT method
In the first step, prostate contour is obtained from TRUS image modality. The contours of prostate, urethra, and rectum for a certain z-plane are shown in Fig. 1(A). Circle and cross symbols in Fig. 1(A) represent the locations of detectors and sources, respectively. For the sources at a certain z location, our detectors scan along the z-axis and record light fluence rate. The locations where the isotropic detectors recorded data are set equal to the virtual detector positions assigned in the subsequent reconstruction calculation. Figure 1(B) shows the virtual detector and source orientation in a 3D geometry. The separation between each detector along the z-axis is 1 mm. The 2D prostate contour for a particular z plane (Fig. 1(A)) is expanded in z-axis direction to construct a 3D structure (Fig. 1(B)) used in the calculation. This 3D geometry is processed in MATLAB 7.5 (MathWorks, Inc., Natick, MA, United States) and COMSOL 3.5a (COMSOL AB, SE-111 40, Stockholm, Sweden) program to generate mesh for the subsequent finite element method (FEM) calculation. It is worthwhile to mention that for different source locations at z-axis, the above procedure will be repeated to generate the corresponding 3D geometry.
Our goal is to recover the optical properties (absorption and reduced scattering coefficients, μa and μs’) at each finite element mesh node using the fluence rate data φm measured interstitially. Unlike our prior studies [7], we concentrate on the use of NIRFAST [1, 8] for solving the inverse problem. The NIRFAST [1] has been modified to more accurately calculate light fluence rate per source strength for our CW reconstruction purpose [8]. The fluence rate data in forward calculation (φc) is generated using FEM and based on the steady state light diffusion equation,
| (1) |
with a set of initial values of μa and diffusion coefficient D. In Eq. (1), S is the source term. Next, the Jacobian matrix J in CW scheme is established, which has the form
| (2) |
, where M and N are the number of measured data and total mesh nodes, respectively. In our modification, absolute fluence rate per source strength, without renormalization, is used throughout the algorithm to enable separation of μa and μs’.
In the next step, the projection error is calculated as the summation of the absolute difference between natural logarithm of φm and φc. If the stopping criteria are achieved, we record the reconstructed optical properties and terminate the program. Otherwise, the optical properties will be updated and iteratively used in the above calculation procedures. The stopping criteria are either the change of projection error less than 2 % or negative optical properties value generated during the iterative calculation. The method described in this section is named as DOT method.
2.3 Point-by-point method
The optimization method used to extract optical properties based on the measurement of fluence rate at several distances from point source has been published elsewhere [6, 9]. The accuracy of this method has been established to be 8 % for μa and 18 % for μs’ [9]. Briefly, with the diffusion approximation, the light fluence rate φat a distance r from a point source with source strength, S, can be expressed as
| (3) |
where μeff is effective attenuation coefficient and . For a point source measurement with a given source strength, μa and μs’ can be determined separately by the slope of the spatial decay of light fluence rate and the magnitude of fluence rate near the source. If sufficient number of measurements are made in a prostate, a modified differential evolution algorithm developed by our group [9] is able to fit the measured data using Eq. (3). A map of optical properties can therefore be made by fitting each source detector pair data, individually. This method is named as point-by-point method in this study.
3. Results and discussion
3.1 Reconstruction using 3D Mathematical phantom
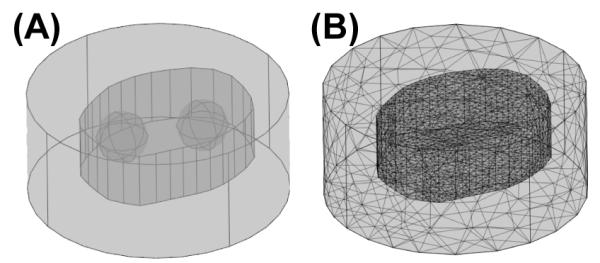
A 3D mathematical phantom is used to verify our CW reconstruction algorithm developed for the iDOT system. To simulate the clinical environment, we place 5 point sources and 12 detectors within or close to the prostate (Fig. 1(A)). After the prostate contour has been extended to 1 cm in the z-axis direction as described in Sec. 2.2, the number of detectors used in the calculation is 132, and total simulated data point is 660. Fig. 2(A) shows two anomalies, spheres of radius 0.5 cm, and an outer medium are placed inside and surrounding the prostate. The prostate contour is the same as shown in Fig. 1(A), which is extracted from a patient. The outer boundary is used to avoid an artificial effect, a sudden drop of fluence rate on the prostate boundary if there is no outer medium existed [10]. The optical properties of the background are set as μs’ = 14 (cm−1) and μa = 0.3 (cm−1) for the prostate and the surrounding medium, based on a published result [6]. For the left anomaly, the μs’ and μa are 14 (cm−1) and 0.6 (cm−1), respectively, and for the right anomaly, μs’ is 28 (cm−1) and μa is 0.3 (cm−1).
Fig. 2.

(A) Schematics of the mathematical phantom for one slide of prostate contour. Two anomalies are inserted into the prostate, and an extra outer medium is applied to enclose the prostate. (B) Corresponding COMSOL-generated mesh used in the forward calculation for the reconstruction procedures.
The simulated data with 1 % noise is calculated on a finer mesh (not shown) using the known optical properties. To reduce the number of unknowns, a coarse mesh is used for the forward calculation in the reconstruction procedures (Fig. 2(B)). To further reduce the reconstructed unknowns during the optical properties updated procedure, a separated second reconstruction basis, pixel basis 12×12×12 provided by NIRFAST is chosen [1].
The reconstructed results for the 3D mathematical phantom are shown in Fig. 3. The source and the center of anomalies are located at 0.5 cm at z-axis. Fig. 3 shows the known and reconstructed distribution of μa. and μs’, where the locations of anomalies are correctly reconstructed. The maximum reconstructed μ.a and μs’ are 0.5 and 27 (1/cm) vs. the true optical properties 0.6 and 28 (1/cm) (Fig. 3 (A1) vs. (B1) and Fig. 3 (A2) vs. (B2)). A cross talk between two anomalies is observed in Fig. 3 (B1) and (B2).
Fig. 3.
Known distributions for (A1) μ.a and (A2) μs’ at z = 0.5 cm and the corresponding reconstructed result for the distribution of (B1) μ.a and (B2) μs’ at the same plane for the 3D mathematical phantom.
3.2 Clinical data reconstruction
For a prostate patient, we have conducted a series of in-vivo measurement for 6 source locations located at z-axis, z = 0.5 to 3 cm. The source and detector orientation follow the same scenario shown in Fig. 1(A). However, due to the experimental complexity, only the detectors close to the source recorded data. For example, for source 1 (Fig. 1(A)), only detector 2, 5 and 6 obtained the corresponding fluence rate profile. Therefore, for each plane, total measured data point is ranging from 149 to 160, compared to 660 used in the 3D phantom calculation. For DOT method, approximate 2600 to 4400 nodes and 14500 to 25000 tetrahedral elements are used in the forward model to simulate the fluence rate distribution for different cases while a coarser pixel base mesh (12×12×12) are used in the inverse model to calculate μa and μs’. The total computational time for one cut is around 30 mins using a desktop with 2.4 GHz processor and 2 GB of RAM.
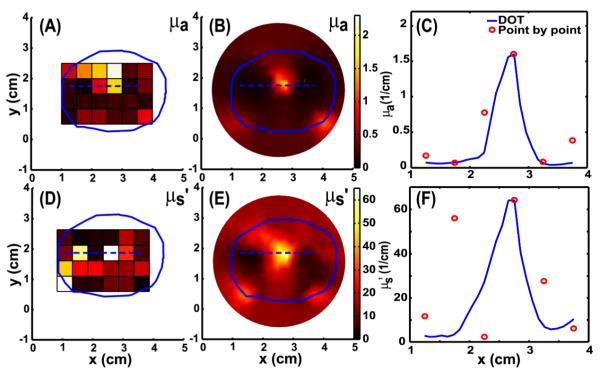
Figure 4 shows the comparison between the point-by-point and DOT method for the patient prostate at z = 0.5 cm. Significant heterogeneity for μa and μs’ are observed in images obtained by both methods (Fig. 4). The hot spot locations of optical properties reconstructed by DOT method is consistent with the results calculated by point-by-point method (Fig. 4(A) vs. (B) and Fig. 4(D) vs. (E)). The central hot-spot may be due to the bleeding within patient prostate. The bleeding is independently verified by examining the catheter after the treatment is completed. Based on our clinical experience of treating 12 patients, it is concluded that if the measured light fluence rate per source strength at 5 mm is less than 0.1 mW/(cm2mW), then bleeding occurs. However, we are not sure if the hot spot for scattering is also related to bleeding because of the extremely low fluence rate signal detected in these regions. The inverse algorithm, therefore, reconstructed high μa and μs’ over there regions.
Fig. 4.
Results of in vivo map of μa using point-by-point (A) and DOT (B) methods for patient prostate at z = 0.5 cm plane. (C) The corresponding comparison of μa between the two methods along x-axis (blue dash line in (A) and (B)) at z = 0.5 and y = 1.75 cm. The solid line and circle represent the results of the DOT and point-by-point method, respectively. (D), (E) and (F) are the corresponding plots for μS’.
We also compared these two methods along x-axis at z = 0.5 cm and y = 1.75 cm, blue dash lines in Fig. 4, for μa and μs’ (Fig. 4(C) and (F)). The spatial-resolved profiles of μa are consistent for both methods (Fig. 4 (C)). The comparison for μs’ shows large inconsistency at × = 1.75 cm, but the other points are matched acceptably well (Fig. 4 (F)).
Figure 5A shows the measured (plus) and calculated (circle) fluence rate for each source and detector pair vs. virtual detector indices assigned for DOT method. The computed fluence rate is based on the reconstructed optical properties from Fig. 4(B) and (E) at z = 0.5 cm plane. We notice that for detector indices from 23 to 33 and 78 to 83, there is a large discrepancy. This inconsistency corresponds to the data of source 1 and detector 6 pair, and source 3 and detector 7 pair (Fig. 5(B)) and is attributed to the difference of source and detector separations between reconstruction assumption and the actual measurement condition [9]. Template with a fixed 0.5-cm grid is used for the position of sources and detectors during the reconstruction. The actual separation between the detector and point source can be different from this assumption. To test this argument, we assign extra detector 13 and 14 to replace the detector 6 and 7 with respect to source 1 and 3 (Fig. 5(B)). Detector 13 and 14 are 0.3 and 0.4 cm closer to the source than the detector 6 and 7. The results of recalculated fluence rate are shown in Fig. 5(C). Interestingly, we notice changing the separation distance not only improve the calculated fluence rate for a certain source and detector pair, but also induce a global optimization for other pairs (Fig. 5(C)).
Fig. 5.
(A) Forward calculated fluence rate using the reconstructed optical properties from Fig. 4 (B) and (E) for z = 0.5 cm plane, compared to the measured data at different virtual detector (scanning position) locations. (B) Two extra detectors 13 and 14 (green triangle) replacing the detector 6 and 7 with respect to source 1 and 3. Detector 13 and 14 are 0.3 and 0.4 cm closer to the source than the detector 6 and 7. (C) is the comparison result after correcting the source and detector separation.
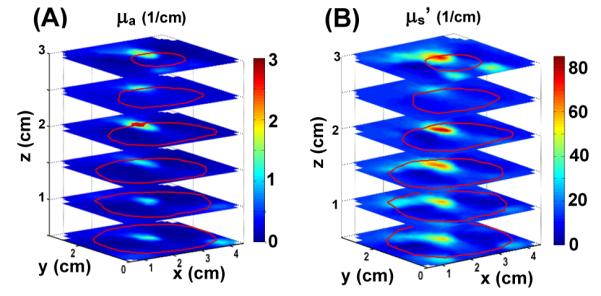
We have produced volumetric distributions of μa and μs’ for the in-vivo patient prostate (Fig. 6 (A) and (B)), respectively. This hot spot is observed through prostate (Fig. 6 (A) and (B)). For either μa or μs’ map, the heterogeneity is observed to penetrate several planes for the same patient. This result emphasizes the importance to explore the patient-specific optical properties for PDT treatment.
Fig. 6.

Volumetric distributions of (A) μa and (B) μs’, respectively, for an in-vivo prostate. The prostate contours (red lines) at different z planes are shown in both cases.
Generally, homogenous optical properties are assumed in PDT treatment planning. The fluence rate will be largely affected by the heterogeneous optical properties (Figs. 4 and 6), as described in detail elsewhere [11]. The corresponding optimization algorithm to adjust light source parameters (i.e. strengths, lengths, and locations), based on the optical properties heterogeneity, is therefore necessary to facilitate the current PDT light dosimetry system [12]. One good strategy for taking into account the inhomogeneity in optical properties without prior knowledge is to perform in-situ light dosimetry to measure the actual light fluence rate at area of interest to ensure sufficient light delivery time to achieve uniform total light fluence.
4. Conclusion
A 3D reconstruction model has been developed, which is able to recover volumetric μa and μs’ of human prostate using the clinical data obtained from a CW-iDOT system. This model maximizes the usage of our scanning data; for each source location, we are able to use the measured data at, below and above the source plan. Moreover, the calculated fluence rate can match measured data using correct source and detector separation. In the other word, correctly predicting light fluence rate distribution within patient prostate based on the reconstructed optical properties can be a significant improvement to the prostate-PDT light dosimetry.
The ongoing direction in our group is to improve the accuracy of the reconstructed optical properties and anomalies location, we propose to implement a regional base reconstruction algorithm [13, 14] with prior information into the current routine. Other image modalities (e.g. MR) will be used to locate tumor within patient prostate, and the regional base routine will enforce a homogeneous optical property within the same zone regime.
Acknowledgments
The authors would like to thank Dr. Hamid Dehghani for helping with NIRFAST programming and both Dr. Brian Pogue and Dehghani for providing the NIRFAST software. We thank Dr. Xiaodong Zhou for helpful discussions. This work is supported by grants from National Institute of Health (NIH) R01 CA 109456 and P01 CA87971.
Footnotes
OCIS codes: (170.3880) Medical and biological imaging; (170.5180) Photodynamic therapy; (170.7230) Urology; 170.6960 (Tomography)
References and links
- 1.Dehgani H, Eames ME, Yalavarthy PK, Davis SC, Srinivasan S, Carpenter CM, Pogue BW, Paulsen KD. “Near infrared optical tomogrophy using NIRFAST: Algorithm for numerical model and image reconstruction,”. Commun. Numer. Methods Eng. 2008;25:711–732. doi: 10.1002/cnm.1162. [DOI] [PMC free article] [PubMed] [Google Scholar]
- 2.Jemal A, Siegel R, Ward E, Hao Y, Xu J, Murray T, Thun MJ. “Cancer statistics, 2008,”. Ca-Cancer J. Clin. 2008;58:71–96. doi: 10.3322/CA.2007.0010. [DOI] [PubMed] [Google Scholar]
- 3.Axelsson J, Swartling J, Andersson-Engels S. “In vivo photosensitizer tomography inside the human prostate,”. Opt. Lett. 2009;34:232–234. doi: 10.1364/ol.34.000232. [DOI] [PubMed] [Google Scholar]
- 4.Pantong N, Su J, Shan H, Klibanov MV, Liu H. “Globally accelerated reconstruction algorithm for diffusion tomography with continuous-wave source in an arbitrary convex shape domain,”. J. Opt. Soc. Am. A. 2009;26:456, 472. doi: 10.1364/josaa.26.000456. [DOI] [PubMed] [Google Scholar]
- 5.Zhu TC, Finlay JC, Hahn SM. “Determination of the distribution of light, optical properties, drug concentration, and tissue oxygenation in-vivo in human prostate during motexafin lutetium-mediated photodynamic therapy,”. J. Photochem. Photobiol. B. 2005;79:231–241. doi: 10.1016/j.jphotobiol.2004.09.013. [DOI] [PMC free article] [PubMed] [Google Scholar]
- 6.Zhu TC, Dimofte A, Finlay JC, Stripp D, Busch T, Miles J, Whittington R, Malkowicz SB, Tochner Z, Glatstein E, Hahn SM. “Optical properties of human prostate at 732 nm measured in mediated photodynamic therapy,”. Photochem. Photobiol. 2005;81:96–105. doi: 10.1562/2004-06-25-RA-216. [DOI] [PMC free article] [PubMed] [Google Scholar]
- 7.Zhou X, Zhu TC. “Interstitial diffuse optical tomography using an adjoint model with linear sources,”. Proc. SPIE. 2008;6846:68450C. doi: 10.1117/12.762340. [DOI] [PMC free article] [PubMed] [Google Scholar]
- 8.Wang KK-H, Zhu TC. “Reconstruction of optical properties using a diffusion model for interestitial diffuse optical tomography,”. Proc. SPIE. 2009;7164:71640P. doi: 10.1117/12.809065. [DOI] [PMC free article] [PubMed] [Google Scholar]
- 9.Dimofte A, Finlay JC, Zhu TC. “A method for determination of the absorption and scattering properties interstitially in turbid media,”. Phys. Med. Biol. 2005;50:2291–2311. doi: 10.1088/0031-9155/50/10/008. [DOI] [PMC free article] [PubMed] [Google Scholar]
- 10.Li J, Zhu TC, Finlay JC. “Study of light fluence rate distribution in photodynamic therapy using finite-element method,”. Proc. SPIE. 2006;6139:61390M. doi: 10.1117/12.646251. [DOI] [PMC free article] [PubMed] [Google Scholar]
- 11.Li J, Zhu TC. “Determination of in vivo light fluence distribution in a heterogeneous prostate during photodynamic therapy,”. Phys. Med. Biol. 2008;53:2103–2114. doi: 10.1088/0031-9155/53/8/007. [DOI] [PMC free article] [PubMed] [Google Scholar]
- 12.Li J, Altschuler MD, Hahn SM, Zhu TC. “Optimization of light source parameters in the photodynamic therapy of heterogeneous prostate,”. Phys. Med. Biol. 2008;53:4107–4121. doi: 10.1088/0031-9155/53/15/007. [DOI] [PMC free article] [PubMed] [Google Scholar]
- 13.Jiang Z, Piao D, Xu G, Ritchey JW, Holyoak GR, Bartels KE, Bunting CF, Slobodov G, Kransinski S. “Trans-rectal ultrasound-coupled near-infrared optical tomography of the prostate, Part II: Experimental demonstration,”. Opt. Express. 2008;16:17505–17520. doi: 10.1364/oe.16.017505. [DOI] [PubMed] [Google Scholar]
- 14.Xu G, Piao D, Musgrove CH, Bunting CF, Dehgani H. “Trans-rectal ultrasound-coupled near-infrared optical tomography of the prostate, Part I: Simulation,”. Opt. Express. 2008;16:17484–17504. doi: 10.1364/oe.16.017484. [DOI] [PubMed] [Google Scholar]


