Abstract
Historically, rate constants were determined in vitro and it was unknown whether they were valid for in vivo biological processes. Here, we bridge this gap by measuring binding dynamics between a pair of proteins in living HeLa cells. Binding of a β-lactamase to its protein inhibitor was initiated by microinjection and monitored by Förster resonance energy transfer. Association rate constants for the wild-type and an electrostatically optimized mutant were only 25% and 50% lower than in vitro values, whereas no change in the rate constant was observed for a slower binding mutant. These changes are much smaller than might be anticipated considering the high macromolecular crowding within the cell. Single-cell analyses of association rate constants and fluorescence recovery after photobleaching reveals a naturally occurring variation in cell density, which is translated to an up to a twofold effect on binding rate constants. The data show that for this model protein interaction the intracellular environment had only a small effect on the association kinetics, justifying the extrapolation of in vitro data to processes in the cell.
Keywords: protein–protein interactions, single-cell measurements, electrostatic
Biochemical reaction parameters such as enzymatic activity, binding rates, and affinities are traditionally studied in controlled in vitro solutions. However, biochemistry takes place in vivo, in a complex and crowded environment. To bridge this gap, in vitro studies were conducted in the presence of high concentrations of synthetic polymers or proteins as crowding agents (1). In parallel, computer simulations modeled crowding in a simplified manner or in molecular details (2, 3). Although much has been learned from these two approaches, the actual cellular environment is too complex to be properly simulated by any of them. Thus, quantitative measurements inside living cells are needed (4).
Recently, a number of techniques have been developed in order to study protein folding and stability in cells (5). Kinase stability in eukaryotic cells was found to be slightly higher, and unfolding was approximately twofold slower than in vitro (6, 7). Conversely, the cytoplasm of Escherichia coli was shown to destabilize the IgG binding domain of protein L (8). With respect to protein binding, it was shown that the affinity of Cdc42 to various proteins increases in eukaryotic cells (9), with a 10-fold difference between cell types (10). The dynamics of α2A-adrenergic receptors binding to G proteins was monitored by Förster resonance energy transfer (FRET)-based assay, but no direct comparison to in vitro rate constants was made (11).
Although fast and specific protein–protein interactions are essential to virtually every aspect of cellular function (12), no kinetic binding measurements of freely diffusing proteins in the cytoplasm of a living cell were performed to date. Using FRET-labeled proteins and microinjection, we quantified the association rate constants of TEM1 β-lactamase binding to its protein inhibitor β-lactamase inhibitor protein (BLIP) in the cytoplasm of HeLa cells. Analyzing variations in crowding between cells, and using different protein mutants with altered binding rate constants, we detected only subtle differences in binding kinetics between in vitro and in vivo conditions. These findings suggest that, despite the complexity of the cellular milieu, values obtained from in vitro studies can be directly applied to in vivo environments.
Results
FRET as a Probe for TEM1-BLIP Binding.
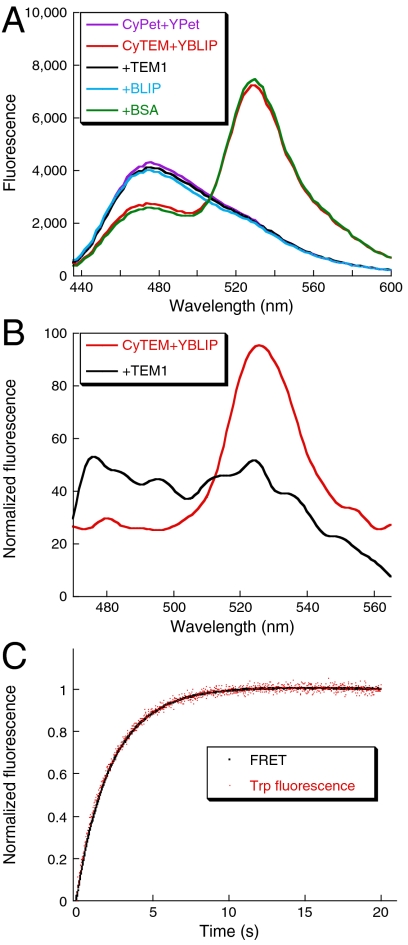
In order to perform binding measurements inside cells, we fused the prokaryotic proteins TEM1 β-lactamase and its inhibitor BLIP to the fluorescent proteins CyPet and YPet (13), (named CyTEM and YBLIP, respectively—Fig. S1). The in vitro binding affinity and rate constants for the fused complex were similar to those of TEM1 and BLIP (Table S1). The interaction between CyTEM and YBLIP produced a specific FRET signal in vitro (Fig. 1A) and in living cells (Fig. 1B). FRET is sensitive to the distance between the donor and the acceptor fluorophores, but not to direct binding. To validate that the accumulation of the FRET signal is a direct measure of complex formation, we followed the reaction in vitro by recording the accumulation of FRET and the change in Trp fluorescence (which probes binding—Fig. 1C). The exact overlay of the data demonstrates that FRET serves as a probe for specific CyTEM-YBLIP interaction.
Fig. 1.
FRET as a probe for TEM1-BLIP binding. (A) In vitro emission spectra of 1 μM CyTEM mixed with 1 μM YBLIP (red) shows reduced CyPet emission (peak at 476 nm) and elevated YPet emission (peak at 530 nm) compared to a mixture of CyPet and YPet (purple) at the same concentration. Competition with 10 μM TEM1 (black) or BLIP (cyan) abolishes FRET, whereas 10 μM BSA (green) had no effect on the interaction. (B) In-cell emission spectra of CyTEM mixed with YBLIP. A mixture of 2.5 μM from each protein was loaded to a capillary and injected into cells (red). Addition of 50 μM TEM1 to the mixture abolishes FRET (black). Spectra were normalized by the protein concentration in the cell. (C) In vitro binding curves of 0.1 μM CyTEM with 0.5 μM YBLIP probed either by FRET (black, 435-nm excitation, 515-nm cutoff emission) or by Tryptophan fluorescence (red, 280-nm excitation, 320-nm cutoff emission).
Kinetic Measurements in Living Cells.
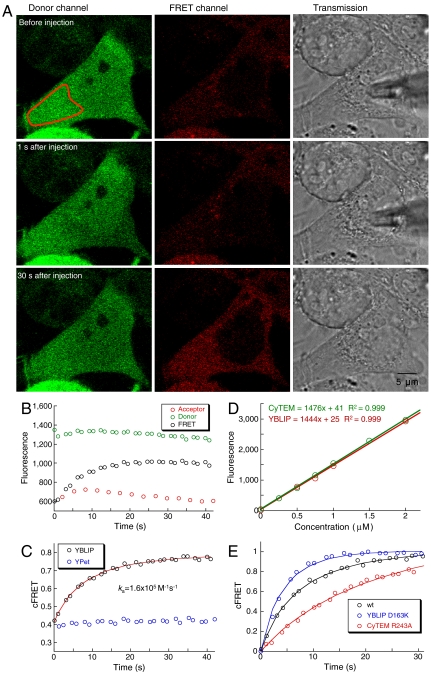
CyTEM was uniformly expressed in HeLa cells by transient transfection. At time zero, YBLIP was microinjected into the cytoplasm and the cell was viewed by a confocal microscope simultaneously at the donor channel (excitation 405 nm, emission 460–505 nm) and the FRET channel (excitation 405 nm, emission 531–631 nm; Fig. 2, Fig. S2, and Movies S1 and S2). YBLIP intensity was monitored at the acceptor channel (excitation 515 nm, emission 531–631 nm, Fig. 2B and Fig. S2), showing that within 3 s after injection it was homogenously distributed throughout the cytoplasm. The association process reached equilibrium within 1 min, during which bleaching of YBLIP and CyTEM was minor (Fig. S3).
Fig. 2.
Association rate measurements in living cells. (A) Donor, FRET, and transmission channels are shown before and at 1 and 30 s after YBLIP injection. The reduction in the donor channel intensity 1 s after injection results from a twofold dilution of the cytoplasm. The complete time sequence of this cell is shown in Fig. S2 and in Movie S1. (B) Mean fluorescence intensities of the region indicated in red (A, Top Left) imaged by the donor, FRET, and acceptor channels. (C) Corrected FRET was calculated from the data shown in B using Eq. 2, and was subjected to numerical analysis (red). Protein concentrations of 0.9 μM CyTEM and 0.5 μM YBLIP were determined from the calibration curve shown in D, yielding an association rate constant of 1.6 × 10⁵ M-1 s-1. Corrected FRET of a control cell expressing 0.6 μM CyTEM and injected with 1 μM YPet is shown in blue. (D) Calibration curve of YBLIP (red) and CyTEM (green) fluorescence using purified proteins diluted into cell extract. (E) Normalized binding curves of WT and mutant complexes. CyTEM and YBLIP concentrations were 0.9 and 0.5 μM for the WT complex, 0.55 μM of both proteins for the fast mutant (YBLIPD163K), and 1 μM of both proteins for the slow mutant (CyTEMR243A; see also Movie S2). Solid lines are the fits produced by Pro-K II.
In each cell, a specific region of the cytoplasm was selected for analysis (Fig. 2A). In general, injection of YBLIP into cells expressing CyTEM resulted in a gradual decrease in the donor channel and a gradual increase in the FRET channel (Fig. 2B). The FRET signal was corrected for direct acceptor excitation and residual donor emission (see Methods). The corrected FRET signal, cFRET, for a single cell is shown in Fig. 2 C Injection of YPet (not fused to BLIP) did not produce any change in cFRET, indicating that the FRET signal is specific for CyTEM-YBLIP binding.
Determination of Protein Concentrations in Cells.
The change in cFRET over time yields an observed rate, which is a measure of how quickly the interaction reaches equilibrium. Observed rates are expressed in units of inverse time and are determined by three factors: the association rate constant, the dissociation rate constant, and the protein concentration. Therefore, to determine the association rate constant, one needs to know the intracellular protein concentration. Protein concentrations were determined from a calibration curve (Fig. 2D), where we measured the fluorescence intensities of purified CyTEM and YBLIP proteins diluted in HeLa cytoplasmic cell extract, using the confocal microscope setup employed for living cell measurements (14).
YBLIP fluorescence intensity in the cell was monitored by the acceptor channel (Fig. 2B and Fig. S2). In contrast, CyTEM fluorescence intensity monitored by the donor channel is not necessarily an accurate measure of CyTEM concentration, because the interaction between CyTEM and YBLIP may result in decreased donor intensity. To test this possible bias, we measured the fluorescence intensity in the donor channel in cells injected with YBLIP and compared it to cells injected with YPet (that does not interact with CyTEM). Injections cause a dilution of the cell cytoplasm, as evident from the reduction in CyTEM intensity immediately after injection (Fig. 2A, Top and Middle, donor channel). However, the average reduction in the donor channel was the same whether YBLIP or YPet were injected. This analysis established that the fluorescence intensity of CyTEM immediately after YBLIP injection was not affected by the evolving interaction between the proteins, and can thus serve as a good indication for CyTEM concentrations in cells.
Determination of Association Rate Constants.
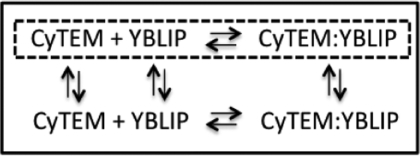
Each cell contains a unique combination of CyTEM and YBLIP concentrations because of differences in transient gene expression and variability in the amount of microinjected protein. Therefore, basic analytical models (such as pseudo-first- or second-order kinetics) cannot be used to determine association rate constants. For this reason, we resorted to numeric simulations (see Methods) to extract association rate constants, based on the time-dependent FRET increase and the measured protein concentrations at time zero. A general model for this process is described in Scheme 1, where the box represents the cell, and the dotted box is the selected region for analysis inside the cell.
Scheme 1.
The analyzed region is not a closed system, so materials can freely flow between this region and the rest of the cell (indicated by the vertical arrows). To avoid the complications arising from a change in total CyTEM and YBLIP concentrations during the time of reaction, we analyzed only cells where YBLIP intensity (probed by the acceptor channel) showed less than 20% change during the reaction time. The data were fitted to both a reversible and an irreversible two-state-association model. No significant difference was found between the two models, thus association rate constants were determined with the irreversible model: CyTEM + YBLIP → CyTEM∶YBLIP.
Association Rate Constants of CyTEM-YBLIP in Living Cells.
Association rates between three variants of TEM1-BLIP were monitored: TEMWT-BLIPWT, TEMWT-BLIPD163K, and TEMR243A-BLIPWT. In vitro studies showed that the D163K mutant improves electrostatic steering between the proteins, thus enhancing the association rate constant (15). Conversely, R243A decreases electrostatic steering and reduces the association rate constant (16).
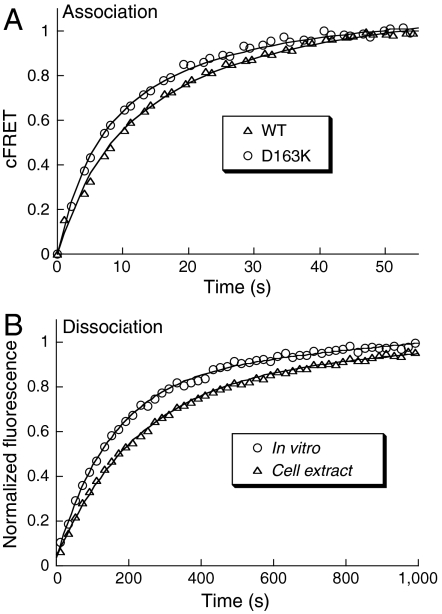
Initially, we measured binding rates in cell extracts (Fig. 3). Association rate constants were determined using the same setup as for the in-cell measurements, resulting in similar values to those determined in vitro (Table 1). For dissociation rate measurements, equal concentration of YBLIP and unlabeled TEM1 were mixed. Dissociation was initiated by the addition of an excess of CyTEM and monitored by the increase in FRET. The dissociation rate constants in cell extracts and in vitro were similar: 4.3 × 10⁻³ ± 3.2 × 10⁻⁴ s-1 and 7.0 × 10⁻³ ± 1.5 × 10⁻⁴ s-1, respectively (Fig. 3B).
Fig. 3.
Binding rate measurements in HeLa cell extract. (A) Normalized association curves for the WT (0.5 μM of each protein) and the D163K mutant (0.2 μM of each protein) complexes. Solid lines are the fits produced by Pro-K II. (B) Normalized dissociation curves for the TEM1E104A-YBLIPWT complex in vitro and in cell extract. Solid lines are single exponent fits.
Table 1.
Association rate constants of CyTEM-YBLIP in vitro, in cell extract, and in cells
| Interacting pair | Association rate constant, × 105 M-1 s-1 | |||
| CyTEM |
YBLIP |
In vitro |
Cell extract |
In cell |
| WT | WT | 3.0 ± 0.4 | 2.3 ± 0.4 | 1.9 ± 0.1 |
| WT | D163K | 9.9 ± 0.4 | 6.2 ± 0.4 | 4.7 ± 0.3 |
| R243A | WT | 0.54 ± 0.1 | 0.52 ± 0.04 | |
Values are reported as mean ± SEM. Number of cells analyzed for in cell rates is 25 for WT, 36 for D163K, and 20 for R243A.
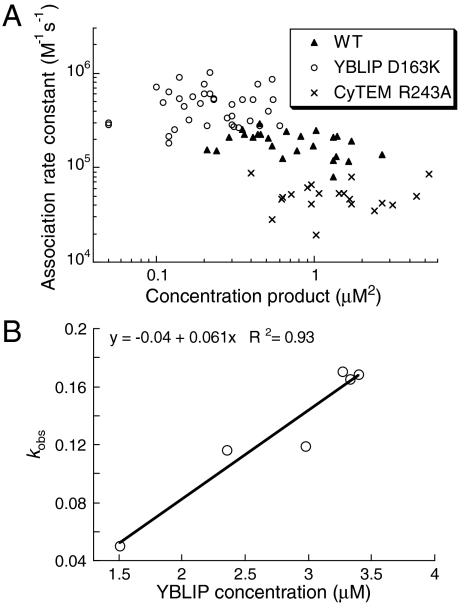
For living cell measurements, HeLa cells were transiently transfected with CyTEM and then injected with YBLIP to initiate the association reaction (Fig. 2A). Concentrations were in a range of 0.1–2.3 and 0.1–3.4 μM for CyTEM and YBLIP, respectively. These concentrations are typical for naturally expressed proteins in eukaryotic cells (http://bionumbers.hms.harvard.edu/). In accordance with the in vitro measurements, CyTEMWT-YBLIPD163K associated faster and CyTEMR243A-YBLIPWT associated slower than the wild-type complex (Table 1). No correlation was found between the product of the CyTEM and YBLIP concentrations and the association rate constants (Fig. 4A). Indeed, binding rate constants are intrinsic properties of complexes that should not be affected by the concentrations of the binding partners. To further validate the values obtained by numerical analysis, we determined association rate constants from pseudo-first-order kinetics, where YBLIP concentrations were at least sevenfold higher than CyTEMR243A. The slow association rate constant of this mutant enabled us to quantify the observed rates at high YBLIP concentrations. The pseudo-first-order association rate constant was equal, within experimental error, to the average value obtained from single-cell measurements [0.61 × 10⁵ M-1 s-1 (Fig. 4B), compared to 0.52 × 10⁵ M-1 s-1, respectively].
Fig. 4.
Association rate constants in living cells. (A) Association rate constants plotted versus the product of CyTEM and YBLIP concentrations in individual cells. (B) Pseudo-first-order kinetic analysis for CyTEMR243A interacting with YBLIPWT in cells. Observed rates of association are plotted against the YBLIP concentration in each cell, with the slope being the association rate constant.
The Effect of Cytoplasm Dilution on Association Rate Constants.
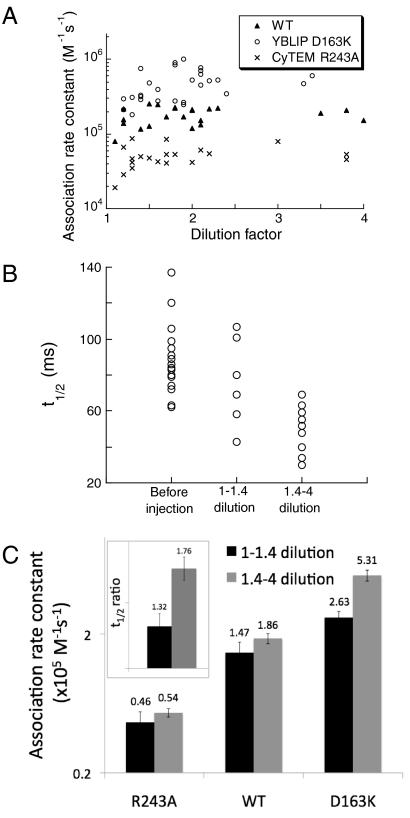
Microinjection results in a dilution of the cell content by the injected material, which is monitored by a decrease in CyTEM intensity immediately after injection. This dilution ranged from 1.1- to 4-fold, independent of whether YBLIP, YPet, or PBS were injected (with 1.1- to 2-fold being most common, Fig. 5A). Dilution in cell content results in an increased translational diffusion rate (17). As diffusion rates cannot be accurately determined by fluorescence recovery after photobleaching (FRAP) using a confocal microscope, we monitored the change in half-time of fluorescence recovery, t1/2, which is correlated with the diffusion rate (18). Before injection, t1/2 values were in a range of 62–137 ms. Dilution upon injection decreased t1/2 values to 43–107 ms for less than 1.4-fold dilution, and to 30–69 ms for more than 1.4-fold dilution (Fig. 5B). The average decrease in t1/2 values following injection was 1.32- and 1.76-fold for the low and the high dilution populations, respectively (Fig. 5C, Inset, p value = 0.01). Variations in diffusion rates (that relate to crowding) within a population of cells are natural (19), as also evident from the range of t1/2 values prior to injection. The association rate constants of different cells reflect the rates at different cytoplasmic crowding levels. Fig. 5C shows that, at high dilutions, association rate constants of TEMR243A and the wild-type complexes are not significantly higher than at low dilutions, whereas for the fast mutant, BLIPD163K, the difference is twofold (p value < 0.01).
Fig. 5.
The effect of cellular dilution on association rate constants. Dilution by microinjection was calculated as the ratio of CyTEM intensity before and after injection. (A) Dilution versus association rate constants in single cells. (B) Effect of low (1–1.4) and high (1.4–4) dilutions following PBS injections on t1/2 of single cells as determined by FRAP. (C) Effect of low and high dilutions on association rate constants (data from A). The ratio of t1/2 before and after injection was determined for each cell, and the average ratio for low- and high-diluted cells is shown in the inset. Error bars represent the standard error of the mean.
Discussion
Cellular function relies on rapid formation of specific interactions between proteins. The rate constants for many of these interactions were determined in the test tube, but their relevance to an actual cellular environment remained questionable, as real-time measurements within cells were never performed. In this study, we aimed to address this issue by quantitatively measuring binding between proteins in living cells. Using fluorescence to determine concentrations, FRET to probe complex formation, and microinjection to initiate the interaction at a specific time point, we were able to quantify binding rate constants for the TEM1-BLIP complex in HeLa cells. Studying prokaryotic proteins inside eukaryotic cells neutralizes system-specific effects of the cellular environment, and helps to demonstrate the general effects of intracellular crowding and compartmentalization on the binding dynamics. Surprisingly, despite the in vivo complexity, association rate constants were only up to twofold slower compared to a simple buffer solution. A similar outcome was previously reported for association in synthetic crowders (20, 21).
Whereas early theories of binding in crowded solutions predicted a large influence of crowding on binding equilibrium and rates (in some cases enhancing them by orders of magnitude; refs. 22 and 23), later theories and recent computer simulations tend to predict subtler effects (3, 24, 25), similar to those observed here. Three main factors modulate binding rates inside cells: nonspecific binding, diffusion rates, and depletion forces. Weak nonspecific chemical interactions between molecules are ubiquitous in the cell (26). These interactions reduce binding rates by reducing the available concentration of the binding molecules (27, 28) and by attenuating diffusion rates (29, 30). Diffusion rates of molecules in the cell are slower also due to higher viscosity (30). For proteins with a molecular mass similar to that of CyTEM and YBLIP (ca. 50 kDa), translational diffusion rates are estimated to be reduced by a factor of approximately 5 (17, 31, 32). Although competitive interactions and slower diffusion may act to reduce binding rates, the depletion force (or the caging effect) acts to enhance it (33–35). It seems that these factors operate in opposite directions, yielding only a minor modulation of binding rates compared to simple buffer solutions.
We further compared binding kinetics of the wild-type complex and two mutants with altered electrostatic complementarity: TEM1R243A decreases, whereas BLIPD163K increases association rate constants in vitro. In correspondence with their in vitro qualities, we found these complexes to associate faster and slower than the wild-type complex in cells, implying that electrostatic steering, which plays a dominant role in determining the nature of the encounter complex in vitro (12, 15, 16), is as important in vivo. Within cells, we found a negligible reduction in association rate constant for the slow TEM1R243K mutant, an apporximately 50% reduction for the wild-type complex and a twofold reduction for the fast BLIPD163K mutant (Table 1).
The dilution of cytoplasmic contents upon microinjection varies between cells. A comparison of association rate constants between individual cells revealed no significant effect of dilution on the association rate constant, except for BLIPD163K. The effect observed for this electrostatically optimized complex suggests that binding rates in cells are slightly more attenuated for faster (electrostatically optimized) binding. However, the comparison of rate constants was done relative to that measured in vitro in PBS. Because BLIPD163K binding is more sensitive to ionic strength than the wild-type or TEM1R243A complexes, it is possible that PBS does not accurately mimic the ionic composition inside cells.
HeLa cell extract may be viewed as an intermediate between the cellular environment and the test tube. Association and dissociation rate constants in cell extracts were similar to in vitro rate constants, implying that binding affinities in cell extracts and in vitro are similar. Furthermore, association rate constants in cell extracts were in between in vitro and in vivo values, justifying the extrapolation of results from in vitro measurements to in vivo environments.
The experimental system described here is modular and simple. It can be applied to any bimolecular association process and to any cell type, as long as the observed rates are not faster than the dead time of microinjection (about 1 s), and as long as the cell type is adherent and can tolerate the handling. However, when studying proteins in the native cellular environment, one must bear in mind that any factor present in the cell, including the native, unlabeled molecules, may affect the observed kinetics.
Methods
Protein Engineering.
CyTEM was constructed by fusing the N terminus of TEM1 (excluding the first 23 amino acid leader sequence) to 6xHis-CyPet (13) with a five amino acid linker (GGSGS) between them. YBLIP was constructed by fusing the N terminus of BLIP to 6xHis-YPet (13) (Fig. S1). For protein purification, YBLIP and CyTEM were cloned into the PET9a vector under the control of T7 promoter. E. coli BL21 cells were transformed with the plasmid and grown in 2YT medium to an optical density of 0.6. Protein expression was induced by addition of 10 and 100 μM IPTG for YBLIP and CyTEM, respectively. After induction, cells were grown at 20 °C for 16 h, centrifuged, lysed by sonication, and centrifuged again. For CyTEM purification, the supernatant was applied to HisTrap HP column (GE Healthcare) and eluted with 0.5 M Imidazole. For YBLIP purification, the pellet was dissolved with 8 M urea. Refolding was initiated by a gradual 10-fold dilution into 25 mM Tris at pH 8.4. The solution was mixed with Q Sepharose beads (GE Healthcare), eluted with 0.5 M NaCl, applied to a HisTrap HP column, and eluted with 0.5 M Imidazole. Purity was verified after dialysis with 25 mM Tris, 100 mM NaCl, at pH 7.4, by SDS-PAGE and analytical gel filtration. Protein concentration was determined by 280- and 480-nm absorption for YBLIP and CyTEM, respectively.
Cell Culture.
HeLa cells were grown in 35-mm glass-bottom dishes (MatTek) in DMEM (Invitrogen) supplemented with penicillin-streptomycin and 10% FBS to about 80% confluence. Transient transfection of CyTEM cloned into pmaxGFP vector (Amaxa) under the control of CMV promoter was performed with jetPEI (Polyplus transfection) according to the manufacturer’s protocols. Cells were imaged 16–30 h after transfection. Before imaging, cell medium was supplemented with 20 mM Hepes.
Microscopy and FRET Analysis.
Cells were viewed with an Olympus FluoView FV1000 IX81 Spectral/SIM Scanner confocal laser-scanning microscope, using 1.35 N.A. UPLSAPO 60 oil objective. In-cell spectra were recorded between 470 and 565 nm at a 5-nm resolution during excitation at 440 nm. For kinetic measurements, CyTEM (FRET donor) was exited with a 405-nm diode laser, which is superior over 440-nm excitation due to reduced autofluorescence of the cells and direct excitation of the acceptor. YBLIP (FRET acceptor) was excited with a 515-nm helium-neon laser. Emission was recorded simultaneously from 460 to 505 nm and from 531 to 631 nm using the spectral detection system. The FRET channel records acceptor emission (531–631 nm) during donor excitation (405 nm). To account for direct acceptor excitation and residual donor emission, and to render the FRET index independent of fluorescence intensities and laser noise, two additional channels were used: an acceptor channel (excitation at 515 nm and emission at 531–631 nm) and a donor channel (excitation at 405 nm and emission at 460–505 nm). To determine the extent of direct acceptor excitation, YBLIP was injected to cells void of CyTEM, and these acceptor-only cells were imaged using the FRET and acceptor channels. Direct acceptor excitation is calculated as
 |
[1] |
where  and
and  are the mean fluorescence intensities in the cell imaged by the FRET and acceptor channels, respectively. We used 515-nm laser intensities of 1.5% and 0.7% for low and high YBLIP concentrations, respectively. Accordingly, α was 0.05 and 0.12 (termed α∗ in Eq. 2).
The corrected FRET signal was determined for cells containing both donor and acceptor, and is defined as
 |
[2] |
where  ,
,  , and
, and  are the mean fluorescence intensities in the cell imaged by the FRET, acceptor, and donor channels, respectively (36). Images were acquired sequentially at 1 Hz, with two consecutive images taken at 405-nm excitation (to acquire the donor and FRET channels) followed by one image taken at 515-nm excitation (to acquire the acceptor channel). Images were collected before, during, and following injection, until a steady state was reached.
Microinjection.
Microinjections were performed using Eppendorf FemtoJet attached to Eppendorf InjectMan NI2 micromanipulator. Glass capillaries were purchased from Warner instruments and pulled by vertical puller (Narishige). Air was administrated at 50–100 hPa for 0.1–0.3 s. Before being loaded to the capillary, the injected proteins were diluted in PBS to a final concentration of 2–10 μM and centrifuged for 30 min at 13,000 × g.
Cell Extract Measurements.
Cytoplasmic HeLa cell extracts were prepared as described (37). Total protein concentration was determined in relation to a BSA calibration curve, and ranged between 4 and 8 mg/mL for different preparations. In order to relate CyTEM and YBLIP fluorescence to concentration, up to 2 μM of purified proteins were diluted in cell extract, placed on a glass-bottom dishes, and imaged with the confocal microscope. Fluorescence intensity 2 μm above the surface was plotted against protein concentration. Measurements were preformed with different preparations of cell extracts, yielding similar fluorescence intensities per micromolar. For association rate measurements, purified CyTEM diluted in cell extract was placed on a glass-bottom dish, and the interaction was initiated by rapidly pipetting an equal volume of purified YBLIP in cell extract. Measurement setup was identical to in-cell measurements. For dissociation rate measurements, an equal concentration of TEM1E104A and YBLIPWT were mixed with cell extract and incubated at room temperature until equilibrium. Dissociation was initiated by adding a threefold excess of CyTEM, and monitored by emission at 560 nm during 435 nm exciting. Data analysis with Pro-K II software (Applied PhotoPhysics), explicitly modeling the on and off rates of the two competing interactions, yielded the same dissociation rate constants as a single exponent fit to the data.
Association Rate Constant Calculation.
In-cell binding curves were analyzed with the numeric analysis software Pro-K II, using a two-state irreversible association model and protein concentrations in each cell as input. For details see SI Text.
Fluorescence Recovery After Photobleaching.
Cells were transiently transfected with pmaxGFP (Amaxa). The target cell was imaged with the main scanner at 488-nm excitation using 0.1% of the maximal intensity (about 0.12 μW) before, during, and after bleaching. Time-lapse images were acquired at 40-ms intervals. Photobleaching was achieved with the SIM scanner at 440-nm excitation for 3 ms, using full intensity (about 0.9 mW). Photobleaching protocol was carried out before and after injection of PBS to the cells. This setup does not allow for exact determination of diffusion rates, but only of t1/2, the time required for the fluorescence intensity in the bleached region to recover to 50% of the plateau fluorescence intensity. This value is frequently used to compare relative recovery rates between samples (18). Fluorescence recovery plots were fitted to a single exponent (k), from which t1/2 values were calculated as
 |
[3] |
In Vitro Measurements.
Association rate constants were determined using a stopped-flow fluorescence spectrometer (Applied PhotoPhysics) under pseudo-first-order conditions (20). Dissociation rate constants for both TEM1-BLIP and CyTEM-YBLIP wild-type complexes were determined using the ProteOn XPR36 (BioRad) as described before (34). Dissociation rate constant of the TEM1E104A-YBLIPWT complex was determined as described in Cell Extract Measurements. All measurements were done in 10 mM phosphate buffer pH 7.4 with 138 mM NaCl (PBS).
Supplementary Material
Acknowledgments.
We thank Prof. J. L. Sussman, Prof A. Horovitz, and members of our lab for comments on this manuscript. This work was supported by the Israel Science Foundation (founded by the Israel Academy of Sciences and Humanities) Grant 495/10.
Footnotes
The authors declare no conflict of interest.
This article is a PNAS Direct Submission.
This article contains supporting information online at www.pnas.org/lookup/suppl/doi:10.1073/pnas.1112171109/-/DCSupplemental.
References
- 1.Zhou HX, Rivas G, Minton AP. Macromolecular crowding and confinement: Biochemical, biophysical, and potential physiological consequences. Annu Rev Biophys. 2008;37:375–397. doi: 10.1146/annurev.biophys.37.032807.125817. [DOI] [PMC free article] [PubMed] [Google Scholar]
- 2.Elcock AH. Models of macromolecular crowding effects and the need for quantitative comparisons with experiment. Curr Opin Struct Biol. 2010;20:196–206. doi: 10.1016/j.sbi.2010.01.008. [DOI] [PMC free article] [PubMed] [Google Scholar]
- 3.McGuffee SR, Elcock AH. Diffusion, crowding & protein stability in a dynamic molecular model of the bacterial cytoplasm. PLoS Comput Biol. 2010;6:e1000694. doi: 10.1371/journal.pcbi.1000694. [DOI] [PMC free article] [PubMed] [Google Scholar]
- 4.Gierasch LM, Gershenson A. Post-reductionist protein science, or putting Humpty Dumpty back together again. Nat Chem Biol. 2009;5:774–777. doi: 10.1038/nchembio.241. [DOI] [PMC free article] [PubMed] [Google Scholar]
- 5.Gershenson A, Gierasch LM. Protein folding in the cell: Challenges and progress. Curr Opin Struct Biol. 2011;21:32–41. doi: 10.1016/j.sbi.2010.11.001. [DOI] [PMC free article] [PubMed] [Google Scholar]
- 6.Ebbinghaus S, Dhar A, McDonald JD, Gruebele M. Protein folding stability and dynamics imaged in a living cell. Nat Methods. 2010;7:319–323. doi: 10.1038/nmeth.1435. [DOI] [PubMed] [Google Scholar]
- 7.Dhar A, Ebbinghaus S, Shen Z, Mishra T, Gruebele M. The diffusion coefficient for PGK folding in eukaryotic cells. Biophys J. 2010;99:L69–71. doi: 10.1016/j.bpj.2010.08.066. [DOI] [PMC free article] [PubMed] [Google Scholar]
- 8.Schlesinger AP, Wang Y, Tadeo X, Millet O, Pielak GJ. Macromolecular crowding fails to fold a globular protein in cells. J Am Chem Soc. 2011;133:8082–8085. doi: 10.1021/ja201206t. [DOI] [PMC free article] [PubMed] [Google Scholar]
- 9.Sudhaharan T, et al. Determination of in vivo dissociation constant, KD, of Cdc42-effector complexes in live mammalian cells using single wavelength fluorescence cross-correlation spectroscopy. J Biol Chem. 2009;284:13602–13609. doi: 10.1074/jbc.M900894200. [DOI] [PMC free article] [PubMed] [Google Scholar]
- 10.Shi X, et al. Determination of dissociation constants in living zebrafish embryos with single wavelength fluorescence cross-correlation spectroscopy. Biophys J. 2009;97:678–686. doi: 10.1016/j.bpj.2009.05.006. [DOI] [PMC free article] [PubMed] [Google Scholar]
- 11.Hein P, Frank M, Hoffmann C, Lohse MJ, Bunemann M. Dynamics of receptor/G protein coupling in living cells. EMBO J. 2005;24:4106–4114. doi: 10.1038/sj.emboj.7600870. [DOI] [PMC free article] [PubMed] [Google Scholar]
- 12.Schreiber G, Haran G, Zhou HX. Fundamental aspects of protein–protein association kinetics. Chem Rev. 2009;109:839–860. doi: 10.1021/cr800373w. [DOI] [PMC free article] [PubMed] [Google Scholar]
- 13.Nguyen AW, Daugherty PS. Evolutionary optimization of fluorescent proteins for intracellular FRET. Nat Biotechnol. 2005;23:355–360. doi: 10.1038/nbt1066. [DOI] [PubMed] [Google Scholar]
- 14.Goldsbury C, Thies E, Konzack S, Mandelkow EM. Quantification of amyloid precursor protein and tau for the study of axonal traffic pathways. J Neurosci. 2007;27:3357–3363. doi: 10.1523/JNEUROSCI.5024-06.2007. [DOI] [PMC free article] [PubMed] [Google Scholar]
- 15.Selzer T, Schreiber G. New insights into the mechanism of protein–protein association. Proteins. 2001;45:190–198. doi: 10.1002/prot.1139. [DOI] [PubMed] [Google Scholar]
- 16.Albeck S, Unger R, Schreiber G. Evaluation of direct and cooperative contributions towards the strength of buried hydrogen bonds and salt bridges. J Mol Biol. 2000;298:503–520. doi: 10.1006/jmbi.2000.3656. [DOI] [PubMed] [Google Scholar]
- 17.Swaminathan R, Hoang CP, Verkman AS. Photobleaching recovery and anisotropy decay of green fluorescent protein GFP-S65T in solution and cells: Cytoplasmic viscosity probed by green fluorescent protein translational and rotational diffusion. Biophys J. 1997;72:1900–1907. doi: 10.1016/S0006-3495(97)78835-0. [DOI] [PMC free article] [PubMed] [Google Scholar]
- 18.Snapp EL, Altan N, Lippincott-Schwartz J. Measuring protein mobility by photobleaching GFP chimeras in living cells. Curr Protoc Cell Biol. 2003. Chap 21:Unit 21.1. [DOI] [PubMed]
- 19.Konopka MC, Shkel IA, Cayley S, Record MT, Weisshaar JC. Crowding and confinement effects on protein diffusion in vivo. J Bacteriol. 2006;188:6115–6123. doi: 10.1128/JB.01982-05. [DOI] [PMC free article] [PubMed] [Google Scholar]
- 20.Kozer N, Schreiber G. Effect of crowding on protein–protein association rates: Fundamental differences between low and high mass crowding agents. J Mol Biol. 2004;336:763–774. doi: 10.1016/j.jmb.2003.12.008. [DOI] [PubMed] [Google Scholar]
- 21.Kozer N, Kuttner YY, Haran G, Schreiber G. Protein–protein association in polymer solutions: From dilute to semidilute to concentrated. Biophys J. 2007;92:2139–2149. doi: 10.1529/biophysj.106.097717. [DOI] [PMC free article] [PubMed] [Google Scholar]
- 22.Nichol LW, Ogston AG, Wills PR. Effect of inert polymers on protein self-association. FEBS Lett. 1981;126:18–20. doi: 10.1016/0014-5793(81)81022-8. [DOI] [PubMed] [Google Scholar]
- 23.Minton AP. The effect of volume occupancy upon the thermodynamic activity of proteins: Some biochemical consequences. Mol Cell Biochem. 1983;55:119–140. doi: 10.1007/BF00673707. [DOI] [PubMed] [Google Scholar]
- 24.Wieczorek G, Zielenkiewicz P. Influence of macromolecular crowding on protein–protein association rates—a Brownian dynamics study. Biophys J. 2008;95:5030–5036. doi: 10.1529/biophysj.108.136291. [DOI] [PMC free article] [PubMed] [Google Scholar]
- 25.Zhou HX. Protein folding and binding in confined spaces and in crowded solutions. J Mol Recognit. 2004;17:368–375. doi: 10.1002/jmr.711. [DOI] [PubMed] [Google Scholar]
- 26.Deeds EJ, Ashenberg O, Gerardin J, Shakhnovich EI. Robust protein–protein interactions in crowded cellular environments. Proc Natl Acad Sci USA. 2007;104:14952–14957. doi: 10.1073/pnas.0702766104. [DOI] [PMC free article] [PubMed] [Google Scholar]
- 27.Schoen I, Krammer H, Braun D. Hybridization kinetics is different inside cells. Proc Natl Acad Sci USA. 2009;106:21649–21654. doi: 10.1073/pnas.0901313106. [DOI] [PMC free article] [PubMed] [Google Scholar]
- 28.Jiao M, Li HT, Chen J, Minton AP, Liang Y. Attractive protein-polymer interactions markedly alter the effect of macromolecular crowding on protein association equilibria. Biophys J. 2010;99:914–923. doi: 10.1016/j.bpj.2010.05.013. [DOI] [PMC free article] [PubMed] [Google Scholar]
- 29.Wang Y, Li C, Pielak GJ. Effects of proteins on protein diffusion. J Am Chem Soc. 2010;132:9392–9397. doi: 10.1021/ja102296k. [DOI] [PMC free article] [PubMed] [Google Scholar]
- 30.Verkman AS. Solute and macromolecule diffusion in cellular aqueous compartments. Trends Biochem Sci. 2002;27:27–33. doi: 10.1016/s0968-0004(01)02003-5. [DOI] [PubMed] [Google Scholar]
- 31.Arrio-Dupont M, Foucault G, Vacher M, Devaux PF, Cribier S. Translational diffusion of globular proteins in the cytoplasm of cultured muscle cells. Biophys J. 2000;78:901–907. doi: 10.1016/S0006-3495(00)76647-1. [DOI] [PMC free article] [PubMed] [Google Scholar]
- 32.Seksek O, Biwersi J, Verkman AS. Translational diffusion of macromolecule-sized solutes in cytoplasm and nucleus. J Cell Biol. 1997;138:131–142. doi: 10.1083/jcb.138.1.131. [DOI] [PMC free article] [PubMed] [Google Scholar]
- 33.Kim JS, Yethiraj A. Effect of macromolecular crowding on reaction rates: A computational and theoretical study. Biophys J. 2009;96:1333–1340. doi: 10.1016/j.bpj.2008.11.030. [DOI] [PMC free article] [PubMed] [Google Scholar]
- 34.Phillip Y, Sherman E, Haran G, Schreiber G. Common crowding agents have only a small effect on protein–protein interactions. Biophys J. 2009;97:875–885. doi: 10.1016/j.bpj.2009.05.026. [DOI] [PMC free article] [PubMed] [Google Scholar]
- 35.Asakura S, Oosawa F. On interaction between two bodies immersed in a solution of macromolecules. J Chem Phys. 1954;22:1255–1256. [Google Scholar]
- 36.Zal T, Gascoigne NR. Photobleaching-corrected FRET efficiency imaging of live cells. Biophys J. 2004;86:3923–3939. doi: 10.1529/biophysj.103.022087. [DOI] [PMC free article] [PubMed] [Google Scholar]
- 37.Abmayr SM, Yao T, Parmely T, Workman JL. Preparation of nuclear and cytoplasmic extracts from mammalian cells. Curr Protoc Mol Biol. 2006. Chap 12:Unit 12.1. [DOI] [PubMed]
Associated Data
This section collects any data citations, data availability statements, or supplementary materials included in this article.


