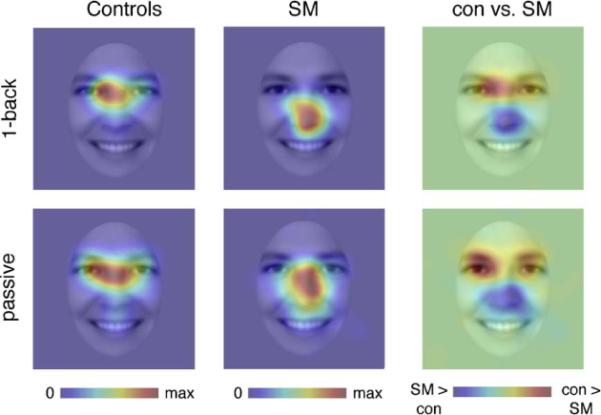
Fig. 3.

Fixation heat maps showing locations of face fixations for patient SM and control participants for both the 1-back gender task and passive viewing task. Fixations were smoothed with a 27-pixel FWHM Gaussian filter, corresponding to a 2° visual angle. Each heatmap is displayed in arbitrary units, but corresponds to fixation duration/smoothed area. Heatmaps are displayed on the mean of all face images. Each individual heatmap is scaled from zero fixations (blue) to the point of maximal fixation (red). The group difference heatmap shows areas SM fixated more than controls (blue), and vice versa (red), with green meaning there was no difference between groups. Please refer to ROI analyses (see Results) for statistical analyses. (For interpretation of the references to color in this figure legend, the reader is referred to the web version of the article.)
