Abstract
Here, we describe the construction and testing of a novel herpes simplex virus type 1 (HSV-1) derived oncolytic virus (OV): 34.5ENVE (viral ICP34.5 Expressed by Nestin promotor and Vstat120 Expressing), for the treatment of cancer. This virus showed significant glioma-specific killing and antiangiogenic effects in vitro and in vivo. Treatment of subcutaneous and intracranial glioma-bearing mice with 34.5ENVE showed a significant increase in median survival of mice in four different glioma models. Histology and dynamic contrast-enhanced magnetic resonance imaging (DCE-MRI) revealed reduced microvessel density (MVD) and increased tumoral necrosis in 34.5ENVE-treated tumor tissue compared to control OV-treated tumor tissue. Collectively, these results describe the construction, efficacy, and impact on tumor microenvironment of a transcriptionally driven OV armed with Vstat120 gene expression. These preclinical results will facilitate future clinical testing of 34.5ENVE.
Introduction
The poor prognosis associated with Glioblastoma multiforme underscores the urgent need to seek out novel strategies to improve patient outcome.1 Oncolytic virus (OV) therapy is one of such strategies, as it utilizes viruses with a propensity to replicate and destroy cancer cells as an antineoplastic agent. First generation OVs have been tested in patients and have been proven safe, yet have revealed limited efficacy.2,3,4
We have previously created and tested the therapeutic efficacy of a first generation OV armed with the antiangiogenic gene Vstat120 (RAMBO).5 While this virus showed significant antitumor efficacy compared to control rHSVQ1, single treatment of mice with established intracranial tumors resulted in only 20% of the mice showing a complete response. It is likely that the highly attenuated rHSVQ1 viral backbone of RAMBO limited oncolysis and antitumor efficacy. Several innovative approaches are currently under investigation to enhance OV therapeutic efficacy, and transcriptional retargeting of viral replication is one of such exciting approaches.6,7,8 rQnestin34.5 is one such virus which is enhanced by transcriptional retargeting as it expresses viral ICP34.5 under the regulation of a glioma-specific nestin promotor in an ICP34.5 deleted viral backbone.7,9,10,11 This virus has shown significant antitumor efficacy against glioma and neuroblastoma tumors.9,11 Thus, we hypothesized that incorporation of Vstat120 within the rQnestin34.5 backbone would show enhanced antitumor efficacy compared to RAMBO or rQnestin34.5.
Based on these results we engineered and tested the therapeutic efficacy of arming rQnestin34.5 with the antiangiogenic gene Vstat120. Here, we describe the construction of a novel OV, 34.5ENVE (viral ICP34.5 Expressed by Nestin promotor and Vstat120 Expressing). This virus showed significant glioma-specific killing and antiangiogenic effects in vitro and in vivo. In addition to the nestin driven specificity of 34.5ENVE, we also observed a highly significant increase in antitumor efficacy, even at a single intratumoral injection, in intracranial glioma-bearing mice. Dynamic contrast-enhanced magnetic resonance imaging (DCE-MRI) revealed increased blood–brain barrier permeability (increased Ktrans) in tumors treated with OV compared to control phosphate-buffered saline (PBS)-treated tumors indicating OV-mediated increased blood–brain barrier disruption. Additionally, both histology and calculated DCE-MRI parameters revealed a significant increase in necrotic areas in 34.5ENVE-treated compare to rQnestin34.5-treated tumors.
Results
Generation and characterization of recombinant 34.5ENVE
34.5ENVE, an OV-expressing Vstat120 within the backbone of rQnestin34.5, was engineered using HSVQuik technology as described.12 Figure 1a shows the genetic structures of wild-type herpes simplex virus type 1 (HSV-1) and 34.5ENVE along with the first and second generation OVs used in this study. rHSVQ1 is a first generation OV deleted for both copies of ICP34.5 and disrupted for ICP6; rQnestin34.5 is a transcriptionally driven OV, expressing ICP34.5 under the control of the glioma-specific nestin promotor in an rHSVQ1 backbone; RAMBO is a Vstat120-expressing OV within the rHSVQ1 backbone; and 34.5ENVE expresses Vstat120 within the rQnestin34.5 viral backbone.5,9 Figure 1b shows a schematic of the PKR-activated cellular defense response and the role of viral ICP34.5 in this process. Activation of cellular PKR, postviral infection, results in phosphorylation of cellular eIF2α and subsequent shut down of protein synthesis.13 Viral ICP34.5 activates cellular phosphatases, leading to dephosphorylation of eIF2α thus permitting protein synthesis and viral replication. The phosphorylation state of cellular eIF2α in infected cells was evaluated to investigate the expression of functional ICP34.5. As expected, Figure 1c demonstrates increased phosphorylation of eIF2α (P-eiF2α) in glioma cells infected with control ICP34.5 deleted OVs (rHSVQ1 or RAMBO). Reduced P-eiF2α in glioma cells infected with 34.5ENVE or rQnestin34.5 was evident in cells positive for nestin expression (U251 and X12-V2), but not in glioma cells with low nestin expression (T98G) (Figure 1c,d). The ability of 34.5ENVE to produce Vstat120 was evaluated in U251 glioma cells infected with control (rHSVQ1 or rQnestin34.5) or Vstat120 expressing (RAMBO or 34.5ENVE) OV. Western blot analysis revealed efficient production and secretion of Vstat120 from glioma cells infected with RAMBO or 34.5ENVE (Figure 1e).
Figure 1.
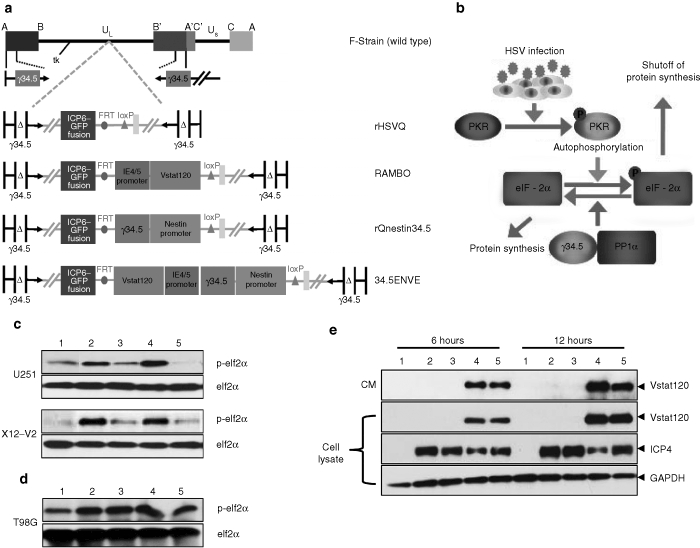
Structure and characterization of 34.5ENVE. (a) Genetic map of wild-type herpes simplex virus type 1 (HSV-1), and the various oncolytic viruses (OVs) used in this study. (b) Activation of PKR upon OV infection causes phosphorylation of eIF2α, and subsequent shutoff of protein synthesis. Viral ICP34.5 activates protein phosphatase 1α, to reverse phosphorylation of eIF2α and the subsequent protein translation. (c) Western blot analysis of phosphorylated and total eIF2α in high nestin-expressing U251 and X12-V2 glioma cells treated with phosphate-buffered saline (PBS) (lane 1) or infected with rHSVQ1 (lane 2), rQnestin34.5 (lane 3), RAMBO (lane 4), or 34.5ENVE (lane 5) [multiplicity of infection (MOI) = 0.1], 24 hours postinfection. (d) Western blot analysis of phosphorylated and total eIF2α in low nestin-expressing T98G glioma cells treated similarly (MOI = 0.1), 24 hours postinfection. (e) Western blot analysis of U251 glioma cells treated with PBS (lane 1), rHSVQ1 (lane 2), rQnestin34.5 (lane 3), RAMBO (lane 4), or 34.5ENVE (lane 5) at an MOI = 0.1. The cells were harvested at 6 and 12 hours postinfection and analyzed for expression of secreted and cellular Vstat120 and ICP4. Note the presence of Vstat120 in cells infected with RAMBO and 34.5ENVE.
Oncolysis of 34.5ENVE in nestin-expressing glioma cells
Viral ICP34.5 is driven by the nestin promotor in rQnestin34.5 and it has been shown to have increased virus replication compared to rHSVQ1 in nestin-expressing glioma and neuroblastoma cells, but not in low nestin-expressing cells.9,11 To test whether insertion of the Vstat120 gene expression cassette alters the specificity of rQnestin34.5 replication, we compared the viral replication of rQnestin34.5 and 34.5ENVE in twelve different glioma cell lines and primary normal cells. As glioma cells are varyingly susceptible to virus infection, we normalized the fold increase in replication of 34.5ENVE and rQnestin34.5 to ICP34.5 deleted rHSVQ1. Figure 2a shows the scatter plot in Log2 function for the fold change in replication of rQnestin34.5 and 34.5ENVE relative to rHSVQ1 in 12 glioma and normal cell lines. There was a statistically significant positive correlation between the replication of rQnestin34.5 and 34.5ENVE (r = 0.95091, P < 0.0001), suggesting that Vstat120 expression did not alter specificity of rQnestin34.5 replication in different cell lines. To determine whether 34.5ENVE retained glioma cell-specific oncolysis, we compared the cytotoxic ability of the four different viruses in cells with high and low nestin expression (Supplementary Figure S1). Consistent with nestin promotor enhanced virus replication, both rQnestin34.5 and 34.5ENVE showed statistically significant increased cytotoxicity (relative to rHSVQ1) in nestin-expressing cells (U251, U87ΔEGFR, LN229, and X12-V2) but not in cells with low or negative nestin expression (T98G, Gli36Δ5, human normal astrocyte, and human normal hepatocyte) (Figure 2b,c).
Figure 2.
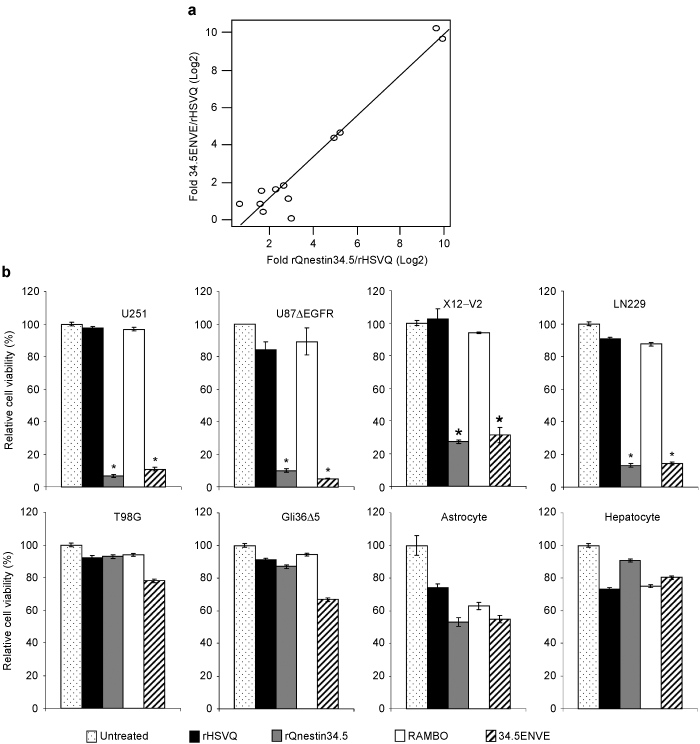
Increased virus replication and cytopathic effect of 34.5ENVE in high nestin-expressing cells. Twelve different cell lines (glioma and normal) were infected with rHSVQ1, rQnestin34.5, or 34.5ENVE [multiplicity of infection (MOI) = 0.001]. Seventy-two hours postinfection the amount of rHSVQ1, rQnestin34.5, and 34.5ENVE in each cell line was evaluated by plaque assay. (a) Scatter plot of relative virus yield of Log2 fold increase in 34.5ENVE to rQnestin34.5 relative to rHSVQ1 in each cell line. Each dot represents 1 of the 12 glioma/primary cells evaluated. (b,c) Quantification of cell viability in the indicated cells infected with rHSVQ1, rQnestin34.5, RAMBO, or 34.5ENVE (MOI = 0.05) relative to phosphate-buffered saline (PBS) 3 days postinfection.
34.5ENVE inhibits endothelial cell migration and tube formation in vitro and in vivo
Next, we tested the effect of 34.5ENVE on endothelial cell migration and tube formation in vitro. To investigate this, we evaluated tube formation ability of endothelial cells cultured with conditioned media (CM) derived from OV-infected glioma cells (HSV-1 neutralizing antibody was added to the CM to avoid secondary infection of endothelial cells by contaminating virus particles). Figure 3a shows representative images of the formation of elongated tube-like structures in endothelial cells treated with CM derived from U251 cells treated with PBS, or the indicated virus; structured tube number/view is quantified in Figure 3b. Note the significant reduction in the number of tubes obtained from the cells treated with 34.5ENVE and RAMBO compared to rHSVQ1 or rQnestin34.5-infected cells (P < 0.001). We also investigated the effects of 34.5ENVE on the migration of human dermal microvascular endothelial cells (HDMECs) in a transwell chamber. Quantitative analysis showed that CM collected from U251 cells infected with 34.5ENVE or RAMBO significantly reduced the migration of endothelial cells by 33 and 34.1%, respectively, relative to rHSVQ1 (Figure 3c). Collectively, these findings demonstrate that 34.5ENVE effectively inhibits endothelial cell tube formation and migration in vitro. To determine the impact of 34.5ENVE on tumoral angiogenesis in vivo, we compared microvessel density (MVD) in a U251T3 subcutaneous tumor xenograft model as described by Weidner et al.14 Figure 4a shows representative images of adjacent tumor sections stained with hematoxylin and eosin, anti-HSV-1, and anti-CD31 antibodies at high and low magnification. Figure 4b shows quantification of CD31+ blood vessels in viable tumor tissue adjacent to HSV-1 positive staining tumor area. Quantification revealed 3.5-, 2.1-, and 1.8-fold reduction in MVD in tumors treated with 34.5ENVE compared to rHSVQ1, rQnestin34.5, or RAMBO, respectively (P = 0.0001, 0.0002, and 0.0033, respectively).
Figure 3.
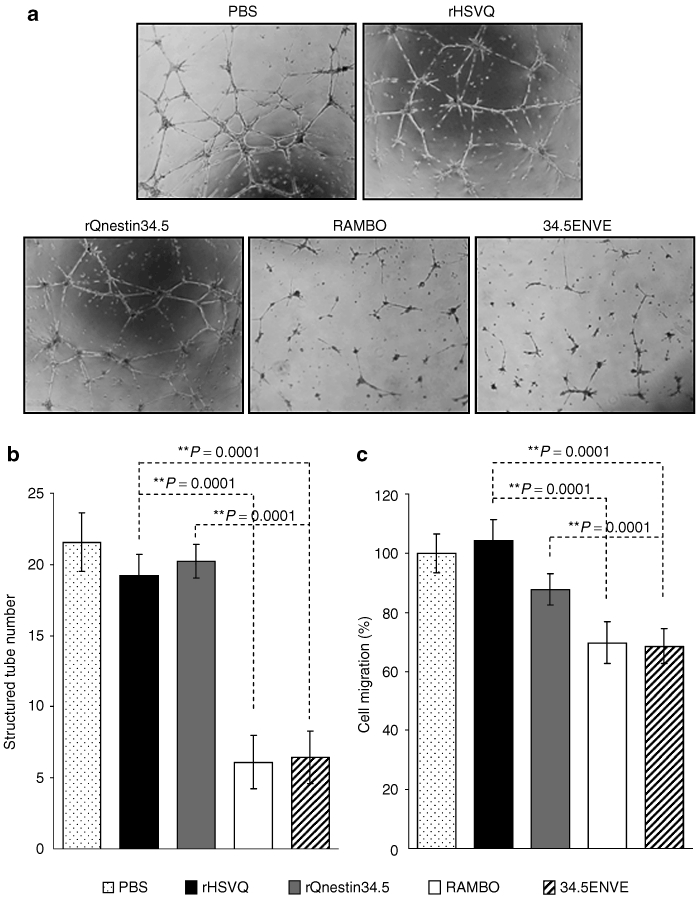
Antiangiogenic effect of 34.5ENVE in vitro. (a) Images of endothelial cell tube formation after being cultured on Matrigel. Endothelial cells were incubated with conditioned medium (CM) derived from U251 cells infected with the indicated virus or phosphate-buffered saline (PBS). (b) Quantification of the average number of tubes/view field (n = 4/group) observed above. (c) Inhibition of endothelial cell migration: human dermal microvascular endothelial cells (HDMECs) were incubated with CM derived from U251 cells treated with PBS, or the indicated virus. Cells were plated in the upper chamber of transwell and allowed to migrate toward CM used as a chemoattractant in the bottom chamber. The migrated cells on the bottom side of the filter were quantified as described (n = 4/group).26 Data are presented as mean ± SEM of number of cells/view field.
Figure 4.
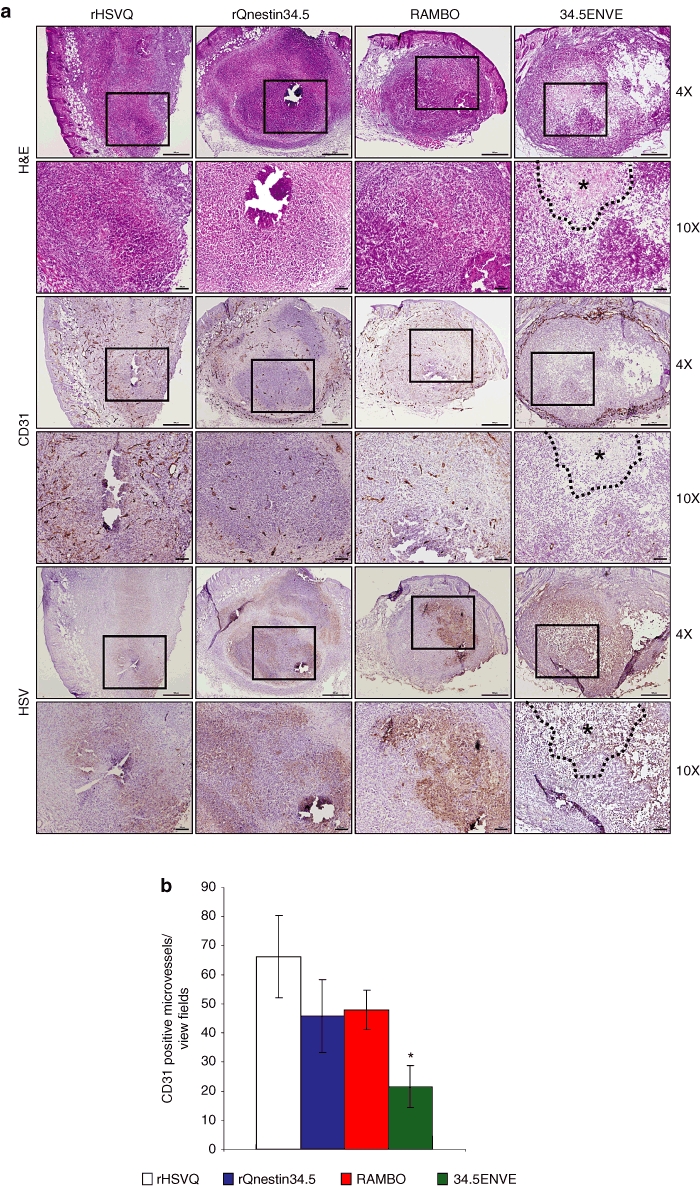
Reduced angiogenesis in tumors treated with 34.5ENVE. (a) Representative images of immunohistochemistry for hematoxylin and eosin (H&E), CD31, and HSV-1 staining of adjacent tumor sections treated with phosphate-buffered saline (PBS), or the indicated virus. Necrotic area is marked by asterisks and black dotted lines. (b) Quantification of microvessel density (MVD) in tumors treated with PBS, or the indicated virus. Data shown are mean MVD ± SEM for each group (n = 6 sections/tumor and n = 3 tumors/group). All bars are 100 µm for ×10 magnification images and 500 µm for ×4 images, respectively.
Antitumor effects of 34.5ENVE in vivo
We next investigated the antitumor effects of 34.5ENVE in vivo in four different glioma models. Mice with subcutaneous tumors (U251T3 glioma cells) were treated with PBS, rQnestin34.5, RAMBO, or 34.5ENVE. Figure 5a shows that PBS-treated tumors grew rapidly and animals had to be sacrificed by day 17 due to tumor burden. In marked contrast, 7/7 mice treated with 34.5ENVE showed complete tumor regression by day 25, whereas on a long-term follow-up to day 49, only 4/7 mice treated with RAMBO or rQnestin34.5 showed a complete response with the rest of the mice showing progressive disease (as measured by increasing tumor volume). We next compared the antitumor efficacy of 34.5ENVE in mice bearing an intracranial U87ΔEGFR (Figure 5b), X12-V2 (Figure 5c), and Gli36Δ5 (Figure 5d) glioma. Figure 5b shows Kaplan–Meier curves for survival of mice (with U87ΔEGFR glioma) in each group (n = 8/group). Control mice treated with PBS died of tumor burden (median survival: 20 days), whereas mice treated with rHSVQ1, rQnestin34.5, RAMBO, or 34.5ENVE showed increased median survivals (median survival = 33, 34, 53, and >80 days, respectively). Consistent with our previous results, mice treated with RAMBO showed a significant increase in median survival compared to rHSVQ1-treated mice.5 Significantly, 75% of the mice treated with 34.5ENVE lived longer than 80 days at which point they were sacrificed and found to be tumor free (P < 0.001 between 34.5ENVE and rHSVQ1, P = 0.002 between 34.5ENVE and rQnestin 34.5, P = 0.077 between 34.5ENVE and RAMBO). To evaluate whether antitumor efficacy of 34.5ENVE was dependent on nestin status of cells, we compared antitumor efficacy of 34.5ENVE and RAMBO in glioma with high (X12-V2) and low nestin (Gli36Δ5) expression (Supplementary Figure S1). Consistent with nestin driven specificity of 34.5ENVE, we observed a significant increase in antitumor efficacy of 34.5ENVE compared to RAMBO in high nestin-expressing X12-V2 intracranial glioma-bearing mice (P = 0.026 between RAMBO and 34.5ENVE) with no difference in low nestin-expressing Gli36Δ5 glioma-bearing mice (Figure 5c,d).
Figure 5.
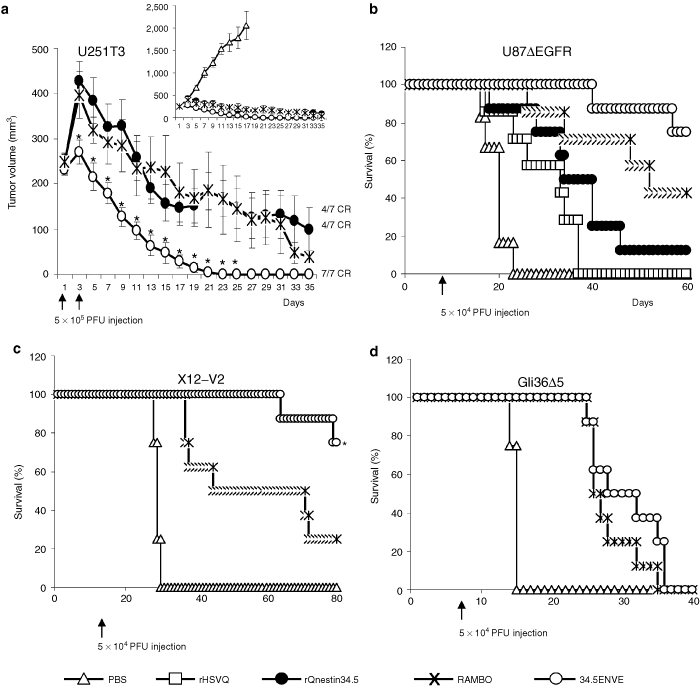
Antitumor effects of 34.5ENVE in vivo. (a) Antitumor efficacy of 34.5ENVE against U251T3 subcutaneous glioma model. Mice with U251T3 subcutaneous tumors were treated with phosphate-buffered saline (PBS) or 5 × 10⁵ plaque-forming unit (pfu) every other day for a total of two times (Q2Dx2) once tumors reached an average volume of 250 mm3. Mean tumor growth of mice after treatment with PBS, rQnestin34.5, RAMBO, or 34.5ENVE is shown as a function of time. CR: complete response shown in mice by day 49. (b) Kaplan–Meier survival curve of mice implanted with U87ΔEGFR intracranial glioma treated with PBS or 5 × 10⁴ pfu of rHSVQ1, rQnestin34.5, RAMBO, or 34.5ENVE 7 days after tumor cell implantation. (c) Kaplan–Meier survival curve of mice implanted with X12-V2 intracranial glioma treated with PBS or 5 × 10⁴ pfu of RAMBO or 34.5ENVE 10 days after tumor cell implantation. (d) Kaplan–Meier survival curve of mice implanted with Gli36Δ5 intracranial glioma treated with PBS or 5 × 10⁴ pfu of RAMBO or 34.5ENVE 7 days after tumor cell implantation.
Increased necrosis in tumors treated with 34.5ENVE
In a parallel experiment to measure the impact of Vstat120 expressed by 34.5ENVE on the tumor microenvironment, we used dynamic contrast-enhanced MRI (DCE-MRI) to noninvasively measure the antitumor response to rQnestin34.5 and 34.5ENVE treatment in intracranial glioma (U87ΔEGFR) bearing mice. Mice were treated with PBS (n = 3/group), rQnestin34.5 (n = 4/group), or 34.5ENVE (n = 4/group) on day 10 post-tumor cell implantation. Figure 6 shows representative coronal T2-weighted MRI images from one mouse/group pretreatment and on days 3 and 6 post-treatment, respectively. Assessment of tumor volumes in all mice showed that while PBS-treated tumors grew rapidly, all of the OV-treated tumors showed initial increase in apparent tumor volume (comparing day 3 post-treatment to pretreatment), followed by tumor regression on day 6 post-treatment. Interestingly, despite a better survival, we did not observe a significant difference in tumor volume shrinkage measured by T2-weighted MRI between rQnestin34.5 and 34.5ENVE at these time points. Because tumoral necrosis and edema can contribute to apparent tumoral volume, we investigated changes in tumoral perfusion and necrosis in animals treated with rQnestin34.5 and 34.5ENVE. Figure 7 shows contrast enhancement of all tumor-bearing mice imaged 3 days after the indicated treatment immediately following gadolinium diethylene-triamine penta-acetic acid (Gd-DTPA) administration. Contrast enhancement was evident in all of the OV-treated animals at the site of OV injection. However, in the 34.5ENVE-treated animals immediately after Gd-DTPA administration, there was a central unperfused area (yellow arrow) at the site of virus injection accompanied by increased leakiness surrounding this core (Figure 7), giving the appearance of a halo. We used Gd-DTPA-based DCE-MRI to calculate changes in Ktrans and ve between rQnestin34.5- and 34.5ENVE-treated animals (Supplementary Figure S2). Ktrans refers to increased leakage of contrast agent and suggests increased endothelial permeability facilitating the entry of the contrast agent from the blood plasma, and ve refers to the volume of contrast in the extravascular and extracellular space per unit volume of tissue.15 We found a significant increase in ve, in animals treated with 34.5ENVE compared to rQnestin34.5, (P = 0.0009, n = 4/group) without a significant change in Ktrans (Supplementary Figure S2). Spatially, the increased ve in all the 34.5ENVE-treated animals was localized to the noncontrast enhancing core visualized immediately after Gd-DTPA administration (Figure 8a). Such a pattern of increase of ve in the noncontrast enhancing area has been shown to indicate tumoral necrosis.16 We thus investigated the noncontrast enhancing core further using histological analysis. Figure 8b shows representative hematoxylin and eosin stained images of tumor-bearing brain sections, showing increased necrosis (asterisks) in the intracranial tumor core of animals treated with 34.5ENVE compared to rQnestin34.5. Collectively, these findings indicate that 34.5ENVE treatment results in increased tumor necrosis and enhanced antitumor efficacy compared to rQnestin34.5.16
Figure 6.
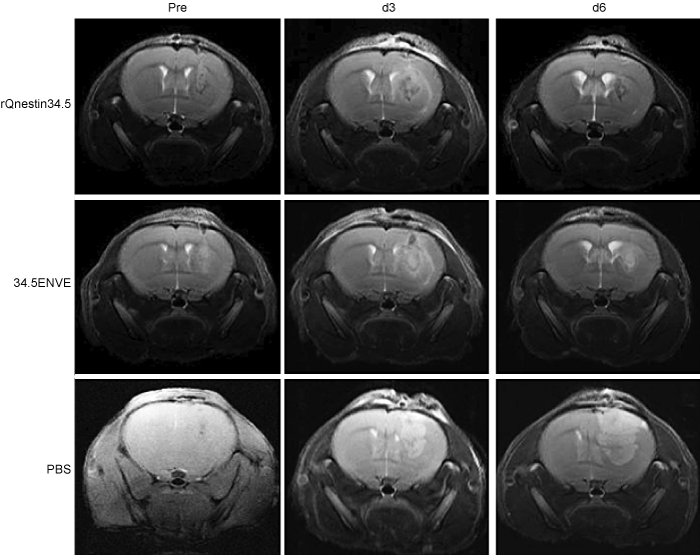
Oncolytic virus (OV) treatment induced tumor regression. T2-weighted MRI images of coronal sections of a representative tumor-bearing mouse 1 day before (left panel), 3 days after (middle panel), and 6 days after (right panel) treatment with rQnestin34.5 (top), 34.5ENVE (middle), or phosphate-buffered saline (PBS) (bottom).
Figure 7.
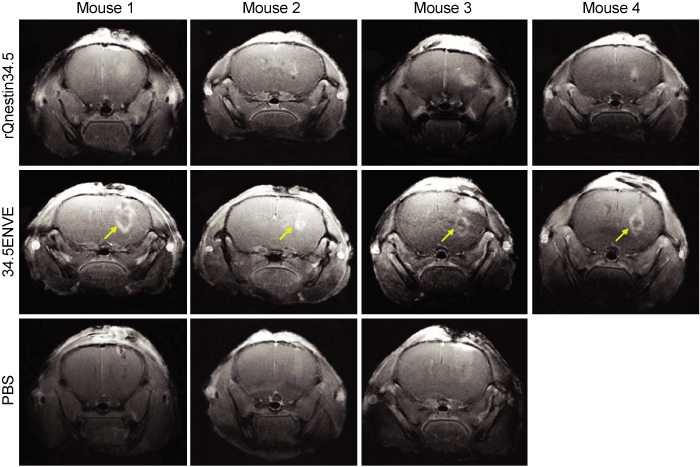
Contrast enhancement of phosphate-buffered saline (PBS) and oncolytic virus (OV)-treated tumors. Contrast-enhanced images of coronal sections of mice 3 days after treatment with PBS (n = 3), rQnestin34.5 (n = 4), or 34.5ENVE (n = 4). Diffusion of the contrast agent immediately after Gd-DTPA administration results in contrast enhancement appearing as area of high signal intensity. Arrow indicates the central nonenhancing core observed in all four of the mice treated with 34.5ENVE, which is not evident in any mice treated with rQnestin34.5 or PBS.
Figure 8.
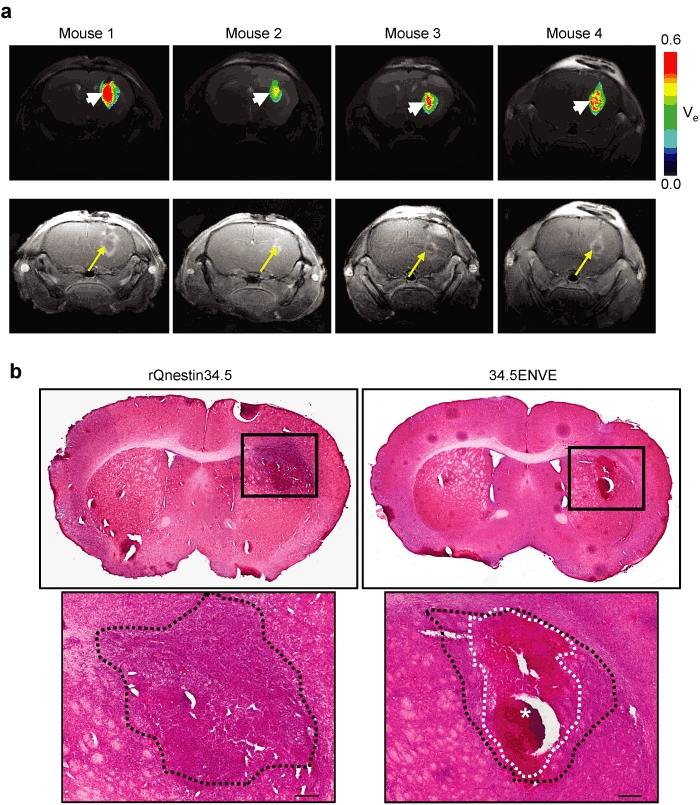
Effect of 34.5ENVE on tumor necrosis. (a) Inverse spatial correlation of ve and contrast enhancing tumor area in 34.5ENVE-treated mice. Color-coded parametric images of ve in each of the four 34.5ENVE treated mice 3 days post-treatment (top) show increased ve (arrow head) in tumoral area that initially lacked contrast enhancement (arrow) immediately after Gd-DTPA administration in each of the four mice treated with 34.5ENVE. (b) Histologic analysis of necrosis in rQnestin34.5- and 34.5ENVE-treated brain tumors. In a parallel study, the above experiment was repeated and animals were sacrificed 3 days post-treatment for histological analysis of tumor-bearing brain. Representative hematoxylin and eosin (H&E) stained sections of rQnestin34.5- and 34.5ENVE-treated animals. Large necrotic area evident in 34.5ENVE-treated tumor (white dotted line and asterisks) is surrounded by viable tumor area (black dotted line). Bar = 200 µm.
Discussion
OV treatment is a promising biological therapy currently being evaluated in human patients for safety and efficacy. Rapid viral clearance along with reduced viral replication in tumor cells is thought to be one of the major factors responsible for limited efficacy.17 Transcriptional retargeting of OV by utilizing glioma-specific nestin enhancer driven ICP34.5 expression has been described and has shown efficacy in preclinical models of glioma and neuroblastoma.9,10,11 Nestin was initially described as a marker for neuronal stem cells, however, its expression has been reported in several malignancies including brain, gastrointestinal, pancreatic, prostate, breast, malignant melanoma, and thyroid tumors.18 Thus, nestin driven OVs have therapeutic significance for many different types of cancer.9,10,11 Apart from virus replication, the tumor microenvironment also presents a formidable barrier for OV therapy, and arming of OV with antiangiogenic genes has shown promise in several preclinical studies.19 Here, we describe the construction and antitumor efficacy of 34.5ENVE, an OV transcriptionally driven to have increased virus replication in nestin-positive tumor cells and armed with the antiangiogenic Vstat120 gene to modulate the tumor microenvironment.
Vstat120 is an extracellular fragment of brain angiogenesis inhibitor 1, whose expression has been shown to be reduced in several malignancies.20,21,22,23,24 Given the antiangiogenic role attributed to Vstat120, the reconstitution of its expression in brain angiogenesis inhibitor 1 null tumors may enhance anticancer therapeutic efficacy.5,25,26,27,28 The antiangiogenic effects of Vstat120 are attributed to five thrombospondin type 1 domains within its N terminal sequence, and an integrin antagonizing RGD motif.27,28,29 Oncolytic HSV-1 therapy has been shown to reduce TSP-1 protein, and also increase integrin-activating CCN1 protein in the tumor extracellular matrix, resulting in an increased angiogenesis in the residual tumors after OV therapy.30,31 Thus, we hypothesized that Vstat120 gene delivery in conjunction with transcriptionally retargeted oncolysis would reduce OV induced vascular permeability and prolong OV propagation and efficacy in tumors.
Here, we describe significant antitumor efficacy of 34.5ENVE in both subcutaneous and intracranial glioma models. Changes in vascular permeability have been correlated with both increased and reduced OV efficacy.32,33 Here, we used DCE-MRI of mice with intracranial tumors to investigate the impact of Vstat120 on vessel leakiness. Whereas there was no change in absolute value of Ktrans between rQnestin34.5 and 34.5ENVE, analysis of the parametric images of ve along with histologic analysis of intracranial tumors showed increased tumoral necrosis in 34.5ENVE-treated animals. Future studies evaluating its safety and biodistribution in HSV-1 sensitive BalbC mice will be needed before its clinical investigation in patients.
In conclusion, this study reports on the construction and antitumor efficacy of a novel, transcriptionally driven OV with unsurpassed antitumor efficacy and encourages its further development as a potent therapeutic agent for patients.
Materials and Methods
Cell lines and viruses. Human normal astrocytes, hepatocytes, human umbilical vein endothelial cells, and HDMEC were purchased from ScienCell (Sandiego, CA). Vero cells were obtained from ATCC (Manassas, VA). U251, LN229, T98G, Gli36Δ5, have been cultured in our laboratory and U251T3 cells were obtained as a tumorigenic clone of U251 cells by serially passaging these cells three times in mice. U87ΔEGFR cell line expresses a truncated, constitutively active, mutant form of epidermal growth factor receptor (EGFRvIII), and has been previously described.34 X12 primary tumor derived cells were obtained from Dr Sarkaria, and were subcloned to express green fluorescent protein to generate X12-V2 (Mayo Clinic, Rochester, MN).30 All the cells were evaluated for their nestin expression by reverse transcriptase-PCR as described (Supplementary Figure S1).9 The construction and efficacy of RAMBO, a Vstat120-expressing OV within the context of rHSVQ1, a first generation OV deleted for both copies of ICP34.5 and disrupted for ICP6, and rQnestin34.5, a transcriptionally driven OV-expressing ICP34.5 under the control of glioma-specific nestin promotor, have been previously described.5,9 To generate 34.5ENVE, the expression cassette encoding for Vstat120 gene under the control of the viral IE4/5 promotor and ICP34.5 under the regulation of nestin enhancer driven promotor was inserted into fHSVQ using HSVQuik technology as previously described.12 All viruses were propagated in Vero cells. Three days after infection, secreted virus and virus-infected Vero cells were harvested and subjected to three cycles of freeze-thaw to release the viruses completely, and cell debris was cleared by centrifugation (4,000g, 20 minutes). Virus was filtered to remove cell debris and pelleted by centrifugation at 13,000g for 1 hours. The titer (plaque-forming units (pfu)/ml) of the resulting virus was determined by pfu assay in Vero cells.12
Cell viability and virus replication assays. To measure OV-mediated cytotoxicity in 96-well plates, cells were infected with the indicated virus at the indicated multiplicity of infection. Seventy-two hours after infection, viable cells were measured by a standard crystal violet assay as described.5 For virus replication assays, the indicated glioma cells were infected at an multiplicity of infection of 0.01 for 2 hours, washed and media replaced. Three days following infection, cells and supernatant were harvested and the number of infectious virus particles present was determined by performing a standard pfu assay on Vero cells.
In vitro endothelial cell assays. U251 glioma cells were infected with the indicated virus at an multiplicity of infection of 2. After 14 hours, CM was harvested and cellular debris and free-floating virions were removed by centrifugation (27,700g for 1 hour). The CM was then concentrated 100-fold in Amicon Ultra centrifuge tubes (Millipore, Billerica, MA), and 0.4% of immunoglobulin G was added to neutralize contaminated OV. Endothelial cell migration assays were performed using transwell chambers (8-µm pore size, from Corning Costar (Cambridge, MA) coated with 0.1% fibronectin as previously described.5 Tube formation assay was performed as described previously.35 Briefly, HDMECs were grown on growth factor-reduced Matrigel (Collaborative Biomedical Products, Bedford, MA). Cells were then allowed to form tubes for 4 hours at 37 °C, and photographed (×200). Pictures of the formed tubes (200 µm or larger, and connected at both ends) were quantified by counting 10 microscopic view/well, and the data presented as the averages of four wells.
Antibodies. For western blot analysis: anti-brain angiogenesis inhibitor 1 antibodies were raised as described previously,26 antihuman GAPDH (ab9484) and anti-ICP4 (ab6514) were purchased from Abcam (Cambridge, MA), and anti-eIF2α (9722) and anti-phosphor-eIF2α (9721) were obtained from Cell Signaling Technology (Beverly, MA). To observe MVD, tumor sections were treated with purified rat anti-mouse CD31 (Pharmingen, San Jose, CA) to visualize endothelial cells lining the blood vessels (n = 3 mice/group), and then with biotin-conjugated goat anti-rat immunoglobulin G (BD Biosciences Pharmingen, San Diego, CA). The three most vascularized areas within the tumor (“hot spots”) were chosen at low magnification, and vessels were counted under a representative high-magnification (×200) field in each view field.36 Mean MVD was calculated as the average of counts/view field in three hot spot areas as described by Dr Folkman.14 Vessels at the periphery of the tumor were disregarded in the MVD counts. The MVD for each group was then averaged together (n = 2–4 sections/tumor, and n = 3 tumors/group) to get the final count ± SEM.
Animal surgery. All animal experiments were performed in accordance with the Subcommittee on Research Animal Care of The Ohio State University guidelines and have been approved by the institutional review board. Six- to eight-week-old Female athymic nu/nu mice (Charles River Laboratories, Frederick, MD), were used for all tumor studies.
For subcutaneous tumors, nude mice were implanted with 1.5 × 10⁷ U251T3 glioma cells into the rear flank. When tumors reached an average size of 250 mm3, mice were administered PBS, or the indicated virus by direct intratumoral injection (5 × 10⁵ pfu) on days 1 and 3. Tumor volume was calculated using the following formula: volume = 0.5 LW2 as described.37
For intracranial tumor studies, anesthetized nude mice were fixed in a stereotactic apparatus, and a burr hole was drilled at 2-mm lateral to the bregma, to a depth of 3 mm. U87ΔEGFR (1 × 10⁵), X12-V2 (3 × 10⁵), or Gli36Δ5 (1 × 10⁵) glioma cells were implanted. On day 7, 10, and 7 after U87ΔEGFR, X12-V2 or Gli36Δ5 glioma cell implantation, respectively, the mice were anesthetized again and stereotactically inoculated with 5 × 10⁴ pfu of the indicated virus at the same location. Animals were observed daily and were euthanized at the indicated time points or when they showed signs of morbidity.
DCE-MRI imaging. Mice-bearing intracranial tumors were treated with PBS or the indicated virus on day 10 after tumor cell implantation. Anatomic imaging was done on day 9 (pretreatment), on day 13 (3 days post-treatment), and on day 16 (6 days post-treatment), using T2-weighted RARE imaging sequence (TR = 2,500 ms, TE = 12 ms, rare factor = 8, navgs = 4). The imaging was performed using a Bruker Biospin 94/30 magnet (Bruker Biospin, Karlsruhe Germany). For dynamic contrast-enhanced imaging (DCE-MRI), anaesthetized mice were injected with 0.5 mmol/kg Magnevist (Bayer Health Care Pharmaceuticals, Wayne, NJ) Gd-DTPA contrast agent. A 2.0-cm diameter receive-only mouse brain coil was placed over the head, and the mouse bed with surface coil was placed inside a 70-mm diameter linear volume coil. DCE data were collected using a FLASH sequence (TR = 135.8 ms, TE = 2.4, flip angle = 50°). Several baseline images were collected before the bolus of Gd-DTPA was injected through the tail vein catheter. Images were collected after Gd-DTPA injection for ~30 minutes. The acquisition parameters for both the T1- and T2-weighted multislice scans were as follows: FOV = 20 mm × 20 mm, slice thickness = 1.0 mm, matrix size = 256 × 256.
For data analysis, a region-of-interest (ROI) that included the tumor was manually outlined using the T2-weighted images. Tumor volumes were calculated from the outlined ROI. Gd-DTPA concentrations were measured for all voxels within the ROI using the method described.38 A fixed value of T1(0) was chosen as 2,029 based on T1 measurements made in normal mouse brain at 9.4T.39 C(t) was calculated for each voxel within the ROI and the average for the entire ROI was calculated. The integrated area under the curve (IAUC) was calculated from the mean Gd-DTPA C(t) curve postinjection and the cumulative IAUC (CIAUC) was calculated from the IAUC. The mean C(t), IAUC, and CIAUC curves were evaluated and compared for the rQnestin34.5, 34.5ENVE, and PBS-treated mice at each imaging time point. The vascular input function required for the pharmokinetic modeling was obtained by measuring signal intensity in the superficial temporal vein within the same image slices as those of the tumor. A two-compartment general kinetic model was used for analyzing the distribution and flow of gadolinium in the tumor. The rate constant, Ktrans, and the extravascular exctracellular space, ve, were determined by nonlinear curve fitting the Gd concentration, C(t), over a 20-minute time period after Gd injection. Color-coded maps for Ktrans and ve were created to visualize the spatial distribution of Gd in the tumor. Histograms of Ktrans and ve for the entire tumors were calculated and median values were compared between the treatment groups.
Statistical analysis. Student's t-test was used to analyze changes in cell killing, HDMEC transwell migration, tube formation assay data, and changes in MVD. A P < 0.05 was considered statistically significant. In the survival analysis, Kaplan–Meier curves were plotted and compared using the log rank test. Spearman's rank correlation coefficient was calculated and compared for the correlation analysis on the fold change (Log2) in virus replication of rQnestin34.5/34.5ENVE compared to rHSVQ1. Holm's procedure was used to correct the P value for multiple comparisons. A P < 0.05 was considered statistically significant. All statistical analyses were performed with the use of SPSS statistical software (version 14.0; SPSS, Chicago, IL), or SAS (version 9.2; SAS Institute, Cary, NC).
SUPPLEMENTARY MATERIAL Figure S1. RT-PCR analysis of the indicated glioma cell lines for relative nestin expression. Figure S2. (a–d) Color-coded parametric images Ktrans (a–b) and ve (c–d) of coronal sections of mice 3 days after treatment with rQnestin34.5 (a, c), or 34.5ENVE (b, d).
Acknowledgments
This work was supported by funding from the National Institutes of Health grant (1R01NS064607, and 1R01CA150153 to B.K.; NS045758 to C.B.) and the National Research Foundation of Korea Grant funded by the Korean Government (NRF-2009-352-E00035 to J.Y.Y).
Supplementary Material
RT-PCR analysis of the indicated glioma cell lines for relative nestin expression.
(a–d) Color-coded parametric images Ktrans (a–b) and ve (c–d) of coronal sections of mice 3 days after treatment with rQnestin34.5 (a, c), or 34.5ENVE (b, d).
REFERENCES
- Stupp R, Mason WP, van den Bent MJ, Weller M, Fisher B, Taphoorn MJ, European Organisation for Research and Treatment of Cancer Brain Tumor and Radiotherapy Groups et al. National Cancer Institute of Canada Clinical Trials Group. Radiotherapy plus concomitant and adjuvant temozolomide for glioblastoma. N Engl J Med. 2005;352:987–996. doi: 10.1056/NEJMoa043330. [DOI] [PubMed] [Google Scholar]
- Markert JM, Liechty PG, Wang W, Gaston S, Braz E, Karrasch M.et al. (2009Phase Ib trial of mutant herpes simplex virus G207 inoculated pre-and post-tumor resection for recurrent GBM Mol Ther 17199–207. [DOI] [PMC free article] [PubMed] [Google Scholar]
- Markert JM, Medlock MD, Rabkin SD, Gillespie GY, Todo T, Hunter WD.et al. (2000Conditionally replicating herpes simplex virus mutant, G207 for the treatment of malignant glioma: results of a phase I trial Gene Ther 7867–874. [DOI] [PubMed] [Google Scholar]
- Post DE, Khuri FR, Simons JW, Van Meir EG. Replicative oncolytic adenoviruses in multimodal cancer regimens. Hum Gene Ther. 2003;14:933–946. doi: 10.1089/104303403766682205. [DOI] [PubMed] [Google Scholar]
- Hardcastle J, Kurozumi K, Dmitrieva N, Sayers MP, Ahmad S, Waterman P.et al. (2010Enhanced antitumor efficacy of vasculostatin (Vstat120) expressing oncolytic HSV-1 Mol Ther 18285–294. [DOI] [PMC free article] [PubMed] [Google Scholar]
- Prabhakar S, Messerli SM, Stemmer-Rachamimov AO, Liu TC, Rabkin S, Martuza R.et al. (2007Treatment of implantable NF2 schwannoma tumor models with oncolytic herpes simplex virus G47Delta Cancer Gene Ther 14460–467. [DOI] [PubMed] [Google Scholar]
- Hardcastle J, Kurozumi K, Chiocca EA., and, Kaur B. Oncolytic viruses driven by tumor-specific promoters. Curr Cancer Drug Targets. 2007;7:181–189. doi: 10.2174/156800907780058880. [DOI] [PubMed] [Google Scholar]
- Wojton J., and, Kaur B. Impact of tumor microenvironment on oncolytic viral therapy. Cytokine Growth Factor Rev. 2010;21:127–134. doi: 10.1016/j.cytogfr.2010.02.014. [DOI] [PMC free article] [PubMed] [Google Scholar]
- Kambara H, Okano H, Chiocca EA., and, Saeki Y. An oncolytic HSV-1 mutant expressing ICP34.5 under control of a nestin promoter increases survival of animals even when symptomatic from a brain tumor. Cancer Res. 2005;65:2832–2839. doi: 10.1158/0008-5472.CAN-04-3227. [DOI] [PubMed] [Google Scholar]
- Kambara H, Saeki Y., and, Chiocca EA. Cyclophosphamide allows for in vivo dose reduction of a potent oncolytic virus. Cancer Res. 2005;65:11255–11258. doi: 10.1158/0008-5472.CAN-05-2278. [DOI] [PubMed] [Google Scholar]
- Mahller YY, Williams JP, Baird WH, Mitton B, Grossheim J, Saeki Y.et al. (2009Neuroblastoma cell lines contain pluripotent tumor initiating cells that are susceptible to a targeted oncolytic virus PLoS ONE 4e4235. [DOI] [PMC free article] [PubMed] [Google Scholar]
- Terada K, Wakimoto H, Tyminski E, Chiocca EA., and, Saeki Y. Development of a rapid method to generate multiple oncolytic HSV vectors and their in vivo evaluation using syngeneic mouse tumor models. Gene Ther. 2006;13:705–714. doi: 10.1038/sj.gt.3302717. [DOI] [PubMed] [Google Scholar]
- Chou J, Chen JJ, Gross M., and, Roizman B. Association of a M® 90,000 phosphoprotein with protein kinase PKR in cells exhibiting enhanced phosphorylation of translation initiation factor eIF-2α and premature shutoff of protein synthesis after infection with gamma 134.5- mutants of herpes simplex virus 1. Proc Natl Acad Sci USA. 1995;92:10516–10520. doi: 10.1073/pnas.92.23.10516. [DOI] [PMC free article] [PubMed] [Google Scholar]
- Weidner N, Semple JP, Welch WR., and, Folkman J. Tumor angiogenesis and metastasis–correlation in invasive breast carcinoma. N Engl J Med. 1991;324:1–8. doi: 10.1056/NEJM199101033240101. [DOI] [PubMed] [Google Scholar]
- Kerwin WS, O'Brien KD, Ferguson MS, Polissar N, Hatsukami TS., and, Yuan C. Inflammation in carotid atherosclerotic plaque: a dynamic contrast-enhanced MR imaging study. Radiology. 2006;241:459–468. doi: 10.1148/radiol.2412051336. [DOI] [PMC free article] [PubMed] [Google Scholar]
- Egeland TA, Gaustad JV, Galappathi K., and, Rofstad EK. Magnetic resonance imaging of tumor necrosis. Acta Oncol. 2011;50:427–434. doi: 10.3109/0284186X.2010.526633. [DOI] [PubMed] [Google Scholar]
- Friedman A, Tian JP, Fulci G, Chiocca EA., and, Wang J. Glioma virotherapy: effects of innate immune suppression and increased viral replication capacity. Cancer Res. 2006;66:2314–2319. doi: 10.1158/0008-5472.CAN-05-2661. [DOI] [PubMed] [Google Scholar]
- Ishiwata T, Matsuda Y., and, Naito Z. Nestin in gastrointestinal and other cancers: effects on cells and tumor angiogenesis. World J Gastroenterol. 2011;17:409–418. doi: 10.3748/wjg.v17.i4.409. [DOI] [PMC free article] [PubMed] [Google Scholar]
- Kaur B, Cripe TP., and, Chiocca EA. “Buy one get one free”: armed viruses for the treatment of cancer cells and their microenvironment. Curr Gene Ther. 2009;9:341–355. doi: 10.2174/156652309789753329. [DOI] [PMC free article] [PubMed] [Google Scholar]
- Kaur B, Brat DJ, Calkins CC., and, Van Meir EG. Brain angiogenesis inhibitor 1 is differentially expressed in normal brain and glioblastoma independently of p53 expression. Am J Pathol. 2003;162:19–27. doi: 10.1016/S0002-9440(10)63794-7. [DOI] [PMC free article] [PubMed] [Google Scholar]
- Nishimori H, Shiratsuchi T, Urano T, Kimura Y, Kiyono K, Tatsumi K.et al. (1997A novel brain-specific p53-target gene, BAI1, containing thrombospondin type 1 repeats inhibits experimental angiogenesis Oncogene 152145–2150. [DOI] [PubMed] [Google Scholar]
- Fukushima Y, Oshika Y, Tsuchida T, Tokunaga T, Hatanaka H, Kijima H.et al. (1998Brain-specific angiogenesis inhibitor 1 expression is inversely correlated with vascularity and distant metastasis of colorectal cancer Int J Oncol 13967–970. [DOI] [PubMed] [Google Scholar]
- Hatanaka H, Oshika Y, Abe Y, Yoshida Y, Hashimoto T, Handa A.et al. (2000Vascularization is decreased in pulmonary adenocarcinoma expressing brain-specific angiogenesis inhibitor 1 (BAI1) Int J Mol Med 5181–183. [DOI] [PubMed] [Google Scholar]
- Lee JH, Koh JT, Shin BA, Ahn KY, Roh JH, Kim YJ.et al. (2001Comparative study of angiostatic and anti-invasive gene expressions as prognostic factors in gastric cancer Int J Oncol 18355–361. [PubMed] [Google Scholar]
- Kudo S, Konda R, Obara W, Kudo D, Tani K, Nakamura Y.et al. (2007Inhibition of tumor growth through suppression of angiogenesis by brain-specific angiogenesis inhibitor 1 gene transfer in murine renal cell carcinoma Oncol Rep 18785–791. [PubMed] [Google Scholar]
- Kaur B, Brat DJ, Devi NS., and, Van Meir EG. Vasculostatin, a proteolytic fragment of brain angiogenesis inhibitor 1, is an antiangiogenic and antitumorigenic factor. Oncogene. 2005;24:3632–3642. doi: 10.1038/sj.onc.1208317. [DOI] [PubMed] [Google Scholar]
- Kaur B, Cork SM, Sandberg EM, Devi NS, Zhang Z, Klenotic PA.et al. (2009Vasculostatin inhibits intracranial glioma growth and negatively regulates in vivo angiogenesis through a CD36-dependent mechanism Cancer Res 691212–1220. [DOI] [PMC free article] [PubMed] [Google Scholar]
- Klenotic PA, Huang P, Palomo J, Kaur B, Van Meir EG, Vogelbaum MA.et al. (2010Histidine-rich glycoprotein modulates the anti-angiogenic effects of vasculostatin Am J Pathol 1762039–2050. [DOI] [PMC free article] [PubMed] [Google Scholar]
- Koh JT, Kook H, Kee HJ, Seo YW, Jeong BC, Lee JH.et al. (2004Extracellular fragment of brain-specific angiogenesis inhibitor 1 suppresses endothelial cell proliferation by blocking αvβ5 integrin Exp Cell Res 294172–184. [DOI] [PubMed] [Google Scholar]
- Kurozumi K, Hardcastle J, Thakur R, Shroll J, Nowicki M, Otsuki A.et al. (2008Oncolytic HSV-1 infection of tumors induces angiogenesis and upregulates CYR61 Mol Ther 161382–1391. [DOI] [PMC free article] [PubMed] [Google Scholar]
- Aghi M, Rabkin SD., and, Martuza RL. Angiogenic response caused by oncolytic herpes simplex virus-induced reduced thrombospondin expression can be prevented by specific viral mutations or by administering a thrombospondin-derived peptide. Cancer Res. 2007;67:440–444. doi: 10.1158/0008-5472.CAN-06-3145. [DOI] [PubMed] [Google Scholar]
- Kurozumi K, Hardcastle J, Thakur R, Yang M, Christoforidis G, Fulci G.et al. (2007Effect of tumor microenvironment modulation on the efficacy of oncolytic virus therapy J Natl Cancer Inst 991768–1781. [DOI] [PubMed] [Google Scholar]
- Breitbach CJ, Paterson JM, Lemay CG, Falls TJ, McGuire A, Parato KA.et al. (2007Targeted inflammation during oncolytic virus therapy severely compromises tumor blood flow Mol Ther 151686–1693. [DOI] [PubMed] [Google Scholar]
- Narita Y, Nagane M, Mishima K, Huang HJ, Furnari FB., and, Cavenee WK. Mutant epidermal growth factor receptor signaling down-regulates p27 through activation of the phosphatidylinositol 3-kinase/Akt pathway in glioblastomas. Cancer Res. 2002;62:6764–6769. [PubMed] [Google Scholar]
- Yoo JY, Kim JH, Kwon YG, Kim EC, Kim NK, Choi HJ.et al. (2007VEGF-specific short hairpin RNA-expressing oncolytic adenovirus elicits potent inhibition of angiogenesis and tumor growth Mol Ther 15295–302. [DOI] [PubMed] [Google Scholar]
- Choi WW, Lewis MM, Lawson D, Yin-Goen Q, Birdsong GG, Cotsonis GA.et al. (2005Angiogenic and lymphangiogenic microvessel density in breast carcinoma: correlation with clinicopathologic parameters and VEGF-family gene expression Mod Pathol 18143–152. [DOI] [PubMed] [Google Scholar]
- Yoo JY, Kim JH, Kim J, Huang JH, Zhang SN, Kang YA.et al. (2008Short hairpin RNA-expressing oncolytic adenovirus-mediated inhibition of IL-8: effects on antiangiogenesis and tumor growth inhibition Gene Ther 15635–651. [DOI] [PubMed] [Google Scholar]
- Haacke EM, Filleti CL, Gattu R, Ciulla C, Al-Bashir A, Suryanarayanan K.et al. (2007New algorithm for quantifying vascular changes in dynamic contrast-enhanced MRI independent of absolute T1 values Magn Reson Med 58463–472. [DOI] [PubMed] [Google Scholar]
- Kuo YT, Herlihy AH, So PW, Bhakoo KK., and, Bell JD. In vivo measurements of T1 relaxation times in mouse brain associated with different modes of systemic administration of manganese chloride. J Magn Reson Imaging. 2005;21:334–339. doi: 10.1002/jmri.20285. [DOI] [PubMed] [Google Scholar]
Associated Data
This section collects any data citations, data availability statements, or supplementary materials included in this article.
Supplementary Materials
RT-PCR analysis of the indicated glioma cell lines for relative nestin expression.
(a–d) Color-coded parametric images Ktrans (a–b) and ve (c–d) of coronal sections of mice 3 days after treatment with rQnestin34.5 (a, c), or 34.5ENVE (b, d).


