Abstract
Three-dimensional impedance maps (3DZMs) are virtual volumes of acoustic impedance values constructed from histology to represent tissue microstructure acoustically. From the 3DZM, the ultrasonic backscattered power spectrum can be predicted and model based scatterer properties, such as effective scatterer diameter (ESD), can be estimated. Additionally, the 3DZM can be exploited to visualize and identify possible scattering sites, which may aid in the development of more effective scattering models to better represent the ultrasonic interaction with underlying tissue microstructure. In this study, 3DZMs were created from a set of human fibroadenoma samples. ESD estimates were made assuming a fluid-filled sphere form factor model from 3DZMs of volume 300 × 300 × 300 µm. For a collection of 33 independent human fibroadenoma tissue samples, the ESD was estimated to be 111 ± 40.7 µm. The 3DZMs were then investigated visually to identify possible scattering sources which conformed to the estimated model scatterer dimensions. This estimation technique allowed a better understanding of the spatial distribution and variability of the estimates throughout the volume.
Index Terms: Biomedical ultrasound, tissue modeling, ultra-sonic backscatter analysis, ultrasound simulation
I. Introduction
Medical ultrasound provides a safe, portable, and inexpensive imaging modality when compared to other common modalities such as X-ray, computed tomography, or magnetic resonance imaging [1]. These advantages clearly motivate the development of additional diagnostic functionality in medical ultrasound. While conventional ultrasound images provide mainly qualitative depictions of tissue macrostructure, quantitative ultrasound (QUS) provides quantitative information about tissue microstructure. This information could greatly improve the diagnostic functionality in medical ultrasound. This process, however, depends on the use of appropriate models for ultrasonic scattering by tissue microstructure [2].
As a means to investigate such ultrasonic scattering, a method was previously developed to create computational acoustic models of tissue microstructure [3]. These models, called three-dimensional impedance maps (3DZMs), provide a means to combine ultrasonic characterization of tissue with histological evaluation of the underlying tissue structure. This study investigates the application of these models to a common type of benign human breast tumor, the fibroadenoma.
A. Quantitative Ultrasound
Conventional ultrasound images are derived from backscattered radio-frequency (RF) echo signals, which result from scattering by tissue macro- and microstructure with spatially varying acoustic properties. Typically, the received RF signals are envelope detected to produce an image; this processing removes frequency-dependent information from the RF signal [4].
Some QUS techniques use the frequency-dependent information from the RF echo signal to deduce quantitative information related to the properties of the tissue microstructure. This frequency-dependent information can provide details about statistical properties of scattering structures, such as effective scatterer diameter (ESD) and effective acoustic concentration. Parameterization of ultrasonic backscatter has been investigated previously as a means to extend the diagnostic capability of ultrasound [5], [6] and has demonstrated the ability to quantify ocular, liver, prostate, renal, and cardiac tissues [7]. To attain more meaningful results, however, the relationship between backscattered frequency-dependent information and underlying tissue properties must be better understood.
B. Three-Dimensional Impedance Maps
A 3DZM is an acoustic, computational model of tissue and a tool to aid in the understanding of small scale acoustic scattering. Currently, 3DZMs are volumes constructed from properly aligned and reconstructed sets of histological images. The value of each volume element (voxel) of the 3DZM represents an acoustic impedance value.
For weakly scattering media (the acoustic impedance of scattering objects is very close to the acoustic impedance of the background material), the autocorrelation function of the spatial impedance map can be related to the ultrasonic backscatter of the media by the spatial Fourier transform without the utilization of empirical ultrasound data [3], [5], and [6]. In this way, 3DZMs can be used to study both the ultrasonic backscatter and the histological characteristics of a particular medium. This duality illustrates the utility of 3DZMs for the study of ultrasonic scattering in tissue as it relates ultrasonic backscatter to actual histological features of tissue microstructure.
This study expands upon the 3DZM work previously done by Mamou et al. [3]. The 3DZM creation process has been updated, giving improvements in both performance and computational efficiency. Additionally, this study is the first time a large number of tissue samples have been analyzed via 3DZM. 33 human fibroadenomas were analyzed with 3DZMs, without ultrasound data, giving insight into both the 3DZM technique as well as quantitatively characterizing these benign tumors.
II. Theory
A. Quantitative Ultrasound
Ultrasonic scattering occurs when an incident pressure wave interacts with a volume having spatially varying acoustic properties. Ultrasonic backscatter is defined as the portion of this scattered sound that propagates in the opposite direction of the incident wave, which is of special interest for pulse-echo ultrasound [1].
For a plane wave of unit amplitude, the far field backscattered pressure from a scattering volume can be described by
| (1) |
where r is the distance to the scattering site, k is the spatial frequency or acoustic wave number (defined as the ratio of the angular frequency of the acoustic wave to the speed of sound in the medium), and Φ(k) is an angle distribution function [6], [8]. The acoustic intensity for the backscattered wave in (1) can be expressed by
| (2) |
where A is a proportionality constant [1]. Through methods described in [3], [5], and [6], the backscattered intensity can be computed as a function of frequency and related to the acoustic impedance of the underlying tissue. By making the assumption of weak scattering, which is appropriate in soft tissue, (2) can be rewritten as
| (3) |
where A′ is a new proportionality constant and S(k) is the squared magnitude of the Fourier transform of a relative impedance function [13]. The equation describing S(k) is
| (4) |
where z0 is the acoustic impedance of the background material and z(r) is the spatially varying acoustic impedance at position r. The background impedance is defined as
| (5) |
where ρ0 is the density and κ0 is the compressibility of the background material. Likewise, the scatterer impedance is defined as
| (6) |
where ρ(r) is the spatially varying density and κ(r) is the spatially varying compressibility at position r. The connection between backscattered intensity and the acoustic impedance map of tissue is described by (4). This allows for the estimation of ultrasound parameters without necessitating the acoustic wave simulation that has been done in other impedance map work [9].
1) Intensity Form Factor: Intensity form factors (FFs) are functions that describe the behavior of the backscattered intensity due to a single scattering volume as a function of k [10]. FFs model the deviation in the frequency dependence of the backscatter coefficient for a particular scattering volume from the frequency dependence observed for a Rayleigh scatterer (which has only a k4 dependence). The development of the intensity form factor in [11] and [12] considers identical fluid spheres of diameter d randomly distributed in a homogeneous background. If a scattering volume has spherical symmetry, then the corresponding FF function will only depend on the scatterer size, because the orientation of the volume is not important. In this case, scatterer size refers to either the effective diameter for discrete scatterers or to the effective correlation length for scatterers that are continuously varying functions [10]. In this situation, for a fluid-filled sphere, the backscatter coefficient is given as
| (7) |
where Vs is the effective scatterer volume, is the scattering strength, and j1 is the first-order spherical bessel function of the first kind. In the long wavelength or Rayleigh limiting case, the backscatter coefficient is defined as
| (8) |
The backscatter coefficient σb can be written as a function of σ0
| (9) |
where F(k, d) is the intensity form factor. By substituting (7) and (8) into (9), the FF for a fluid-filled sphere scatterer is given by
| (10) |
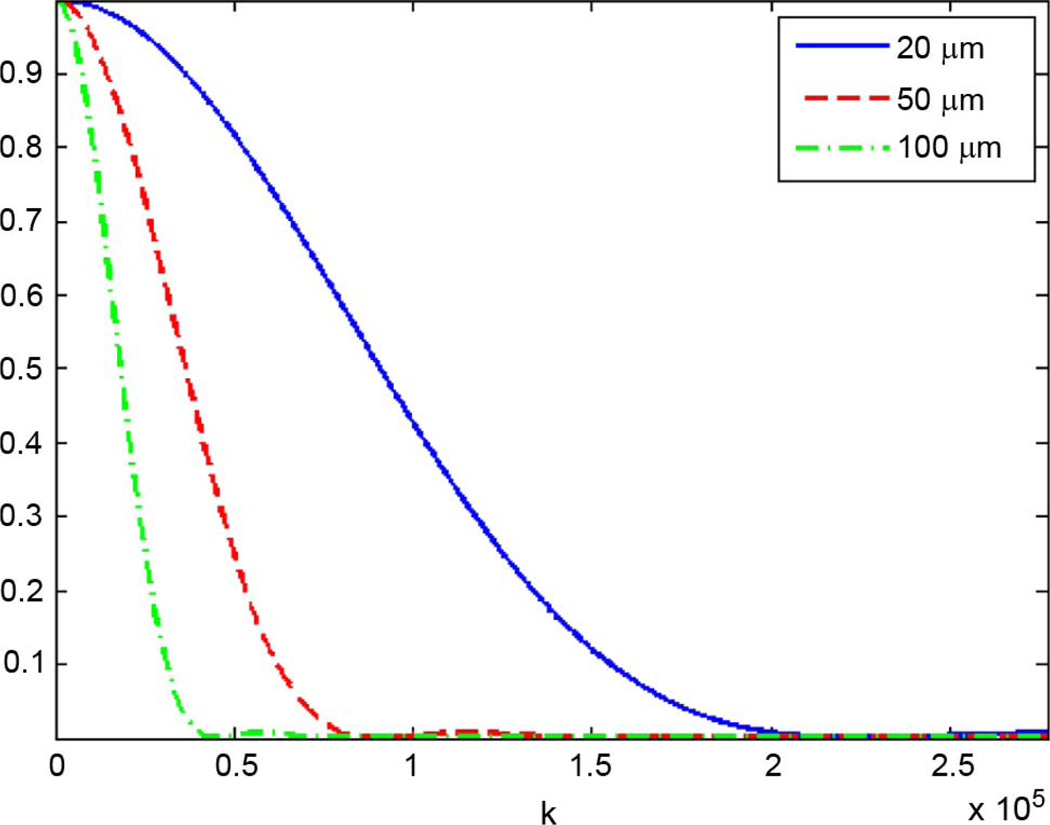
Regardless of the scattering volume geometry, the corresponding FF always approaches unity as k approaches zero because as the wavelength becomes very large, the scatterer appears as a point scatterer. Fig. 1 shows a plot of the fluid-filled sphere FF as a function of spatial frequency k for several values of d.
Fig. 1.
Fluid-filled form factor for d = 25, 50, 100 µm.
Intensity form factors are related to the geometry of the scatterer by the Fourier transform of the 3-D spatial autocorrelation function of the acoustic impedance distribution [11], or equivalently by the squared magnitude of the 3-D spatial Fourier transform of the impedance distribution (due to the Wiener–Khintchine theorem) [13]. Because of this, FFs are proportional to the power spectrum S(k) of a scattering volume as described by (4). This motivates the use of 3DZMs in tissue acoustic analysis. By constructing the spatial distribution of the impedance for a tissue volume, the corresponding ultrasonic backscatter power spectrum can be estimated. The 3DZM method uses color information from histology of a given tissue sample to infer a spatially varying acoustic impedance distribution in the volume. By estimating the power spectrum from the data-specific 3DZM, FFs can be used as scattering models to extract diagnostically useful QUS model-based parameters, such as ESD.
III. Acoustic Modeling of Tissue
A. 3DZM Construction
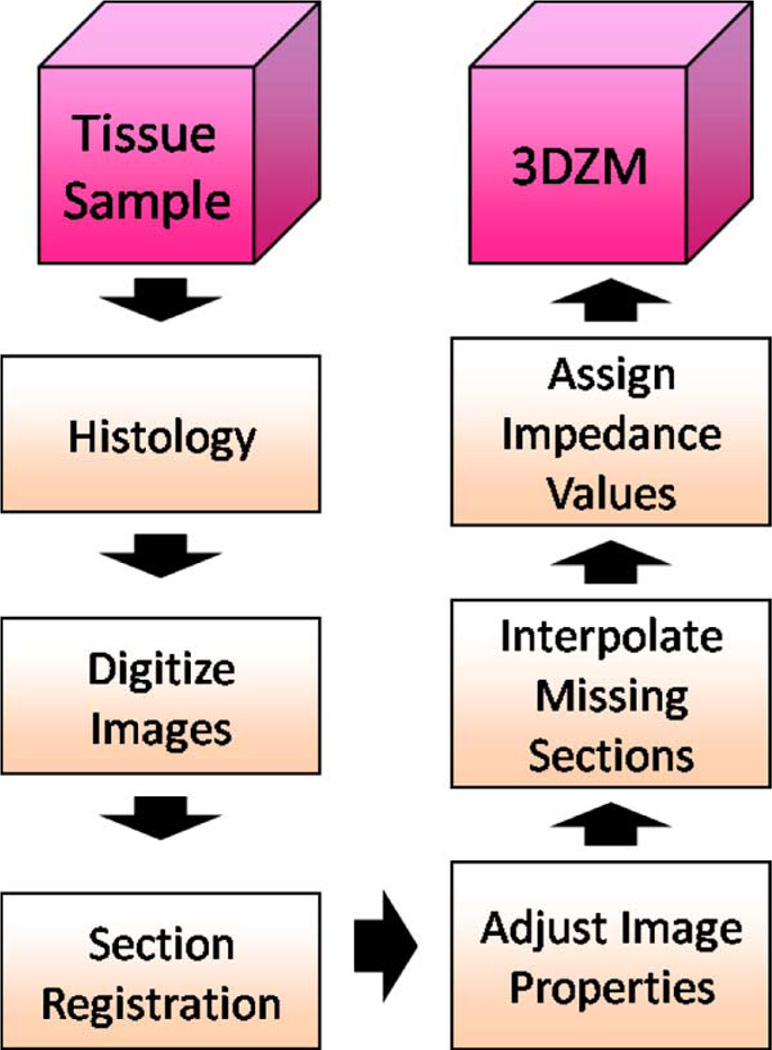
A 3DZM is a computational phantom of which each element represents an estimate of the acoustic impedance value of the underlying medium at a particular location. A technique for the creation of 3DZMs was developed previously by Mamou et al. [3] and [14]. In the current study, a novel 3DZM construction process has been developed that improves upon the previous method in terms of both performance and computational efficiency. A block diagram of the improved process is shown in Fig. 2.
Fig. 2.
3DZM creation process block diagram.
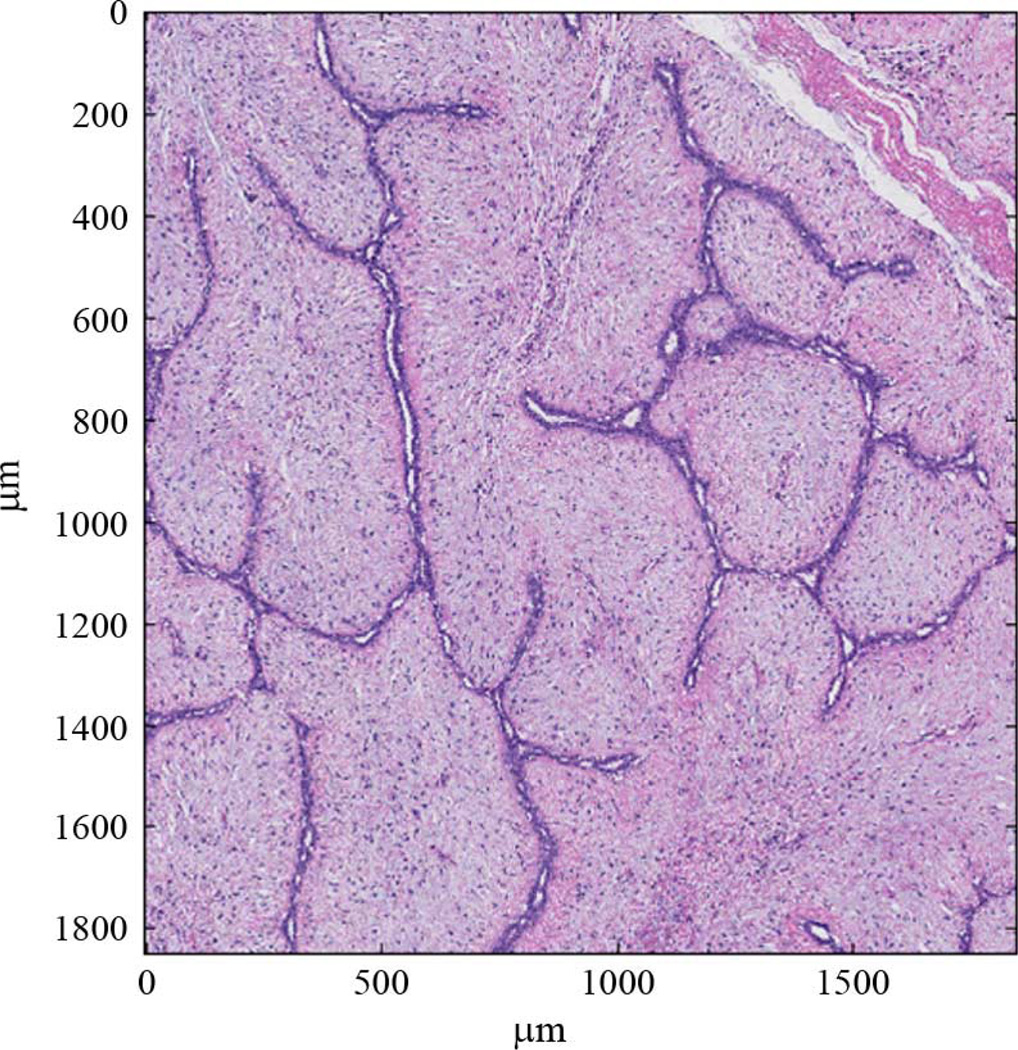
The goal of 3DZM creation is to build a computational model that acoustically mimics real tissue. To accomplish this objective, each 3DZM is constructed from a tissue sample. The tissue used in this study was obtained from archived surgical specimens that had been fixed in 10% buffered formalin and paraffin embedded. Typically, fixation began within 2–4 h of surgery and the tissue was fixed at least overnight. The paraffin-embedded tissue blocks were sectioned at a thickness of 3 µm, placed on glass slides and stained with hematoxylin and eosin (H&E) as part of a standard histology process. Previous studies successfully compared 3DZMs constructed from fibroadenomas in rats using H&E stained sections with actual ESD estimates derived from ultrasound backscatter [3], [7]. The success of this earlier study prompted an evaluation of 3DZMs from human fibroadenomas with the goal of identifying scattering sources using the same techniques. H&E stain was used due to its popularity, ease of analysis by pathologists (Harter and Sarwate are board-certified pathologists) and success in earlier studies with rat fibroadenomas. Other stains exist that may yield additional information and insight into the impedance structure of tissues. H&E was the first stain chosen for the 3DZM studies and in future studies, analysis using different stains will occur. After staining, each section was individually digitized using a NanoZoomer HT slide scanner (Hamamatsu, Hamamatsu City, Japan) at a pixel resolution of 0.46 µm. The resulting images were quantized in red, green and blue color fields (RGB color), at 24 bits per pixel. Fig. 3 shows a portion of one digitized fibroadenoma section.
Fig. 3.
An H&E stained fibroadenoma 3-µm-thick section that is 1800 µm × 1800 µm.
In order for this set of 2-D images to be converted into a 3-D volume, artifacts inherent to the preparation process must be corrected. During the histology process, the individual sections undergo a certain degree of unintended shrinking and shearing and are placed on glass slides in a variety of orientations. These 2-D images need to be properly registered to adjacent sections so that their positions within the original 3-D volume are properly restored. Due to the size of the individual images (in this study, the high resolution tissue images often reached 30 000 pixels on a side) and the fact that only a small portion of the total slice will be present inside a single 3DZM, the registration process is broken into two stages. Each stage operates at a different resolution level. The first registration stage provides a very rough alignment at the global level. Performing registration at this level provides the benefit of being able to use the edges of the tissue sample to align adjacent sections. Each image is decimated until it has roughly 100 rows of pixels and has the same aspect ratio as the full size image. Rigid registration parameters (translation and rotation) are estimated using a correlation metric. For two adjacent images I and J, the correlation metric is given by
| (11) |
where μ is the mean and σ is the standard deviation of its respective image. The translation and rotation values that maximize (11) are chosen as the proper alignment values at this resolution and are passed on as initial guesses for the finer resolution registration stages.
For the local, fine resolution registration stage, the deformation model is altered to allow for more complex geometric misalignments. In addition to simple translational and rotational (rigid) registration, the sections must be adjusted for any stretching or shearing that occurred as a result of the slicing, staining, or placement onto each glass slide. An affine model is used to describe the geometric deformations to be corrected and is given for a warped image I′ and the true image I by
| (12) |
| (13) |
where the matrix A describes stretching, shearing and rotational components and the vector b describes translational components of the geometric misalignments. Before the full affine parameter set is optimized, the initial conditions are perturbed through a set of random trials. The translation and rotation parameters are summed with independent uniform random variables ranging from −40 to 40 pixels and −10° to 10°, respectively. After 200 such trials, the set of parameters that result in the best mutual information metric are chosen as initial conditions for the full affine optimization procedure [3]. This random trial stage is important because it reduces the effect of local minima in the affine optimization objective function between the histology images.
Registration parameters for the full affine stage are optimized using an intensity based mean squared error metric [15]. The implementation of the local registration algorithm also takes advantage of a multiresolution optimization scheme, which greatly reduces computation time in addition to improving the registration quality. Instead of optimizing the affine registration parameters on the 3DZM sized image regions (for this study, square regions of 650 × 650 pixels were used for each 3DZM) in a single stage, the optimization is broken into multiresolution stages. These stages begin by optimizing over decimated images and slowly add in the previously removed image data as the registration solution is neared. For the first stage, the registration parameters for two decimated images are estimated through optimization. Once that optimization is complete, the parameters are passed as an initial guess to the next stage, where more of the image data is included. Then the higher resolution images are registered using initial conditions from the previous stage for the optimization. The process is repeated until the full resolution images are registered. By starting with decimated images, the overall registration process improves its robustness to optimization errors involving nonglobal extrema in the optimization function. Additionally, the initial alignments, which are furthest from the global solution, are computed with reduced data sets. This allows for fast convergence to an area near the global solution and the higher resolution stages, which are computationally the most complex, will begin very close to their solution and converge in only a few iterations.
After the tissue sections are geometrically realigned, the photometric properties of the tissue are equalized. Slight variations in the thickness of each section result in varying the uptake of the H&E stain. This artifact of the slide preparation process is corrected by matching the first-order color statistics of each image in the set to a reference. For a warped image I′ and a true image I, the photometric deformation model is given by
| (14) |
where c is the first-order and d is the zeroth-order photometric change. Using this model, both the mean and variance of each individual color field (RGB) are scaled to match the reference values. The recovered true image for a single color field is given by
| (15) |
where μI′ and σI′ are the mean and standard deviation of the warped image and μref and σref are the reference values, which are equal to the average mean and average standard deviation across all warped images, respectively.
Following the registration and photometric adjustment steps, the computed transformations are applied to each image and a volume is assembled. However, 10%–15% of the tissue sections are inadvertently damaged during the normal histology process. This is a result of sections being torn, folded over onto themselves, or otherwise lost. This renders the data from these damaged sections unusable. The missing sections must be filled in to complete the reconstruction of the tissue volume. The missing sections are replaced by interpolation, using cubic Hermite interpolation along each stacked column of pixels and independently for each color field [3].
Finally, each element of the tissue volume must be assigned an acoustic impedance value based on the color value of the pixel, because the H&E staining causes tissue with a greater protein concentration to appear pink and tissue with a greater nucleic acid concentration to appear blue, thus differentiating the underlying tissue components. Impedance values were assigned by associating appropriate acoustic impedance values for each tissue structure with certain color ranges [3]. Tissue areas with eosin staining (indicating protein concentration) range in color from light pink to dark pink, while tissue areas with hematoxylin staining (indicating nucleic acid concentration) range in color from light blue to dark blue. For this work, the pink image elements were assumed to represent cell cytoplasm, while the blue image elements were assumed to represent cell nuclei. Each tissue structure was assigned a bulk materials impedance value, which was then increased or decreased proportionally to the amount of color saturation in each pixel. Image elements that were very light or white were assumed to be fat. Thus, impedance values were assigned based on image color as indicated in Table I. The specific values chosen are somewhat empirical, but based in larger scale studies [16], [17].
TABLE I.
Acoustic Impedance Assignment Scheme
| Color | Tissue Component | Impedance Value Range |
|---|---|---|
| Light to Dark Pink | Cytoplasm | 1.5 – 1.7 Mrayl |
| Light to Dark Blue | Cell Nuclei | 1.8 – 2.0 Mrayl |
| White | Fat | 1.45 Mrayl |
B. Impedance Map Analysis
As a result of the relationship between backscattered intensity and the squared magnitude of the spatial Fourier transform of a medium’s relative impedance distribution, 3DZMs present a useful tool for the study of ultrasonic scattering in tissue. This relationship can be exploited in two ways. First, by assuming some form factor model, an estimate of the ESD in the 3DZM can be obtained. Second, by using the 3DZM to investigate the layout of the tissue microstructure from an acoustic perspective, new scattering models may be developed that may help in physical scatterer identification and better represent underlying tissue structure.
Spectral Estimation: Spectral estimation refers to the signal processing steps taken to compute an estimate of the Fourier transform of the 3-D autocorrelation (power spectrum) of a 3DZM. In this step, the underlying tissue is treated as a random medium, for which it is desired to estimate the statistical power spectrum using the limited spatial samples of the volume.
The 3-D spatial Fourier transform of a volume produces a 3-D function of the spatial frequency vector k = kxx̂ + kyŷ + kzẑ. In the special case of a spherically symmetric scatterer, the Fourier coefficients along each radial path away from k = 0⃖ are equal, regardless of which path is chosen; thus, the value of the 3-D spatial Fourier transform along any such path is equal to the acoustic form factor of the medium, with the wave number . For an M × N × P element 3-D volume f (x, y, z), the 3-D spatial discrete Fourier transform is given by
| (16) |
Using (16), a discretized version of the 3DZM power spectrum from (4) is given by
| (17) |
Coherent scattering adds random variation to the underlying scattering function [6]. Coherent scattering arises from correlations among the inhomogeneities inside the impedance volume. This term is spatially dependent, so different radial paths of the 3-D spatial Fourier transform have different coherent scattering terms. By comparing the 3-D power spectrum of a 3DZM to the 3-D theoretical form factor given by (10), many radial paths are implicitly considered. This serves to reduce the effects of the coherent scattering term during ESD estimation. The weighting term in (17) is necessary because the number of samples in the discrete 3-D power spectrum corresponding to a given spatial frequency magnitude is proportional to the surface area of a sphere with radius k. Without this factor, a disproportionate amount of weight is placed upon high spatial frequency samples during ESD estimation. If improperly weighted, the ESD estimation process will tend toward matching correlation lengths that are not representative of the dominant acoustic scattering structures within the volume.
C. ESD Estimation
ESD estimation is the task of fitting a theoretical FF to the calculated power spectrum of a 3DZM (Appendix). FFs of spherically symmetric scatterers, like the fluid-filled sphere FF described by (10), have a scatter size dependent frequency response. The ESD estimate for a 3DZM is calculated as
| (18) |
where F3DZM is the power spectrum calculated from the 3DZM and FTheo(d) is the theoretical FF as a function of the effective scatterer diameter d. The constraint on the size of d is a result of the size and sampling frequency of the 3DZM. The minimum allowable diameter must be chosen large enough to limit the effects of the original histology image resolution and quantization noise on the estimated diameter. The maximum allowable diameter must be chosen to allow for accurate resolution in the frequency domain for a good estimate of (18). The frequency resolution of the discrete Fourier transform used to calculate F3DZM is given by 1/(NT), where N is the number of samples and T is the sampling period in a given direction through the volume. Because the frequency profile of a typical FF narrows as d increases, the falloff region of the FF may be drastically undersampled for large ESD estimates. This falloff region is the predominant feature of most FFs and an undersampling of this region can greatly affect the robustness of (18). For this study, the allowable range for d̂ was set as 10–180 µm. When considering a ka = 1, this corresponds to an approximate frequency range of 3–50 MHz in tissue. This chosen range forces all ESD estimates to be large with respect to a pixel size, yet small enough to allow for an accurate and robust formulation of (18).
IV. Results
A. Human Fibroadenoma Study
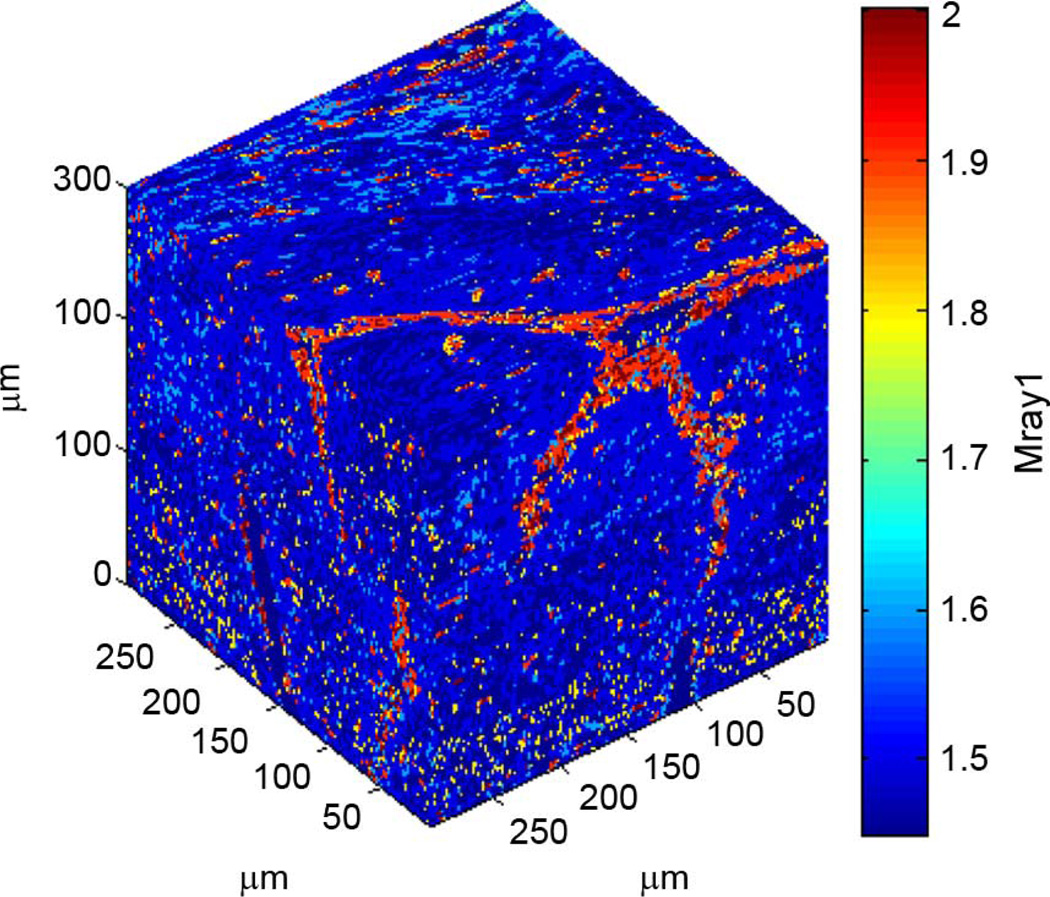
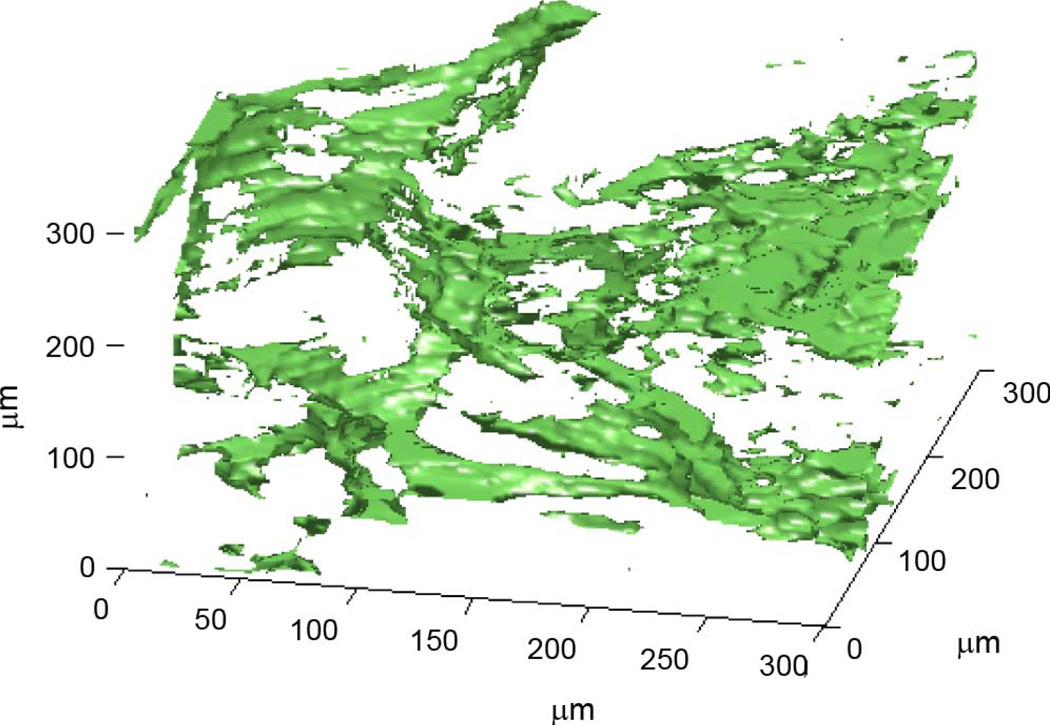
3DZMs were constructed and analyzed for 33 independent human fibroadenoma data sets. No additional information about each data set was known other than the fact that each was pathologically identified as fibroadenoma, i.e., no ultrasonic scan data were available for the samples. For each data set, one 300 × 300 × 300 µm 3DZM was created (Fig. 4). The power spectrum of each 3DZM was estimated and a scattering model was applied in order to extract ESD parameters. The scattering model used for analysis was the fluid-filled sphere FF in (10).
Fig. 4.
Rendering of a human fibroadenoma 3DZM.
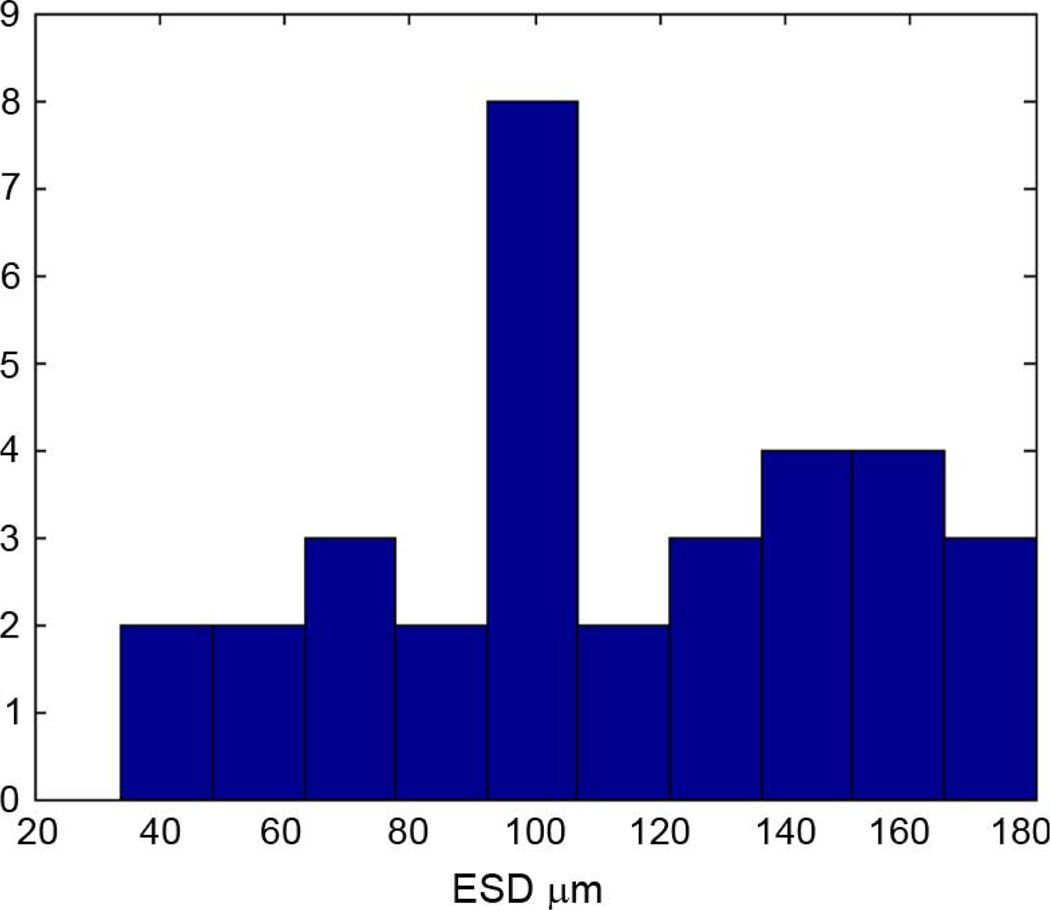
Across all 33 data sets, the average estimated ESD for the 300 × 300 × 300 µm 3DZMs was 111 ± 40.7 µm. Fig. 5 shows a histogram of the ESD estimates obtained for the human fibroadenoma data sets.
Fig. 5.
Histogram of ESD estimates obtained from 33 human fibroadenoma 300 × 300 × 300 µm ROIs.
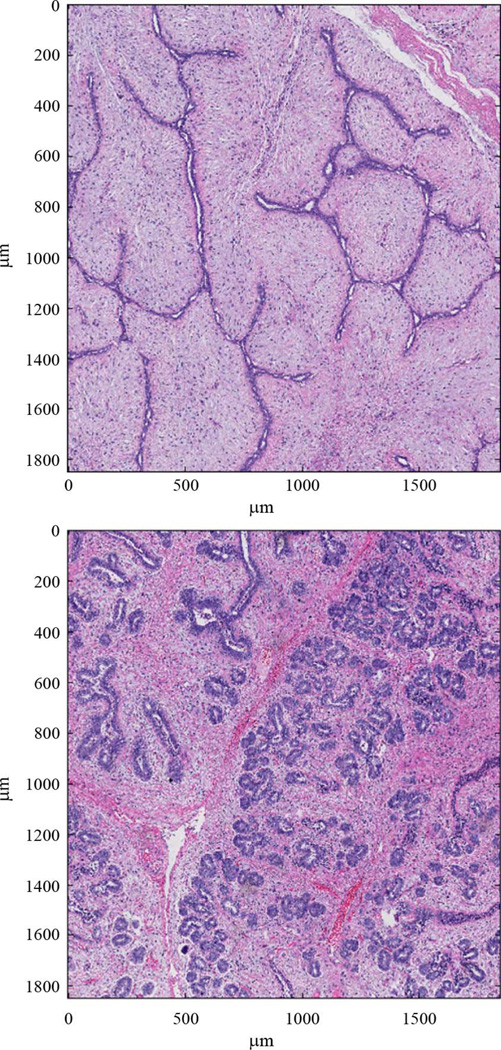
The histogram in Fig. 5 shows a large spread in the ESD estimates across different data sets. Different fibroadenoma samples, however, show a wide variety of structure shapes and sizes. Fig. 6 shows two tissue sections from two independent fibroadenoma data sets. In each figure, the acini, or duct-like dark structures through the tissue, take drastically different forms. A highly varying set of ESD estimates is expected for tissue with a great deal of high level structure, like fibroadenomas.
Fig. 6.
Sections from two independent fibroadenoma tissue samples.
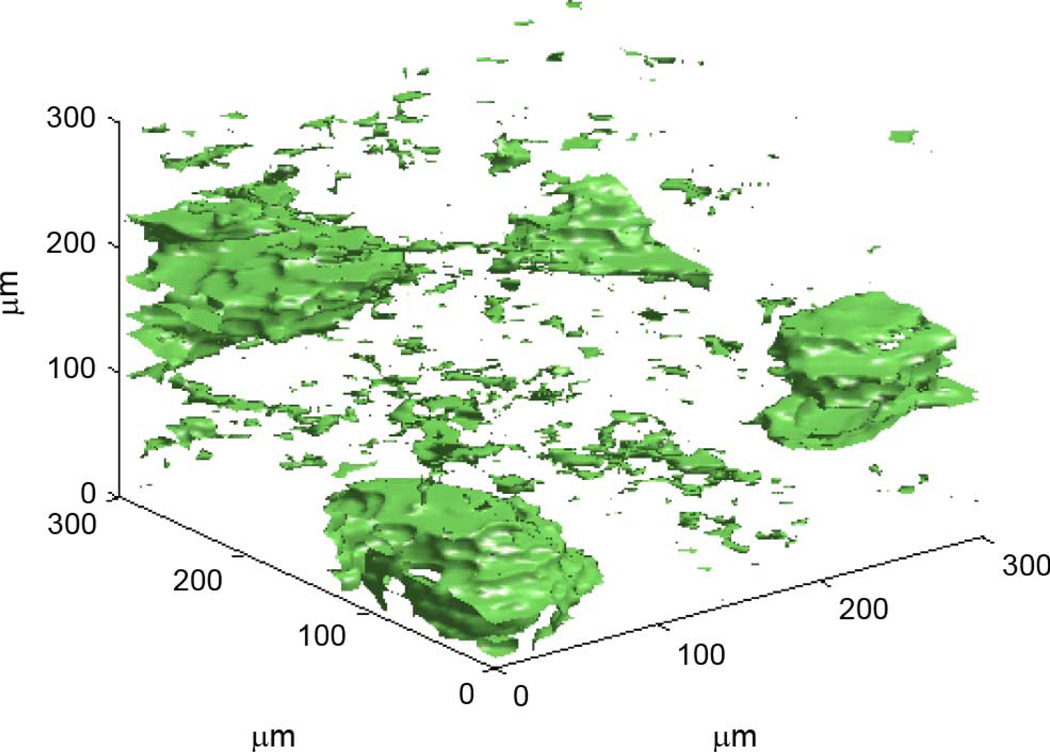
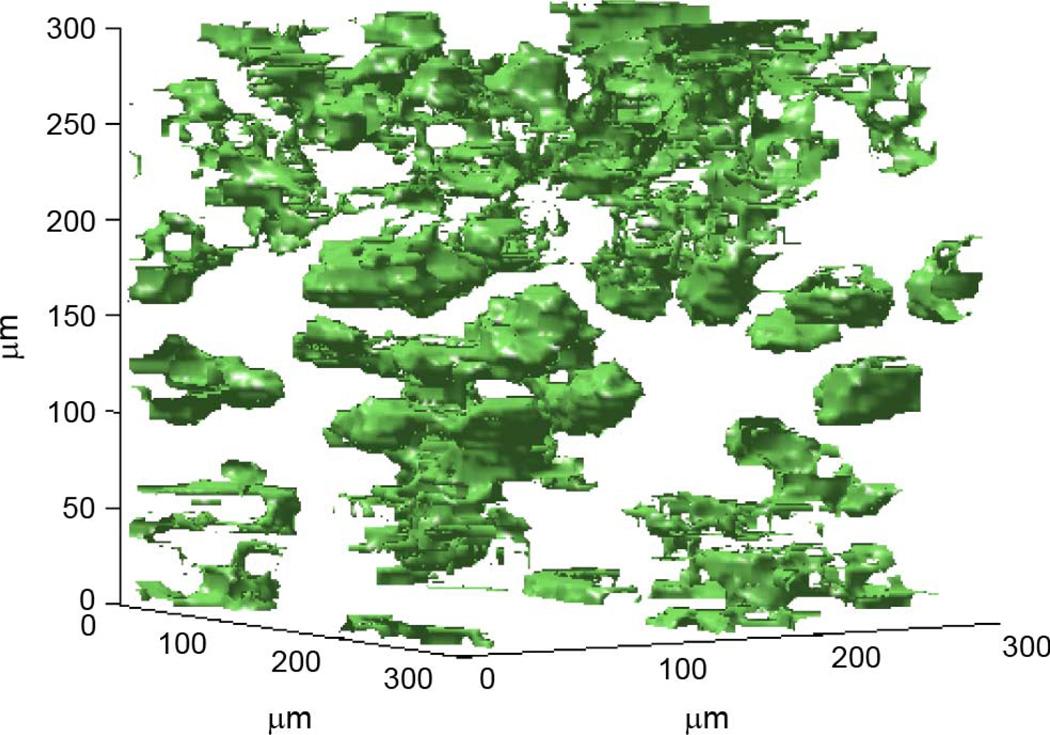
Figs. 7–9 show a segmentation of the high and low impedance structures inside three of the human fibroadenoma 3DZMs in this study. Anatomically, this is a separation of the acini and duct structures from the stroma, or surrounding structural tissue.
Fig. 7.
Segmentation of high and low impedance structures. ESD estimate for this 3DZM is 127 µm.
Fig. 9.
Segmentation of high and low impedance structures. ESD estimate for this 3DZM is 99 µm.
For the data set in Fig. 7, the ESD for the 300 × 300 × 300 µm 3DZM was 127 µm. For this data set, distinct structures of a size that visually corresponds to ESD estimates can be observed inside the volume (Appendix).
For the data set in Fig. 8, the ESD for the 300 × 300 × 300 µm 3DZM was 70 µm. There are no spherical scattering bodies inside this data set with the estimated ESD. The sheet-like structure inside the volume is matched poorly by the fluid-filled sphere scattering assumption made in this study. As a result, the ESD estimates give little intuition as to the tissue microstructure for this data set. In this case, the 3DZM method shows that a simple scattering model like the fluid-filled sphere FF may be inadequate for characterizing highly structured tissue.
Fig. 8.
Segmentation of high and low impedance structures. ESD estimate for this 3DZM is 70 µm.
For the data set in Fig. 9, the ESD for the 300 × 300 × 300 µm 3DZM was 99 µm. For this data set, the segmentation shows densely packed inclusions. While individual inclusions are smaller than the estimated ESD, the clusters of inclusions are of a size in moderate agreement with the ESD estimates. Although a direct link is not apparent between ESD estimates and specific inclusions in a data set, the agreement between ESD estimates and anatomical segmentation images, especially when the segmented inclusions are spherically shaped (i.e., in agreement with the fluid-filled sphere scattering model), shows some of the potential of ESD as a tissue descriptor and motivates further work on the topic.
The segmentation of 3DZMs may provide hints as to the dominant scattering structures in tissue, but a direct link between QUS parameters and anatomic structures remains a topic for future research. In terms of identifying the sources of ultrasound scattering from tissues, several studies have been conducted with a variety of conclusions. For example, in numerous studies, collagen has been identified as an important source of scattering in certain tissues [18]–[20]. Others have suggested that cells are an important source of scattering in tumor models in animals made up of prolific cellular structure with little to no extracellular matrix [21] and [22]. In the rat fibroadenoma, the glandular acini were identified as the dominant source of scattering based on histopathological analysis and comparison with ultrasonic based ESD estimates [21]. The high resolution spatial information about tissue microstructure provided by the 3DZM volume may shed new light on the topic of identifying the dominant acoustic scatterer in soft tissue in future studies.
V. Conclusion
3DZMs are a unique tool for the study of ultrasonic scattering in tissue. The ability to efficiently create 3DZMs from histology data was demonstrated and the theory for analysis techniques and applications of the resulting 3DZMs were explored.
This work focused on the specifics of 3DZM creation and analysis. These techniques were demonstrated on a set of 33 3DZMs created from human fibroadenomas; the results were then used to learn more about possible ultrasonic scattering sources.
This work was also a study of the structural attributes of human fibroadenoma, including their variability from patient to patient. As other tumor types are explored with the 3DZM method, this information may prove valuable as a discriminating characteristic.
The impedance structure of microtissue, observable via the 3DZM method, is potentially a valuable tool in the further development of ultrasonic scattering models. Although the links between ESDs from 3DZMs and anatomical structures inside the volumes remains somewhat tenuous, further research into this method should prove to strengthen that bond.
QUS holds great diagnostic potential and 3DZMs provide a powerful means to relate QUS results to actual tissue microstructure. That is, 3DZMs allow a connection to be made between QUS parameters and tissue pathology. This connection, along with future studies that compare the 3DZM method with acquired ultrasound RF, could be essential for propelling QUS forward as an effective and noninvasive diagnostic imaging modality.
Acknowledgments
This work was supported by the National Institutes of Health under Grant CA111289.
Appendix
ESD is an interpretation tool for the power spectrum of a 3DZM. The acoustic backscatter in an inhomogeneous continuum is proportional to the Fourier transform of the spatial correlation function of the impedance distribution. By applying a FF model, the power spectrum can be viewed in relation to the power spectrum of discrete spherical scatterers. ESD, however, does not provide direct information on tissue microstructure. This work does not suggest that tissue is composed of a set of discrete spherical scatterers, whose sizes can be obtained through the 3DZM method. Very rarely will ESD have a one to one correlation with tissue structure. ESD is a way to process a power spectrum estimated from tissue into a more digestible form.
Despite not necessarily having a direct link to anatomic structures, ESD is still a valuable parameter. ESD is a commonly used QUS parameter and has shown potential as a discriminant between tumor types [2], [3], and [14].
The vast majority of problems with ESD estimation come from its simplicity and strict assumptions about the tissue microstructure. This is a major motivation for the use of 3DZMs. The 3DZM may provide a useful tool in the development of more complex scattering models, which give more direct information about anatomic structures. This link between acoustic scattering parameters and tissue microstructure is critical for the ultimate development of QUS as a clinically relevant tool.
Contributor Information
Alexander J. Dapore, Email: adapore2@gmail.com, Bioacoustics Research Laboratory, Department of Electrical and Computer Engineering, University of Illinois at Urbana-Champaign, Urbana, IL 61801 USA.
Michael R. King, Email: mikerking@gmail.com, Bioacoustics Research Laboratory, Department of Electrical and Computer Engineering, University of Illinois at Urbana-Champaign, Urbana, IL 61801 USA.
Josephine Harter, Email: jharter@uwhealth.org, Department of Medical Physics, University of Wisconsin-Madison, Madison, WI 53706 USA.
Sandhya Sarwate, Email: sarwate1@illinois.edu, Bioacoustics Research Laboratory, Department of Electrical and Computer Engineering, University of Illinois at Urbana-Champaign, Urbana, IL 61801 USA.
Michael L. Oelze, Email: oelze@illinois.edu, Bioacoustics Research Laboratory, Department of Electrical and Computer Engineering, University of Illinois at Urbana-Champaign, Urbana, IL 61801 USA.
James A. Zagzebski, Email: jazagzeb@wisc.edu, Department of Medical Physics, University of Wisconsin-Madison, Madison, WI 53706 USA.
Minh N. Do, Email: minhdo@illinois.edu, Bioacoustics Research Laboratory, Department of Electrical and Computer Engineering, University of Illinois at Urbana-Champaign, Urbana, IL 61801 USA.
Timothy J. Hall, Email: tjhall@wisc.edu, Department of Medical Physics, University of Wisconsin-Madison, Madison, WI 53706 USA.
William D. O’Brien, Jr., Email: wdo@uiuc.edu, Bioacoustics Research Laboratory, Department of Electrical and Computer Engineering, University of Illinois at Urbana-Champaign, Urbana, IL 61801 USA.
REFERENCES
- 1.Cobbold RSC. Foundations of Biomedical Ultrasound. New York: Oxford Univ. Press; 1997. [Google Scholar]
- 2.Oelze ML, O’Brien WD, Jr, Zachary JF. Quantitative ultrasound assessment of breast cancer using a multiparameter approach; Proc. 2007 IEEE Ultrason. Symp; 2007. pp. 981–984. [Google Scholar]
- 3.Mamou J. Ph.D. dissertation. Urbana: Univ. Illinois Urbana-Champaign; 2005. Ultrasonic characterization of three animal mammary tumors from three-dimensional acoustic tissue models. [Google Scholar]
- 4.Lizzi FL, Astor M, Liu T, Deng C, Coleman DJ, Silverman RH. Ultrasonic spectrum analysis for tissue assays and therapy evaluation. Int. J. Imag. Syst. Technol. 1996 Sep.vol. 8:3–10. [Google Scholar]
- 5.Lizzi FL, Greenebaum M, Feleppa EJ, Elbaum M. Theoretical framework for spectrum analysis in ultrasonic tissue characterization. J. Acoust. Soc. Am. 1983 Apr.vol. 73:1366–1373. doi: 10.1121/1.389241. [DOI] [PubMed] [Google Scholar]
- 6.Insana MF, Wagner RF, Brown DG, Hall TJ. Describing small-scale structure in random media using pulse-echo ultrasound. J. Acoust. Soc. Am. 1990 Jan.vol. 87:179–192. doi: 10.1121/1.399283. [DOI] [PMC free article] [PubMed] [Google Scholar]
- 7.Mamou J, Oelze ML, O’Brien WD, Jr, Zachary JF. Identifying ultrasonic scattering sites from three-dimensional impedance maps. J. Acoust. Soc. Am. 2005 Jan.vol. 117:413–423. doi: 10.1121/1.1810191. [DOI] [PubMed] [Google Scholar]
- 8.Morse PM, Ingard KU. Theoretical Acoustics. New York: McGraw-Hill; 1968. [Google Scholar]
- 9.Tabei M, Mast TD, Waag RC. Simulation of ultrasound focus aberration and correction through human tissue. J. Acoust. Soc. Am. 2002;vol. 113:1166–1176. doi: 10.1121/1.1531986. [DOI] [PubMed] [Google Scholar]
- 10.Insana MF, Hall TJ. Parametric ultrasound imaging from backscatter coefficient measurements: Image formation and interpretation. Ultrason. Imag. 1990;vol. 12:245–267. doi: 10.1177/016173469001200402. [DOI] [PubMed] [Google Scholar]
- 11.Insana MF, Brown DG. Acoustic scattering theory applied to soft biological tissues. In: Shung K, Thieme GA, editors. Ultrasonic Scattering in Biological Tissues. Boca Raton: CRC; 1993. pp. 75–124. [Google Scholar]
- 12.Anderson VC. Sound scattering from a fluid sphere. J. Acoust. Soc. Am. 1950;vol. 22:426–431. [Google Scholar]
- 13.Proakis JG, Manolakis DG. Digital Signal Processing. Upper Saddle River, NJ: Pearson Prentice Hall; 2007. [Google Scholar]
- 14.Mamou J, Oelze ML, O’Brien WD, Jr, Zachary JF. Extended threedimensional impedance map methods for identifying ultrasonic scattering sites. J. Acoust. Soc. Am. 2008 Feb.vol. 123:1195–1208. doi: 10.1121/1.2822658. [DOI] [PMC free article] [PubMed] [Google Scholar]
- 15.Thevenaz P, Unser M. A pyramid approach to subpixel registration based on intensity. IEEE Trans. Image Process. 1998 Jan.vol. 7(no. 1):27–41. doi: 10.1109/83.650848. [DOI] [PubMed] [Google Scholar]
- 16.Goss SA, Johnston RL, Dunn F. Comprehensive compilation of empirical ultrasonic properties of mammalian tissues. J. Acoust. Soc. Am. 1978;vol. 64:423–457. doi: 10.1121/1.382016. [DOI] [PubMed] [Google Scholar]
- 17.Goss SA, Johnston RL, Dunn F. Comprehensive compilation of empirical ultrasonic properties of mammalian tissues II. J. Acoust. Soc. Am. 1980;vol. 68:93–108. doi: 10.1121/1.384509. [DOI] [PubMed] [Google Scholar]
- 18.Fields S, Dunn F. Correlation of echographic visualizability of tissue with biological composition and physiologic state. J. Acoust. Soc. Am. 1973;vol. 54:809–811. doi: 10.1121/1.1913668. [DOI] [PubMed] [Google Scholar]
- 19.Mimbs JW, O’Donnell M, Bauwens D, Miller JW, Sobel BE. The dependence of ultrasonic attenuation and backscatter on collagen content in dog and rabbit hearts. Circulation Res. 1980;vol. 47:49–58. doi: 10.1161/01.res.47.1.49. [DOI] [PubMed] [Google Scholar]
- 20.Waag RC, Lee PPK, Persson HW, Schenk EA, Gramiak R. Frequency-dependent angle scattering of ultrasound by liver. J. Acoust. Soc. Am. 1982;vol. 72:343–352. doi: 10.1121/1.388088. [DOI] [PubMed] [Google Scholar]
- 21.Oelze ML, O’Brien WD, Jr, Blue JP, Zachary JF. Differentiation and characterization of rat mammary fibroadenomas and 4T1 mouse carcinomas using quantitative ultrasound imaging. IEEE Trans. Med. Imag. 2004 Jun.vol. 23(no. 6):764–771. doi: 10.1109/tmi.2004.826953. [DOI] [PubMed] [Google Scholar]
- 22.Banihashemi B, Vlad R, Debeljevic B, Giles A, Kolios MC, Czarnota GJ. Ultrasound imaging of apoptosis in tumor response: Novel preclinical monitoring of photodynamic therapy effects. Cancer Res. 2008;vol. 68:8590–8596. doi: 10.1158/0008-5472.CAN-08-0006. [DOI] [PubMed] [Google Scholar]


