

Abstract
A systematic spatial heterogeneity with high proliferative activity at the luminal border and low activity at the invasive margin is an unexpected behavior that has been observed in colorectal cancer (CRC). To clarify this phenomenon and possible underlying regulatory mechanisms, we have by immunohistochemistry elucidated the proliferative activity and the expression of G1/S regulatory proteins in small and large tumor cell clusters at the invasive margin in 97 CRCs. By identifying small tumor clusters at the tumor front, actually invading cancer cells could be characterized and analyzed separately. These cells could then be compared with the main tumor mass represented by the larger tumor clusters. The proliferation was significantly lower in small tumor clusters compared with larger clusters (P < 0.001) and the decrease in proliferation was correlated with a p16 up-regulation (rs = −0.41, P < 0.001). Interestingly, CRCs lacking p16 expression (18%) or tumors with other aberrations in the p16/cyclin D1/pRb pathway had a less pronounced decrease in proliferation between large and small clusters (P < 0.001), further strengthening the association between p16 and ceased proliferation at the invasive margin. This contrasts to tumors with low p27 or abnormal p53 levels showing sustained proliferation in small tumor clusters. Our findings imply that invading CRC cells generally have low proliferative activity, and this phenomenon seems to be mediated through p16 and the p16/cyclin D1/pRb pathway.
The ability of cancer cells to invade the surrounding stroma and vessels is linked to patient prognosis due to associations with advanced local invasive tumor growth and distant spread. In colorectal cancer (CRC), the growth pattern at the invasive margin (expanding versus infiltrating) represents a powerful prognostic tool related to the presence of small cancer cell clusters that invades the surrounding stromal compartment.1-3 Whether such ability to invade actively is associated with changes in proliferative activity has not been comprehensively evaluated, even though we and others have reported a spatial proliferative heterogeneity in CRC and gastric cancer with higher proliferative activity in the luminal compartment of the tumor compared to lower proliferation at the invasive margin.4-6 The extent of decreased proliferative activity at the invasive margin compared to the luminal compartment might potentially be influenced by disturbances of the cell cycle regulation, ie, the complex machinery prone to generate two genetically identical daughter cells. Central in the cell cycle machinery is a family of serine-threonine kinases, the cyclin-dependent kinases (CDKs),7-9 which can be activated by cyclins D and E and inactivated by CDK inhibitors (CDKIs), eg, p27Kip1, p21Waf1, and p16INK4a.10 p16INK4a inhibits specifically the cyclin D1-CDK4/6 complex and forms together with the main substrate, the retinoblastoma gene product (pRb),11 the most important regulatory pathway involved in the G1/S transition.12 Uncontrolled tumor cell proliferation is a reality in tumor cells, and the progression from a normal cell into a transformed cell probably includes genetic events affecting checkpoints in the cell cycle machinery. We have earlier analyzed the expression of pRb, cyclin D1, and p27Kip1 in CRC and observed aberrations in the protein expression in various fractions of the tumors.3,13 Any systematic difference in the expression of the proteins for luminal and invasive margin compartments or association to proliferative differences were not observed implicating that the proteins were not directly involved in the regulation of proliferation in different tumor compartments. Few studies have so far characterized the p16 expression in CRC and the frequency of potential down-regulation of the protein as well as expression patterns have not been established. In a limited study of 17 CRCs, Ohhara et al proposed that inactivation of p16 was unusual and activation of the p16 gene leading to elevated mRNA levels was more common.14 In contrast, Tomlinson et al and Ahuja et al have observed loss of heterozygosity in the p16 locus in 38% of CRCs and hypermethylation of the p16 gene in 34%.15,16
In the present study, we have characterized invading CRC cells by delineating the proliferative activity in large tumor clusters as well as in the small invading tumor clusters at the invasive margin. We also wanted to evaluate the expression of G1/S regulatory proteins including p16, in the tumors as well as in tumor cells at the invasive margin to explore potential regulatory mechanisms to proliferation differences in invading tumor cells.
Materials and Methods
Patient and Tumor Data
Ninety-seven patients with primary CRC were retrospectively included in this study, as recently described.13,3 Five of the 97 were excluded due to technical shortcomings, leaving 92 patients for further studies. Twelve were classified as Dukes’ stage A, 44 as Dukes’ B, and 36 as Dukes’ C. Each CRC was classified with respect to grade (WHO classification), tumor type (mucinous or nonmucinous), growth pattern (expanding or infiltrating), and the degree of lymphocytic reaction at the invasive margin.
Immunohistochemical Single Staining Procedures
CRC specimens as well as normal mucosa specimens were collected from all patients, fixed in 4% formaldehyde, and embedded in paraffin according to routine procedures. For single immunohistochemical stainings of p16 and p53, sections were microwave treated in citrate buffer (pH 6.0). Antigen visualization was thereafter performed using a semiautomatic staining machine (Ventana ES, Ventana Inc., Tucson, AZ). The primary antibodies were monoclonal anti-p16 diluted 1:25 (Pierce, Rockford, IL), and anti-p53 (Ab-6, Oncogene Science, Cambridge, MA) diluted 1:400. In each run, tonsil tissue served as a control regarding p16 in which nuclear staining was noted in histiocytic cell and in epithelial cells of the mucosal lining.
The patient material used in this study has been analyzed in two recent studies of cyclin D1, pRb, and p27 expression.3,13 Briefly, the same procedure as in this study was used to visualize the following antibodies: i) polyclonal anti-pRb (C15, Santa Cruz Biotechnology, Santa Cruz, CA) at a dilution of 1:100, ii) monoclonal anti-Cyclin D1 (DCS-6, a kind gift from Dr. Jiri Bartek, Copenhagen, Denmark) at a dilution of 1:200, and iii) monoclonal anti-p27Kip1 (K25020, Transduction Laboratories, Lexington, KY) at a dilution of 1:200.
Immunohistochemical Double Staining Procedures
Tumor clusters at the invasive margin were detected and characterized by a double staining technique that included, besides anti-p16 (1:25) and anti-Ki-67 (MIB1, Immunotech, Marseille, France, 1:25), a monoclonal antibody (CAM5.2, Becton Dickinson, San Jose, CA) reacting with cytokeratins 8 and 18 that served as markers for epithelial, ie, tumor cells. The double staining procedure was performed sequentially in a semiautomatic staining machine. After antigen retrieval by microwave treatment in citrate (pH 7.3), p16 antibodies were applied followed by diaminobenzidine (DAB) as a substrate for detection (brown color). The sections were thereafter incubated with CAM5.2 (1:25) antibodies without additional pretreatment. After blocking endogenous biotin activity (Endogenous Biotin Blocking Kit, Ventana) and amplification of the CAM5.2-signal with amplification antibodies according to the manufacturer’s protocol (Amplification Kit, Ventana) the CAM5.2 was detected by using alkaline phosphatase (red color; Alkaline Phosphatase Fast Red Detection Kit, Ventana). Before quantitation, all double-stained sections were compared with the corresponding single p16- and Ki-67-stained sections, and tumors with divergent results were excluded.
Evaluation of Immunohistochemical Stainings
The p16 single-stained slides were interpreted by one of the investigators (R. P.) unaware of the results of the other analyses. The fractions of p16-positive nuclei were semiquantitatively evaluated using a five graded scale, approximately representing labeling indices (LIs) of 0 to 5% (−), 6 to 10% (+), 11 to 20% (++), 21 to 40% (+++), and >40% (++++), respectively. Tumors classified in the − group were regarded as negative for p16. All slides were independently reviewed twice and intraobserver disagreements (<10%) were reviewed a third time, followed by a conclusive judgment. p53 immunoreactivity was evaluated by classifying tumors in two categories corresponding to LI <5% (−) and ≥5% (+).17
In the double stainings, large tumor clusters were defined as >50 tumor cells and small tumor clusters as 2–5 cells per cluster all within the invasive margin corresponding to the deepest fourth of the tumor depth.5 Single keratin-positive cells were not counted to exclude nonepithelial keratin-positive cells. LIs were counted for Ki-67 and p16 in 10 large tumor cell clusters sampled in a random systematic fashion,18 and in all small clusters (2–5 cells) present in each section. Sections containing <10 small tumor cell clusters were excluded from further analyses. In general, about 500-1000 cells in large clusters and about 250 cells in small clusters were counted per tumor. The Ki-67DIFF and p16DIFF were calculated according to the formulas below:
 |
 |
Statistics
To test the linear association between two ordinal scale variables, the exact linear-by-linear association test was performed. When at least one variable contained nominal data, the Fisher’s exact test was performed. Spearman’s correlation coefficient (rs) was used to compare sets of continuous variables. Wilcoxon matched-pairs signed-rank test was performed to test systematic differences when two measurements from the same tumors were analyzed. A significance level of 0.05 was used. Statistical analyses were performed using SPSS version 8.0 (SPSS Inc., Chicago, IL).
Results
Tumor Proliferation at the Invasive Margin
To study the proliferative activity at the invasive margin in CRC we evaluated the expression of Ki-67 in large tumor clusters consisting of more than 50 tumor cells and in tumor clusters consisting of 2–5 cells using double staining with Ki-67 and CAM 5.2 (model in Figure 1▶ ). Eighty-eight tumors were evaluated; the median LIs for large and small tumor clusters were 38.7% and 15.7%, respectively. A comparison of paired tumor samples showed that large tumor cell clusters had significantly higher proliferation (P < 0.001) compared with small clusters (Figure 2A)▶ . The associations between proliferation in large and small tumor clusters, as well as the distributions of these variables, are shown in Figure 2B▶ . Poorly differentiated tumors had, in general, higher proliferative activity in small tumor clusters and less difference in proliferation between large and small clusters. There was no significant relation between proliferation and the clinicopathological parameters gender, age, Dukes’ stage, tumor type, growth pattern, or degree of lymphocytic reaction.
Figure 1.
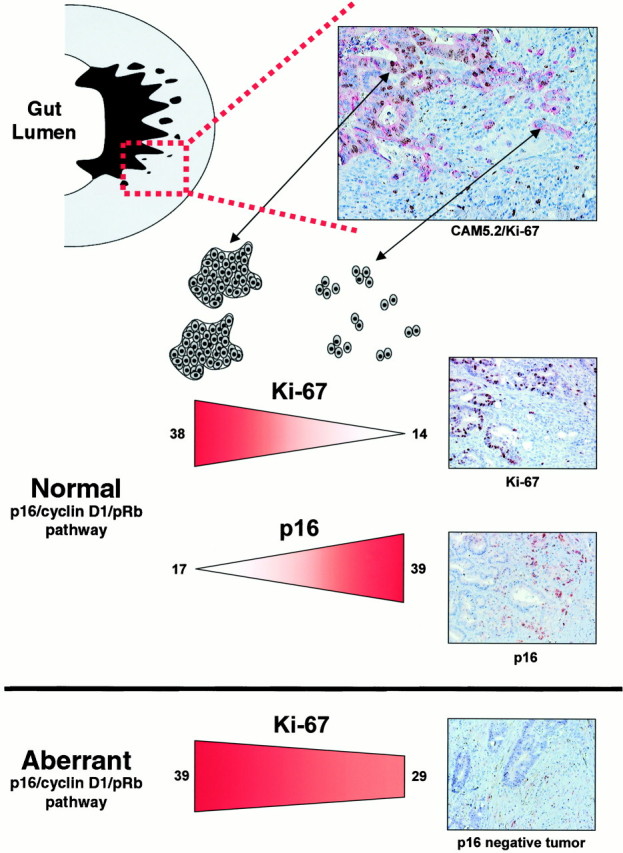
A schematic model of small and large tumor cell clusters at the invasive margin in CRC and differences regarding proliferation (Ki-67) and expression of p16 in tumors with a normal or aberrant p16/cyclin D1/pRb pathway. The median LIs of Ki-67 and p16 in large and small tumor clusters are indicated for tumors with normal or aberrant p16/cyclin D1/pRb pathway.
Figure 2.

The distribution of Ki-67- (A) and p16-positive cells (C) in large and small tumor cell clusters at the invasive margin in CRC. Scatter diagram illustrating the associations between Ki-67 (B) and p16 (D) expression in large and small tumor clusters. The line indicates 1:1 relation between the parameters. Seventeen cases are located in the 0:0 point. Filled markers denote tumors with aberrant p16/cyclin D1/pRb pathway.
General Expression of p16
Nuclear p16 reactivity was characterized in eight normal colorectal mucosa samples and in 92 colorectal cancers. All normal samples were essentially p16-negative, with only few scattered positive cells along the crypt axis with no specificity regarding position. Both nuclear and cytoplasmic p16 expression was observed in the tumors (Figure 1)▶ , and high nuclear p16 expression was generally associated with strong cytoplasmic staining (data not shown) but only nuclear staining was quantified, representing the most relevant location of p16. Of 92 CRCs, 17 were classified as p16-negative (Figure 1)▶ , whereas the majority (75/92) exhibited p16 positivity, though with variations in both the fraction of positive cells and the distribution of positive cells within the tumor area. The p16 expression was significantly higher (P < 0.001) in the deepest fourth (corresponding to the invasive margin) of the full cross-section from the bowel wall, compared with the most superficial fourth (corresponding to the luminal border). Clinicopathological parameters were not associated with p16 negativity or positivity except for poorly differentiated tumors, which were associated with p16 negativity (P = 0.03). Interestingly, p16 negativity was also associated with low or absent p27 expression (P = 0.020), suggesting a link between down-regulation of the two CDKIs (Table1).
Expression of p16 at the Invasive Margin
To study further the potential association between p16 and proliferation, the fractions of p16-positive cells were determined in large and small tumor clusters at the invasive margin (Figure 1)▶ . Out of 92 tumors characterized, the fraction of p16-positive cells was significantly higher in small tumor clusters compared with large tumor clusters (P < 0.001), as illustrated in Figure 2▶ . The differences in Ki-67 and p16 expression between large and small tumor clusters, denoted Ki-67DIFF and p16DIFF as defined in Material and Methods, correlated significantly suggesting that decreased proliferation in small tumor clusters could be a consequence of increased p16 expression. This relation was significant, whether p16-negative cases were included or not (rs = −0.41; P < 0.001 and rs= −0.311; P = 0.008, respectively). As shown in Table 1▶ , p16-negative and -positive tumors had approximately similar proliferation in large tumor clusters, whereas p16-positive tumors had lower proliferation in small tumor clusters (P = 0.002). There was, in general, no heterogeneity between small tumor clusters regarding p16 protein expression and only minimal heterogeneity between large tumor clusters (data not shown). Even though heterogeneity might affect our results, we tried to minimize this problem by studying defined tumor areas such as large and small tumor clusters at the invasive margin.
Table 1.
The Proliferative Activity (Ki-67) and p16 Expression in Relation to the Expression of Cell Cycle Regulatory Proteins
| Cell cycle status | Ki-67LARGE (median) | Ki-67SMALL (median) | Ki-67DIFF (median) | p16-positive (numbers) | p16-negative (numbers) | P value |
|---|---|---|---|---|---|---|
| pRb | ||||||
| Normal | 37.7 | 15.0 | 0.59 | 64 | 15 | NS |
| Inactivated | 49.0 * | 42.8 * | 0.14 | 2 | 0 | |
| Overexpression | 47.1 | 22.1 | 0.48 | 9 | 2 | |
| Cyclin D1 | ||||||
| Low | 40.7 | 15.2 | 0.59 | 26 | 3 | 0.043 |
| Normal | 37.7 | 14.5 | 0.61 | 38 | 9 | |
| Overexpression | 38.0 | 20.7 | 0.32 | 6 | 5 | |
| p16 | ||||||
| Negative | 38.7 | 29.1 ** | 0.26 ** | — | — | — |
| Positive | 38.7 | 14.5 | 0.61 | — | — | |
| p27 | ||||||
| Absent or low | 32.0 | 19.6 | 0.57 | 5 | 5 | 0.020 |
| High | 39.1 | 16.1 | 0.57 | 67 | 12 | |
| p53 Accumulation | ||||||
| Normal | 38.7 | 20.2 | 0.55 | 17 | 5 | NS |
| Abnormal | 38.7 | 14.8 | 0.59 | 57 | 12 |
Kruskal-Wallis test was used to analyze Ki-67 data (columns 2–4). Fisher’s exact test was performed to analyze p16 data (columns 5–7).
*P < 0.05.
**P < 0.01.
The up-regulation of p16 in small invasive tumor clusters, measured as p16DIFF, was more predominant in highly differentiated tumors compared with moderately and poorly differentiated tumors (P = 0.010), even though the majority of the tumors were moderately differentiated. p16DIFF was not significantly related to tumor stage, growth pattern at the invasive margin, tumor type, or degree of lymphocytic reaction at the invasive margin.
Proliferation Differences at the Invasive Margin in Relation to G1/S Regulatory Defects
To explore if the p16/cyclin D1/pRb pathway was involved in the proliferation reduction at the invasive margin, we determined the proliferation differences (Ki-67DIFF) in tumors harboring various aberrations in the p16/cyclin D1/pRb pathway, ie, pRb inactivation, p16 inactivation, or overexpression of cyclin D1. The two tumors with pRb inactivation, reported earlier in Palmqvist et al,13 had significantly higher proliferation in large tumor clusters (P = 0.018) and a similar high proliferation in small tumor clusters and a very low Ki-67DIFF indicating an inability to decrease proliferation with a nonfunctional pRb (Table 1)▶ . These two tumors had also an expanding growth pattern at the invasive margin. Tumors with aberrantly intense pRb staining,13 representing a rather odd CRC group with a potential overexpression of a suppressor gene product, also had significantly higher proliferation in large tumor clusters (P = 0.018) but, in contrast to pRb-inactivated tumors, a significantly lower proliferation in small tumor clusters compared with large clusters in paired samples (P = 0.04) and, consequently, a Ki-67DIFF similar to that for pRb normal tumors. For cyclin D1, there was a tendency, although not significant, of tumors overexpressing the protein to have a lower Ki-67DIFF (P = 0.137) and higher Ki-67 levels in small clusters (P = 0.173) compared with CRCs with normal cyclin D1 expression (Table 1)▶ . As reported previously, there was no spatial heterogeneity between tumor cells at the luminal border and at the invasive margin regarding protein content of cyclin D1, pRb, and p27 in this patient material.13 The p27 and p53 status was not related to proliferation reduction in small invasive tumor clusters, and the Ki-67DIFF was similar for these tumor groups, as illustrated in Table 1▶ . Unexpectedly, 5 of 10 cases with absent or low p27 expression were p16-negative (P = 0.020).
The Ki-67DIFF for tumors with immunohistochemically detected aberrations in the p16/cyclin D1/pRb pathway and tumors lacking these pathway abnormalities are plotted in Figure 3▶ . There was a highly significant difference between the two groups (P < 0.001), with less proliferation reduction in small tumor clusters for CRCs with p16/cyclin D1/pRb pathway aberrations. A schematic model summarizing our results is presented in Figure 1▶ .
Figure 3.

Proliferation differences between small and large tumor cell clusters, illustrated by Ki-67DIFF, for tumors with a normal or an aberrant p16/cyclin D1/pRb pathway defined by immunohistochemistry. The median value is indicated for each tumor group representing a significant difference in proliferation reduction (P < 0.001).
Discussion
In the present study we have used single and double immunohistochemistry stainings to study proliferation and expression of G1/S regulatory proteins at different locations within CRCs. Tumor cells are affected by various stimulatory and inhibitory molecules, and the composition of signals probably varies depending on the distance to luminal factors, oxygen supply, and nontransformed stromal cells. By defining two levels of tumor invasiveness, representing large and small tumor clusters at the invasive margin, differences associated with actual invasive behavior could be evaluated. A model system based on cell lines authentically simulating invading CRC cells is difficult to design. Detailed studies of primary tumors are ideal, therefore, for revealing potential events affected by both intrinsic genetic alterations in tumor cells and extrinsic stimulatory and inhibitory factors from surrounding cells. It is also an advantage to analyze protein contents instead of RNA-based assays (fluorescence in situ hybridization) because several proteins involved in the G1/S transition are regulated in part by protein destruction pathways.
Our results indicate that decreased proliferation in small invading tumor clusters represents a common phenomenon present in the majority of the CRCs. This is in agreement with the report from Taniyama et al showing decreased proliferative activity in dedifferentiated CRC cells at the invasive margin.19 Similar observations has been made in human gliomas, but underlying mechanisms have not been clarified.20,21 When tumor cells invade, they will confront a new microenvironment; for melanoma cells growing in vitro, the type of collagen affected the proliferation and growth arrest was observed in the presence of fibrillar type I collagen.22
Our results, as well as others, indicate that the expression of p16 is low in normal colonic mucosa in contrast to high p16 levels in a majority of CRCs.14,23 Nevertheless, loss of p16 has been described in many types of cancer and has also been observed in CRC.15,16 In this study, 18% of the tumors did not express p16, which could represent either a genuine down-regulation of p16 expression or a lack of up-regulation. Further studies are needed to clarify this issue, but it is likely that a fraction of the tumors did not have the capacity to express p16, due to either genetic aberrations or epigenetic phenomena.
It is intriguing that low proliferation in small invading tumor clusters was accompanied by an increase of p16 expression proposing a regulatory mechanism and a gradient of increased p16 expression corresponding to local invasive activity and ceased proliferation. Interestingly, CRCs that did not adhere to this model were predominantly those harboring aberrations in pRb, cyclin D1, or p16 expression. Tumors with low p16 or Rb inactivation have by definition a damaged regulatory pathway, in that p16 predominantly inhibits cyclin D1-associated kinase activities that have pRb as the main substrate. These tumors also exhibited a sustained proliferation at the invasive margin. Tumors with cyclin D1 overexpression and a partially disturbed p16/cyclin D1/pRb pathway can probably still respond to p16, but to a lesser extent, and our findings of a modest proliferation reduction in small tumor clusters with cyclin D1 overexpression could therefore be anticipated. It is important to note, though, that tumors with aberrant expression of p27 or p53, proteins involved in other pathways besides the p16/cyclin D1/pRb pathway, showed a conserved proliferation reduction in small clusters.
Extracellular signals are believed to play an important role in tumor invasion,24 and adhesion molecules such as E-cadherin, when it is complexed with its intracellular partner β-catenin, are known to mediate contact inhibition and negatively control cell motility, whereas free β-catenin counteracts these processes. High β-catenin levels have also been observed at the invasive margin in CRCs.25 The intracellular response to β-catenin is not fully understood, but a recent report has suggested that β-catenin regulates the expression of cyclin D1, potentially affecting tumor proliferation.26 Interestingly, p16 could also mediate contact inhibition of growth, as reported recently.27 Our findings might indicate that normal and expected behavior for a CRC cell is to shut off proliferation when invading locally, and we propose that this function might be mediated through p16. The mechanisms regulating p16 expression at the invasive margin are nevertheless unknown and must be clarified.
We have characterized in principle genetically identical tumor cell clusters presumably under stress from two different microenvironments and observed that invading CRC cells down-regulate proliferation in part through p16 up-regulation and a functional p16/cyclin D1/pRb pathway. Our results therefore link proliferation, invasion, and cell cycle regulation in a model that might be relevant for tumors other than CRC. The present study focused on locally invading tumor cells; future studies should elucidate the role for decreased proliferation and p16 expression at the invasive margin in tumor spread and metastasizing.
Acknowledgments
We thank Mrs. Kerstin Näslund for skillful technical assistance and Mr. Björn Tavelin for statistical support.
Footnotes
Address reprint requests to Göran Landberg, M.D., Ph.D., Department of Laboratory Medicine, Division of Pathology, Lund University, Malmö University Hospital, S-205 02 Malmö, Sweden.
Supported in part by grants from the Swedish Cancer Society (3813-B96–01XAB and 2520-B96–10XCC), the Lion’s Cancer Research Foundation in Umeå, Sweden, and the Medical Faculty of Umeå University, Sweden.
References
- 1.Jass JR, Atkin WS, Cuzick J, Bussey HJ, Morson BC, Northover JM, Todd IP: The grading of rectal cancer: historical perspectives and a multivariate analysis of 447 cases. Histopathology 1986, 10:437-459 [DOI] [PubMed] [Google Scholar]
- 2.Cianchi F, Messerini L, Palomba A, Boddi V, Perigli G, Pucciani F, Bechi P, Cortesini C: Character of the invasive margin in colorectal cancer: does it improve prognostic information of Dukes’ staging? Dis Colon Rectum 1997, 40:1170-1175 [DOI] [PubMed] [Google Scholar]
- 3.Palmqvist R, Stenling R, Öberg Å, Landberg G: Prognostic significance of p27Kip1 expression in colorectal cancer: a clinico-pathological characterisation. J Pathol 1999, 188:18-23 [DOI] [PubMed] [Google Scholar]
- 4.Bergstrom C, Palmqvist R, Denekamp J, Oberg A, Tavelin B, Stenling R: Factors influencing the estimates of proliferative labelling indices in rectal cancer. Radiother Oncol 1998, 46:169-177 [DOI] [PubMed] [Google Scholar]
- 5.Palmqvist R, Öberg Å, Bergström C, Rutegård JN, Zackrisson B, Stenling R: Systematic heterogeneity and prognostic significance of cell proliferation in colorectal cancer. Br J Cancer 1998, 77:917-925 [DOI] [PMC free article] [PubMed] [Google Scholar]
- 6.Ramires M, David L, Leitao D, Seixas M, Sansonetty F, Sobrinhosimoes M: Ki67 labelling index in gastric carcinomas: an immunohistochemical study using double staining for the evaluation of the proliferative activity of diffuse-type carcinomas. J Pathol 1997, 182:62-67 [DOI] [PubMed] [Google Scholar]
- 7.Pines J: Cyclins, CDKs and cancer. Semin Cancer Biol 1995, 6:63-72 [DOI] [PubMed] [Google Scholar]
- 8.Sherr CJ: Cancer cell cycles. Science 1996, 274:1672-1677 [DOI] [PubMed] [Google Scholar]
- 9.Johnson DG, Walker CL: Cyclins and cell cycle checkpoints. Annu Rev Pharmacol Toxicol 1999, 39:295-312 [DOI] [PubMed] [Google Scholar]
- 10.Sherr CJ, Roberts JM: Inhibitors of mammalian G1 cyclin-dependent kinases. Genes Dev 1995, 9:1149-1163 [DOI] [PubMed] [Google Scholar]
- 11.Xu HJ, Hu SX, Benedict WF: Lack of nuclear RB protein staining in G0/middle G1 cells: correlation to changes in total RB protein level. Oncogene 1991, 6:1139-1146 [PubMed] [Google Scholar]
- 12.Bartkova J, Lukas J, Guldberg P, Alsner J, Kirkin AF, Zeuthen J, Bartek J: The p16/cyclin D/Cdk4-pRb pathway as a functional unit frequently altered in melanoma pathogenesis. Cancer Res 1996, 56:5475-5483 [PubMed] [Google Scholar]
- 13.Palmqvist R, Stenling R, Öberg Å, Landberg G: Expression of cyclin D1 and the retinoblastoma protein in colorectal cancer. Eur J Cancer 1998, 34:1575-1581 [DOI] [PubMed] [Google Scholar]
- 14.Ohhara M, Esumi M, Kurosu Y: Activation but not inactivation of the MTS1 gene is associated with primary colorectal carcinomas. Biochem Biophys Res Commun 1996, 226:791-795 [DOI] [PubMed] [Google Scholar]
- 15.Tomlinson I, Ilyas M, Johnson V, Davies A, Clark G, Talbot I, Bodmer W: A comparison of the genetic pathways involved in the pathogenesis of three types of colorectal cancer. J Pathol 1998, 184:148-152 [DOI] [PubMed] [Google Scholar]
- 16.Ahuja N, Mohan AL, Li Q, Stolker JM, Herman JG, Hamilton SR, Baylin SB, Issa JP: Association between CpG island methylation and microsatellite instability in colorectal cancer. Cancer Res 1997, 57:3370-3374 [PubMed] [Google Scholar]
- 17.Costa A, Marasca R, Valentinis B, Savarino M, Faranda A, Silvestrini R, Torelli G: p53 gene point mutations in relation to p53 nuclear protein accumulation in colorectal cancers. J Pathol 1995, 176:45-53 [DOI] [PubMed] [Google Scholar]
- 18.Gundersen HJ, Osterby R: Sampling efficiency and biological variation in stereology. Mikroskopie 1980, 37:143-148 [Google Scholar]
- 19.Taniyama K, Sasaki N, Wada S, Sasaki M, Miyoshi N, Nakai H, Kodama S, Nakatsuka H, Tahara E: Comparison of proliferative activities and metastases between two subtypes classified at the deeply infiltrating sites of colorectal moderately differentiated adenocarcinomas. Pathol Int 1996, 46:195-203 [DOI] [PubMed] [Google Scholar]
- 20.Koochekpour S, Merzak A, Pilkington GJ: Extracellular matrix proteins inhibit proliferation, upregulate migration and induce morphological changes in human glioma cell lines. Eur J Cancer 1995, 31:375-380 [DOI] [PubMed] [Google Scholar]
- 21.Pilkington GJ: Glioma heterogeneity in vitro: the significance of growth factors and gangliosides. Neuropathol Appl Neurobiol 1992, 18:434-442 [DOI] [PubMed] [Google Scholar]
- 22.Henriet P, Blavier L, Declerck YA: Tissue inhibitors of metalloproteinases (TIMP) in invasion and proliferation. APMIS 1999, 107:111-119 [DOI] [PubMed] [Google Scholar]
- 23.Tominaga O, Nita ME, Nagawa H, Fujii S, Tsuruo T, Muto T: Expressions of cell cycle regulators in human colorectal cancer cell lines. Jpn J Cancer Res 1997, 88:855-860 [DOI] [PMC free article] [PubMed] [Google Scholar]
- 24.Fidler IJ: Orthotopic implantation of human colon carcinomas into nude mice provides a valuable model for the biology and therapy of metastasis. Cancer Metastasis Rev 1991, 10:229-243 [DOI] [PubMed] [Google Scholar]
- 25.Brabletz T, Jung A, Hermann K, Gunther K, Hohenberger W, Kirchner T: Nuclear overexpression of the oncoprotein beta-catenin in colorectal cancer is localized predominantly at the invasion front. Pathol Res Pract 1998, 194:701-704 [DOI] [PubMed] [Google Scholar]
- 26.Tetsu O, McCormick F: Beta-catenin regulates expression of cyclin D1 in colon carcinoma cells. Nature 1999, 398:422-426 [DOI] [PubMed] [Google Scholar]
- 27.Wieser RJ, Faust D, Dietrich C, Oesch F: p16INK4 mediates contact-inhibition of growth. Oncogene 1999, 18:277-281 [DOI] [PubMed] [Google Scholar]