

Abstract
We have investigated the role of a single-stranded RNA junction, J1/2, that connects the substrate-containing P1 duplex to the remainder of the Tetrahymena group I ribozyme. Single turnover kinetics, fluorescence anisotropy, and single molecule FRET for a series of J1/2 mutants were used to probe the sequence dependence of catalytic activity, P1 dynamics, and the thermodynamics of docking of the P1 duplex into the ribozyme’s catalytic core. We found A29, the center A of three adenosine residues in J1/2, contributes two orders of magnitude to overall ribozyme activity, and double mutant cycles suggest that J1/2 stabilizes the docked state of P1 over the undocked state via a tertiary interaction involving A29 and the first base pair in helix P2 of the ribozyme, A31•U56. Comparative sequence analysis of this group I intron subclass suggests that the A29 interaction sets one end of a molecular ruler that specifies, on the other end, the 5′-splice site and that this molecular ruler is conserved among a subclass of group I introns related to the Tetrahymena intron. Our results reveal substantial functional effects from a seemingly simple single-stranded RNA junction and suggest that junction sequences may evolve rapidly to provide important interactions in functional RNAs.
While much focus is placed on highly conserved regions of proteins and functional RNAs, these molecules also contain regions that have limited or no apparent conservation. There are regions of RNAs, such as telomeric RNA, SRP RNA, spliceosomal RNAs, and self-splicing introns, that are conserved only in subgroups,1,2 and there are sequences of no obvious conservation that nevertheless occur in regions that might be expected to have functional consequences.3 Here we report a multifaceted investigation of one such region, the J1/2 junction in the Tetrahymena group I intron (Figure 1).
Figure 1.
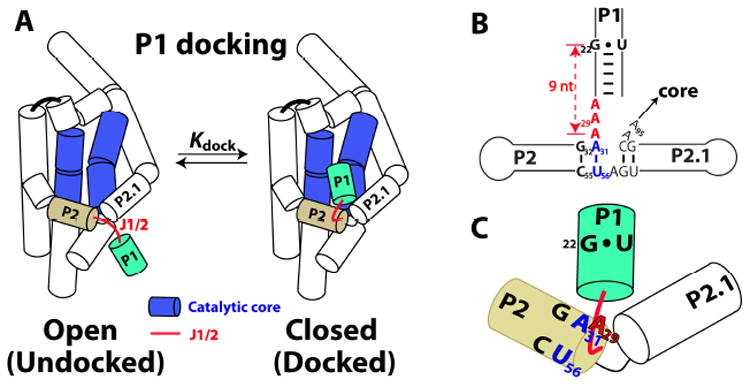
The Tetrahymena group I ribozyme and its J1/2 junction shown schematically.8 (A) The P1 duplex (green) docks into the catalytic core (blue); Kdock (= [docked]/[undocked]) is the equilibrium constant between the undocked and docked states. The single-stranded J1/2 junction (red) connects the substrate containing P1 duplex to the P2 duplex (beige), one of the several peripheral segments of the ribozyme. P denotes paired regions, and J denotes junctions that connect the paired regions. (B) J1/2 (red) and its surroundings, with individual residues highlighted that are mutated or discussed herein. (C) Schematic model of the J1/2 (red line) conformation in the docked state based on results herein. J1/2 exits P2 and is bent to allow the center A of J1/2, A29 (shown in red), to form a tertiary interaction involving the first base pair in P2, A31•U56 (blue); see also Figure S3. The catalytic cleavage site is located a specified number of residues 3′ of this interaction (see Table 1 & text).
J1/2 is not globally conserved in either length or sequence among different group I intron sub-groups or within the IC1 subgroup that includes the Tetrahymena intron.2,4, Nonetheless, J1/2 connects the substrate-containing P1 duplex to the rest of the intron (Figure 1A), and docking of the P1 duplex into tertiary interactions with the intron’s catalytic core is a necessary step that precedes the chemical reaction6,7 (Figure 1A). It was previously shown that shortening or lengthening J1/2 decreases the fidelity of splice site selection in the Tetrahymena ribozyme reaction; the length changes weakened docking of the P1 duplex into tertiary interactions in the correct register and thereby favored docking into and cleavage from alternative registers.4,7 These mutational effects were not as expected for a simple tether, but the prior experiments could not distinguish whether tether flexibility, functional interactions with J1/2, non-native interactions with mutant J1/2 sequences, or steric constraints from the remainder of the ribozyme were responsible.
To understand the role of J1/2, we first used fluorescence polarization anisotropy (FPA) to assess the dynamics of the P1 duplex attached to ribozymes with J1/2 sequence that were systematically mutated. We related the effects of these J1/2 mutations on P1 dynamics to their functional consequences as assessed by single molecule FRET assays of P1 docking and assays of catalytic activity. The results revealed a role for the central A of the AAA J1/2 sequence (A29; Figure 1B & C), and further mutational tests and sequence analyses provided support for a tertiary interaction involving this residue.
To modulate the flexibility of J1/2, we systemically replaced the A residues with U’s, as U residues stack less well than A residues.9,10 Eight ribozymes were investigated, with J1/2 sequences of AAA, AAU, AUA, UAA, AUU, UAU, UUA and UUU. 6-Methyl isoxanthopterin (6-MI) was incorporated into the P1 duplex of each ribozyme (Figure S1A). This fluorescent base analog has the unusual property of maintaining a high quantum yield within helices and thus can be used to follow dynamic properties of individual helices within complex RNAs.11,12 In its open state (Figure 1A, left), the P1 helix is connected to the remainder of the ribozyme by J1/2 but appears to make no specific tertiary interactions.12,13 As expected for the behavior of a tether, the anisotropy decreases, and thus dynamics increase, as the number of U residues in J1/2 increases (Figure S1B). In other words, there is greater randomization of the position of P1 during the fluorescent lifetime of 6-MI as more U residues are introduced.
A simple prediction from a tether model would be that the effect of J1/2 mutations on increasing mobility in the open complex would inversely correlate with the stability of the docked complex, as increased conformational freedom would disfavor the more positioned docked complex. The docking equilibrium constants of the eight mutants were obtained by monitoring the open and closed states using a single molecule FRET (smFRET) assay14-16 (see Supporting Information for details). We observed a striking discordance of the anisotropy and docking behaviors (Figure 2A). Whereas introduction of U residues at any position increased mobility, the docking equilibrium constant was only substantially affected by substitution of the central A, A29. Mutation of either or both of the flanking A residues had effects of less than threefold on docking (Figure 2A, blue), whereas mutation of the central A decreased docking by ~30 fold (Figure 2A, red), regardless of the identity of the flanking residues. This same trend was observed for ribozyme activity in assays that monitored both docking and the chemical step (Figure 2B), but with about three-fold larger effects of A29, either because there is a small additional effect on the chemical step or because the magnitude of the docking effect differs slightly under the different assay conditions.
Figure 2.
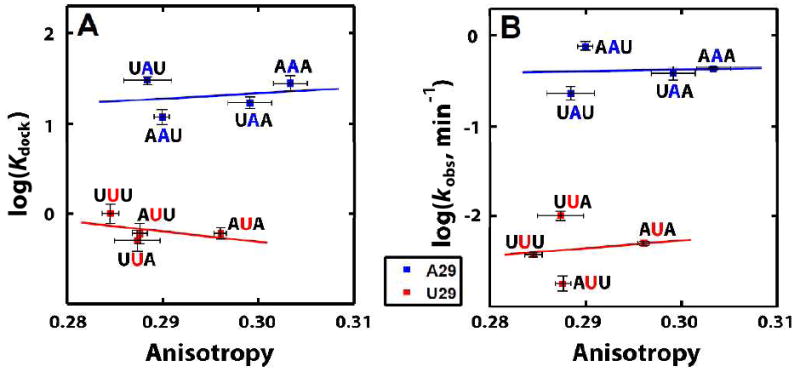
The effect of J1/2 base sequence on (A) the docking equilibrium constant, Kdock, and (B) catalytic activity kobs. The four sequences with the center residue (position 29) as A (blue) are represented by the blue line, and the four sequences with A29 replaced by U (red) are represented by the red line. Kdock in part (A) was obtained from smFRET (see Supporting Information). Activity in part (B) was measured by following the reaction of (E•S•G)o using a 32P-radiolabeled open complex substrate under single-turnover conditions with saturating enzyme and saturating G (2 mM) that assay both docking and the chemical step.17
Conditions
50 mM Na•MOPS, pH 7.0, 10 mM MgCl2 and 25 °C (see Supporting Information for details).
The simplest model to account for all of the data is that the J1/2 flexibility difference between 3A and 3U contributes little to P1 docking and that J1/2 stabilizes P1 docking through tertiary interactions involving A29. To further test this model, we carried out additional mutagenesis studies.
We first tested the base specificity of the putative A29 interaction by determining the catalytic activity of two additional J1/2 mutants with sequences of AGA and ACA. The values of kobs for these mutants were within three fold of that for AUA mutant, with both reacting >80 fold slower than the wild type AAA (Table S1). Thus, the residue 29 effect is specific to A.
We next wanted to identify potential interaction partners for A29. We first crudely assessed the geometrical accessibility of A29 to other residues. Using the structural model for the Tetrahymena group I intron,8 we considered residues within a sphere with its origin at A31 and a radius of 11 Å, roughly the length of an extended 2 nt linker.18 Among the accessible residues, we found that two base pairs in the P2 stem, A31•U56 and G32•C55 (Figure 1B), exhibited some degree of sequence co-conservation with A29 (i.e., the second residue of J1/2 that is 5′ of P2; see below). Double mutant cycles were used to test for interactions19 between A29 and these P2 base pairs. Briefly, the effect from mutation of each of the putative interaction partners (A29 and each of the P2 base pairs) were determined alone and together (Table S1). If there were an interaction, then a lessened effect would be expected with the other mutation present. Such a dependence was observed with A29 and the A31•U56 base pair (Figure 3A). Mutation of either A29 or A31•U56 alone gave 40-80 fold effects, whereas each mutation in a background in which the other mutation is already made gave an effect of <5 fold. In contrast, mutation of G32•C55 had no significant effect, and there was a similar large effect from mutation of A29 whether the G32•C55 base pair was wild type or mutant (Figure 3B). While the simplest model for the functional interaction between A29 and the A31•U56 base pair would be a base triple, additional mutagenesis tests provided no evidence for an isosteric base triple (Table S4). Specifically, double mutant cycles revealed that whereas there was energetic coupling of A29 with the A31•U56 mutant to C•G (Figure 3A), as noted above, no energetic coupling was observed with G•C and U•A base pairs (Tables S4). Thus, more complex models, involving additional interactions and/or conformation rearrangements must be invoked.
Figure 3.
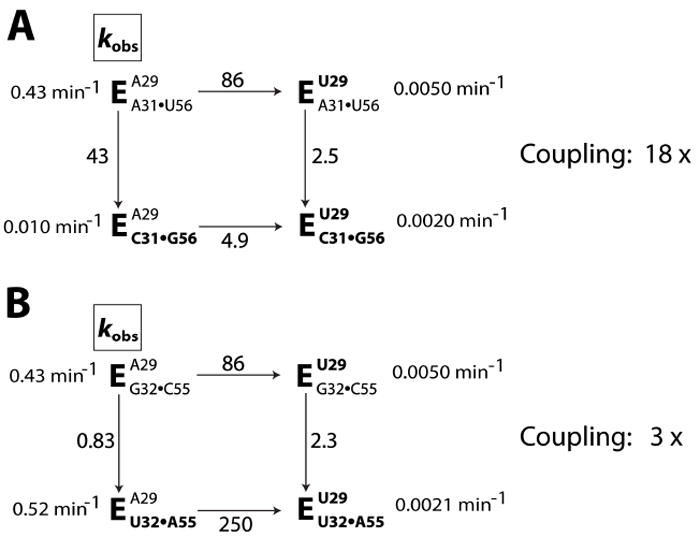
Testing a potential contact between A29 and two base pairs in P2, A31•U56 (A) and G32•C55 (B) via double mutant cycles. The wild-type sequence has A29, A31•U56, and G32•C55. The introduced mutations are shown in bold. The numbers adjacent to the arrowed lines are the fold decrease in kobs from introduction of the mutation. The amounts of coupling between the A29 interaction and the P2 mutation are shown on the right.
We mutated additional residues potentially in the vicinity of A29. Modest coupling was observed for residue A95 (3 fold), A304 (2 fold) and A270 (≥10 fold enhancement of the A29 effect) (Table S4 and S5 and unpublished results). Conversely, A269 and the first two base pairs of P2.1 have no energetic interaction with A29 (Table S5 and unpublished results). These results support a model in which A29 is situated near to and possibly interacts with A31•U56, and also provide evidence for an extended network of indirect interactions that extends to the the catalytic core (A270 and A304, Figure S3). The absence of a larger anisotropy effect for the A29 mutants than for the other J1/2 mutants (Figure S1B; Table S1) suggests that this interaction network does not include A29 in the undocked state (Figure S1B). Thus, the A29 interaction very likely forms along with docking of P1.
The functional interaction between the A29 of J1/2 and the A31•U56 base pair led us to look more closely at potential phylogenetic relationships using the extensive sequence database for group I introns.20 We found, within the IC1 subgroup of introns, that the mutual information (MI)21 is significantly higher between residue 29, the second residue upstream of P2, and residues 31 and 56 (MI = 0.29 and 0.19, respectively), which compose the first base pair in P2, than the MI between residue 29 and random residues in the rest of the intron sequence (MI = 0.06 ± 0.06; See Table S2 for more information). The high MI comes from a strong co-conservation between A29 and the A31•U56 base pair and is further illustrated in Figure 4 using sequence logos.23 The observed sequence co-conservation between A29 and the A31•U56 base pair is consistent with a functional interaction, as supported by the double-mutant cycles described above. Despite the strong co-conservation, there is no covariation and no observed isosteric three-base combinations of residue 29, 31 and 56, also matching the experimental functional tests described above (Table S4).
Figure 4.
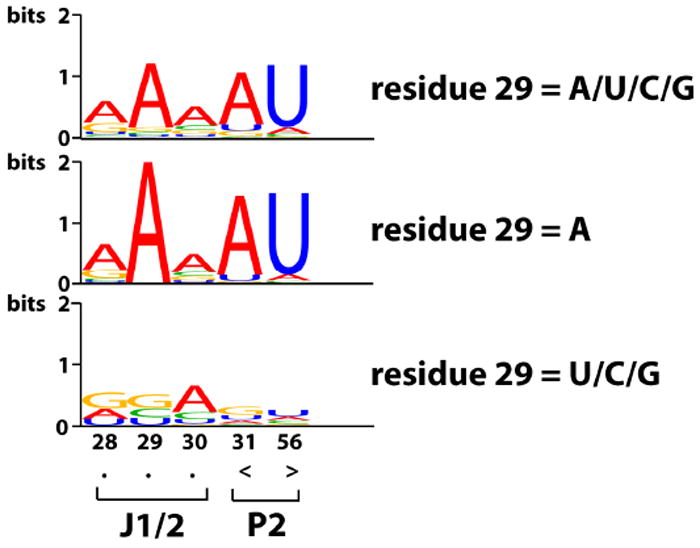
Co-conservation of A29 and the A31•U56 base pair.20 The height of the letter for a base type i, i = A/U/G/C, at residue r in the sequence logos23 is fi,r*Ir in unit of bits, where fi,r is the fraction of residue r that is base type i and Ir = 2 + sum(fi,r*log2fi,r) is the information content24 of residue r. The top sequence logo includes all sequences that have a residue 29. (Residue 29 is defined as the second base 5′ to P2 in the single stranded region of J1/2; sequences with J1/2 of 2 nt or longer all have a residue 29; see also Tables 1 and S3.) The middle sequence logo includes only the sequences with A at residue 29. The bottom sequence logo includes the sequences with residue 29 being anything other than A. The dots under residue 28-30 indicate unpaired residues and the brackets under residue 31 and 56 indicate base pairing.
A conserved number of residues of twelve from a GNRA tetraloop at the end of the P2 helix to the conserved G•U wobble cleavage site in P1 was previously observed in several group I intron subgroups (IC3, IB2, IB4, IA1, IA2 and IA3),2,22,23 but not in the IC1 subgroup that lacks this tetraloop.2 We asked whether there might be an analogous relationship for the IC1 subgroup that includes the Tetrahymena intron (Table 1). Many introns within the IC1 subgroup have a combined length of J1/2 and P1 (up to the conserved G•U pair, Figure 1) of nine (327 of 810, red diagonal in Table 1), and nearly all of these introns have an A residue two residues upstream of P2 and an A•U base pair as the first base pair of P2 (314 of 327; Table 1, red). Thus, a measuring mechanism is suggested, consistent with prior observations of reduced 5′-splice site fidelity upon lengthening or shortening J1/2 of the Tetrahymena intron.4,7
Table 1.
Summary of the comparative sequence analysis of different length combinations of J1/2 and P1 for the IC1 subgroup of group I introns.
| J1/2 length, nt | P1 length, bp | ||||||
|---|---|---|---|---|---|---|---|
| 1-2 | 3 | 4 | 5 | 6 | 7 | 8 | |
|
|
|||||||
| 6-11 | 0 | 0 | 1 (1.0, 1.0) | 7 (0.29, 0.0) | 0 | 0 | 0 |
| 5 | 0 | 0 | 1 (1.0, 1.0) | 3 (0.67, 0.0) | 2 (1.0, 0.0) | 0 | 0 |
| 4 | 0 | 0 | 0 | 291 (0.97, 0.99) | 10 (0.40, 0.75) | 0 | 0 |
| 3 | 0 | 0 | 1 (0.0, –) | 20 (0.75, 0.27) | 27 (1.0, 0.96) | 2 (1.0, 0.50) | 0 |
| 2 | 0 | 9 (0.0, –) | 3 (0.33, 1.0) | 6 (0.33, 0.50) | 21 (0.38, 0.0) | 8 (1.0, 0.88) | 0 |
| 1 | 1 | 2 | 89 | 112 | 1 | 0 | 0 |
| 0 | 1 | 1 | 3 | 178 | 6 | 3 | 1 |
The number before a bracket is the total number of sequences for a given J1/2 (row) and P1 (column) length (the P1 length includes the conserved G•U base pair that specifies the cleavage site). Sequences in the IC1 group I intron database20 (3%) that do not have the conserved cleavage site G•U base pair were excluded. The two numbers in the parentheses are the fraction of residue 29 that is A followed by the fraction of residue 31 that is A when residue 29 is A. In our comparative sequence analysis of J1/2 residues, the residue equivalent to A29 is the second nucleotide upstream of P2. For J1/2 sequences of length zero or one, there is no residue equivalent of A29, hence no values in parenthesis. Subgroups with a combined P1 and J1/2 length of 9 nt are colored in red. Other highly populated subgroups were colored to represent a combined P1 and J1/2 length of six (green) or five (blue).
Interestingly, a significant number of IC1 introns do not follow this “rule of nine”, with some of these other introns having and some not having the above-noted A•U base pair (e.g., Table 1, blue & green). It appears that there have been multiple solutions within this subgroup for ensuring accurate 5′-splice site selection, and there is more to be learned about the evolutionary journey of these fascinating catalytic RNAs.
Counterintuitively, junction sequences without apparent conservation may be used liberally to optimize RNA function. We have shown that J1/2 plays sophisticated roles in RNA function. J1/2 is important for substrate binding and ribozyme activity through interactions involving the center A of J1/2, A29, of the Tetrahymena intron. A29 interacts with an extended network of residues connecting J1/2 with the RNA core. Further, A29 and the constant J1/2 and P1 length allow distal tuning of the ribozyme activity and specificity via a molecular ruler. These results suggest that regions referred to as ‘linkers’ can be important to function. Junctions that are not constrained to form secondary or tertiary structures may be able to extensively explore sequence and conformational space and thus rapidly evolve new functional interactions. The ability of J1/2, a seemingly nonconserved linker, to be co-opted for function provides an important precedent and model for dissection the function of other structured RNAs.
Supplementary Material
Acknowledgments
We thank Pablo Cordero, Alain Laederach, and members of the Herschlag lab for comments on the manuscript. This work was supported by NIH Grant GM49243.
Footnotes
Supporting Information: Methods, Table S1 of anisotropy, Kdock and kobs data, Tables S2 and S3 with additional comparative sequence analysis, Tables S4 and S5 with additional P1 docking data, Table S6 of heterogeneity in smFRET measurements, Figure S1 showing P1 anisotropy results, Figure S2 showing typical smFRET traces, and Figure S3 showing functional effects of mutations. This material is available free of charge via the Internet at http://pubs.acs.org.
References
- 1.Chen JL, Blasco MA, Greider CW. Cell. 2000;100:503–514. doi: 10.1016/s0092-8674(00)80687-x. [DOI] [PubMed] [Google Scholar]
- 2.Michel F, Westhof E. J Mol Biol. 1990;216:585–610. doi: 10.1016/0022-2836(90)90386-Z. [DOI] [PubMed] [Google Scholar]
- 3.Bonen L, Vogel J. Trends Genet. 2001;17:322–331. doi: 10.1016/s0168-9525(01)02324-1. [DOI] [PubMed] [Google Scholar]
- 4.Young B, Herschlag D, Cech TR. Cell. 1991;67:1007–1019. doi: 10.1016/0092-8674(91)90373-7. [DOI] [PubMed] [Google Scholar]
- 5.Che AJ, Knight TF., Jr Nucleic Acids Res. 2010;38:2748–2755. doi: 10.1093/nar/gkq186. [DOI] [PMC free article] [PubMed] [Google Scholar]
- 6.Bevilacqua PC, Kierzek R, Johnson KA, Turner DH. Science. 1992;258:1355–1357. doi: 10.1126/science.1455230. [DOI] [PubMed] [Google Scholar]
- 7.Herschlag D. Biochemistry. 1992;31:1386–1399. doi: 10.1021/bi00120a015. [DOI] [PubMed] [Google Scholar]
- 8.Lehnert V, Jaeger L, Michel F, Westhof E. Chem Biol. 1996;3:993–1009. doi: 10.1016/s1074-5521(96)90166-0. [DOI] [PubMed] [Google Scholar]
- 9.Tso POP, Melvin IS, Olson AC. J Am Chem Soc. 1963;85:1289–1296. [Google Scholar]
- 10.Holcomb DN, Tinoco I. Biopolymers. 1965;3:121–133. [Google Scholar]
- 11.Hawkins ME, Pfleiderer W, Balis FM, Porter D, Knutson JR. Anal Biochem. 1997;244:86–95. doi: 10.1006/abio.1996.9879. [DOI] [PubMed] [Google Scholar]
- 12.Shi X, Mollova ET, Pljevaljcic G, Millar DP, Herschlag D. J Am Chem Soc. 2009;131:9571–9578. doi: 10.1021/ja902797j. [DOI] [PMC free article] [PubMed] [Google Scholar]
- 13.Grant GPG, Boyd N, Herschlag D, Qin PZ. J Am Chem Soc. 2009;131:3136–3137. doi: 10.1021/ja808217s. [DOI] [PMC free article] [PubMed] [Google Scholar]
- 14.Bartley LE, Zhuang XW, Das R, Chu S, Herschlag D. J Mol Biol. 2003;328:1011–1026. doi: 10.1016/s0022-2836(03)00272-9. [DOI] [PubMed] [Google Scholar]
- 15.Greenfeld M, Pavlichin DS, Mabuchi H, Herschlag D. Plos one. doi: 10.1371/journal.pone.0030024. In press. [DOI] [PMC free article] [PubMed] [Google Scholar]
- 16.Zhuang XW, Bartley LE, Babcock HP, Russell R, Ha TJ, Herschlag D, Chu S. Science. 2000;288:2048–2050. doi: 10.1126/science.288.5473.2048. [DOI] [PubMed] [Google Scholar]
- 17.Herschlag D, Eckstein F, Cech TR. Biochemistry. 1993;32:8299–8311. doi: 10.1021/bi00083a034. [DOI] [PubMed] [Google Scholar]
- 18.Smith SB, Cui YJ, Bustamante C. Science. 1996;271:795–799. doi: 10.1126/science.271.5250.795. [DOI] [PubMed] [Google Scholar]
- 19.Horovitz A. Fold Des. 1996;1:R121–R126. doi: 10.1016/S1359-0278(96)00056-9. [DOI] [PubMed] [Google Scholar]
- 20.Zhou Y, Lu C, Wu Q-J, Wang Y, Sun Z-T, Deng J-C, Zhang Y. Nucleic Acids Res. 2008;36:D31–D37. doi: 10.1093/nar/gkm766. [DOI] [PMC free article] [PubMed] [Google Scholar]
- 21.Gutell RR, Power A, Hertz GZ, Putz EJ, Stormo GD. Nucleic Acids Res. 1992;20:5785–5795. doi: 10.1093/nar/20.21.5785. [DOI] [PMC free article] [PubMed] [Google Scholar]
- 22.Haugen P, Simon DM, Bhattacharya D. Trends Genet. 2005;21:111–119. doi: 10.1016/j.tig.2004.12.007. [DOI] [PubMed] [Google Scholar]
- 23.Schneider TD, Stephens RM. Nucleic Acids Res. 1990;18:6097–6100. doi: 10.1093/nar/18.20.6097. [DOI] [PMC free article] [PubMed] [Google Scholar]
- 24.Schneider TD, Stormo GD, Gold L, Ehrenfeucht A. J Mol Biol. 1986;188:415–431. doi: 10.1016/0022-2836(86)90165-8. [DOI] [PubMed] [Google Scholar]
Associated Data
This section collects any data citations, data availability statements, or supplementary materials included in this article.