

Abstract
OCT (22-oxa-calcitriol), a vitamin D analog, has been reported to show strong inhibitory effects on mesangial cell proliferation in vitro. In the present study, we report a study of the effect of OCT on anti-thy-1 glomerulonephritis. Both OCT and 1,25(OH)2D3 significantly inhibited mesangial cell proliferation, the degree of glomerulosclerosis, and albuminuria at day 8 compared to the disease control group. The OCT-treated group showed normal calcium levels but the 1,25(OH)2D3-treated group showed higher levels. The disease control group showed a marked increase of type I and type IV collagens, and α-smooth muscle actin (α-SMA) compared to the normal group. The treatment of OCT or 1,25(OH)2D3 significantly reduced the expression of these proteins. The mRNA of the glomeruli of anti-thy-1 model expressed significantly higher levels of type I and type IV collagens, and α-SMA at day 8 compared to normal rats. Treatment with OCT or 1,25(OH)2D3 inhibited the mRNA expressions of type I and type IV collagens, as well as that of α-SMA. These data demonstrate that OCT inhibits mesangial cell proliferation and extracellular matrix expansion with a low calcemic activity. Disease control rats showed significantly increased levels of transforming growth factor-β1 protein in the glomeruli, but treatment with OCT or 1,25(OH)2D3 markedly reduced this expression. The levels of mRNA in glomeruli were also consistent with these protein levels. Therefore, the suppressive effect of OCT may be mediated by inhibition of transforming growth factor-β1. The present results suggest that OCT has potential for use in therapeutic strategy for the treatment of glomerulonephritis without inducing hypercalcemia.
A number of progressive glomerular diseases are characterized by initial mesangial cell proliferation, which is followed by glomerulosclerosis, and finally develops to end-stage kidney disease. Examples of this process are membranoproliferative glomerulonephritis, diabetic nephropathy, and IgA nephropathy.1,2 Nonanticoagulant heparin, a potent in vitro inhibitor of mesangial cell proliferation, inhibits mesangial cell proliferation and matrix expansion in mesangioproliferative glomerulonephritis.3 Treatment with anti-platelet-derived growth factor also blocks mesangial cell proliferation in vivo, preventing the development of glomerulosclerosis.4 This suggests that mesangial cell proliferation may play an important role in the development of glomerular lesions. Therefore, the search for agents capable of inhibiting mesangial cell proliferation is clinically important for progressive glomerular change.
Recently, 1,25(OH)2D3 was shown to have a preventive effect in progressive glomerular damage in a renal ablation model.5 However, 1,25(OH)2D3 has an adverse effect in that its use leads to hypercalcemia and hyperphosphatemia, which eventually represent risk factors for the progression of renal injury. It is, therefore, difficult to use 1,25(OH)2D3 for the practical treatment of patients at the predialysis stage. One of the vitamin D analogs, 22-oxa-calcitriol (OCT), is a potent regulator of cell differentiation6,7 and of immunological function,8 and has a low activity in relation to hypercalcemia. We recently demonstrated that OCT markedly regulated mesangial cell proliferation in vitro compared to 1,25(OH)2D3 in a transforming growth factor (TGF)-β mediated manner.9 In the present study, we report an investigation of the effect of OCT in vivo using a model of mesangial proliferative glomerulonephritis induced by anti-thy-1 glomerulonephritis. This glomerular lesion is characterized by mesangial cell proliferation and subsequent mesangial matrix expansion by the accumulation of extracellular matrix protein. The findings herein show that OCT inhibits mesangial cell proliferation and extracellular matrix expansion, and prevents albuminuria with low calcemic activity in anti-thy-1 glomerulonephritis. The effect of OCT could be mediated by the inhibition of TGF-β1 in this model.
Materials and Methods
Experimental Design
Male Wistar rats weighing ∼250 g were used for all experiments. The rats were maintained on standard chow and water ad libitum. OCT was synthesized by Chugai Pharmaceutical Co., Ltd, Tokyo, Japan. 1,25(OH)2D3 was purchased from Philips Duphar Co. (Amsterdam, The Netherlands). Four groups of 20 rats each were used. Group 1 contained normal control rats that were given an intravenous injection of 0.1 ml of phosphate-buffered saline (PBS) (pH 8.0) containing 0.2% ethanol and 0.01% Tween 20 (PBS-ET) on alternate days. Group 2 was a disease control group, that received an injection of 0.1 ml of PBS-ET on alternate days intravenously from the next day, after an intravenous injection of monoclonal anti-Thy-1.1 antibody (OX-7), 1 mg/kg body weight, diluted with PBS (pH 7.4) as described previously.10 Group 3 was treated intravenously with OCT at 0.4 μg/kg body weight diluted with PBS-ET (total volume 0.1 ml) on alternate days from the next day after an intravenous injection of OX-7. Group 4 was treated with 1,25(OH)2D3 at 0.4 μg/kg body weight diluted with PBS-ET (total volume, 0.1 ml) on alternate days after an intravenous injection of OX-7. Urine samples were collected at day 8. All rats were sacrificed under ether anesthesia by heart puncture at day 8, day 14, and day 28. Blood samples were collected and both kidneys were removed. Three independent sets of experiment were performed. The food intakes and body weights were examined at day 8.
Biochemical Measurements
Urinary albumin excretion was measured by using Nephrat II enzyme-linked immunosorbent assay kit (Exocell, INC., PA) and urine creatinine was determined using the picric acid method (Creatinine test Wako; Wako, Osaka, Japan). Urine albumin/creatinine ratio was used to estimate quantitation of albuminuria.11,12 Rats were sacrificed under ether anesthesia by heart puncture. Blood samples were collected via heart puncture and both kidneys were removed. Serum creatinine, blood urea nitrogen (BUN), calcium, and phosphate were determined with a Hitachi Model 736 autoanalyzer.
Light Microscopy
The kidneys were fixed in methyl Carnoy’s solution and embedded in paraffin for light microscopic examination and 2-μm-thick sections were stained with hematoxylin and eosin, periodic acid Schiff’s reagent, and periodic silver methenamine. The total number of nuclei per glomerular cross-section was determined and glomerulosclerosis was assessed on all glomeruli. The severity of sclerosis for each glomerulus was graded from 0 to 4+ based on the modified method of Raij and colleagues.13 A whole kidney sclerosis index was obtained by averaging the scores from all glomeruli in each section.
Morphometric Analysis
The profile areas of 100 glomerular tufts were measured on the periodic acid Schiff’s reagent-stained sections with a digitized graphic pad and the NIH image. Both superficial cortical and juxtamedullary glomeruli were measured. The mean glomerular volume was derived from the mean equatorial area of the glomeruli of each specimen, as approximated by the method of DeHoff and Rhines14 for the mean size of particles with a similar shape. The mean area of each class (A1, A2,… … ..An.) was calculated, to determine the harmonic mean (z) of the profile areas (z = 1/n [1/A1 + 1/A2 +… . . 0.1/An]. The mean equatorial area (a[mean]) was estimated from equation a[mean] = K2k4/z where k2 and k4 are dimensional measures to be estimated, and the shape or the particles. The value of k2 was set at 1 and that of k4 at 3.14/2, on the assumption that the glomeruli correspond to spheres or ellipsoids.
Immunohistochemistry
Four-μm-thick cryostat sections were processed by an indirect immunoperoxidase technique. The following primary antibodies were used: an IgG fraction of polyclonal guinea pig anti-rat type I collagen,15 an IgG fraction of polyclonal rabbit anti-rat type IV collagen,15 and an IgG fraction of polyclonal rabbit TGF-β1 (Santa Cruz Biotechnology, Inc., Santa Cruz, CA). An immunofluorescence detection of glomerular α-smooth muscle actin (α-SMA) was performed on 4-μm-thick cryostat sections using an indirect immunofluorescence procedure. Monoclonal antibody anti-α-SMA (Sigma Chemical Co., St Louis, MO) was used as the primary antibody, followed by a mouse IgG (Tago Inc., Camarilb, CA) and fluorescein isothiocyanate conjugated with streptavidin (Zymed Laboratories, Inc., South San Francisco, CA). To evaluate the staining for type I and type IV collagens or TGF-β1 or α-SMA each glomerulus was graded semiquantitatively as described previously.16 The specificities of the stainings of type I collagen and TGF-β1 were confirmed by the absorption experiment, which were examined preincubating each antibody with excess of the corresponding specific antigen (rat collagen type I, C7661; Sigma Chemical Co.; and TGF-β1 peptide, sc146P; Santa Cruz Biotechnology, Inc.).
Quantitation of Glomerular Cell Proliferation
Proliferation cell nuclear antigen (PCNA) was identified by modified an immunohistology method described previously.17 Methylcarnoy-treated paraffin sections were deparaffinized with xylene and graded ethanol. After blocking endogenous peroxidase with 3% hydrogen peroxidase, the sections were treated with blocking kit for endogenous biotin (Vector Laboratories, Burlingame, CA). They were incubated with anti-PCNA for 60 minutes (DAKO, Burlingame, CA), with biotinylated anti-mouse IgG for 30 minutes (Vector), and avidin-biotin complex (Vector) followed by diaminobenzidine peroxide and counterstained with methyl green. For each sample, 50 glomeruli were sequentially selected and PCNA-positive cells were quantitated.
Glomerular RNA Preparation and Quantitative Polymerase Chain Reaction (PCR)
Total RNA was prepared from glomeruli that had been isolated by the graded sieving procedure. Quantitative PCR was performed using real time Taqman TM technology18 and analyzed on a Model 7700 sequence detector (Applied Biosystems, Foster City, CA).19 Five independent samples from each group were measured. Primers and the TaqMan probe for 18s ribosomes were purchased from Perkin-Elmer Applied Biosystems. Table 1▶ shows the sequences for the TaqMan probes and primers used. AmpliTaqMan DNA polymerase extended the primer and displaced the TaqMan probe through its 5′ to 3′ exonuclease activity. The probes were labeled with a reporter fluorescent dye 6-carboxy-fluorescein or 2,7-dimethoxy-4,5-dichloro-6-carboxy-fluorescein at the 5′ end and a quencher fluorescent dye (6-carboxy-tetramethyl-rhodamine) at the 3′ end. Nuclease degradation of the hybridization probe removed the quenching effect of the 6-carboxy-tetramethy-rhondamine from the 6-carboxy-fluorescein or 2,7-dimethoxy-4,5-dichloro-6-carboxy-fluorescein fluorescent emission, thus increasing the peak fluorescent emission at 517 and 554 nm, respectively. No signal was emitted when the probe was intact. The conditions of one-step reverse transcriptase-PCR were as follows: 2 minutes at 50°C, 3 minutes at 60°C, 5 minutes at 95°C followed by 40 cycles of 20 seconds at 94°C and 1 minute at 60°C. The assay used an instrument capable of measuring fluorescence in real time (ABI Prism 7700 sequence detector, Perkin-Elmer Applied Biosystems). Signals were detected according to the manufacturer’s instructions. A computer algorithm compared the amount of reporter dye emission (R) with the quenching dye emission (Q) during the PCR amplification, generating an Rn value as follows: Rn = (Rn+)−(Rn−), where Rn+ is (the emission intensity of the reporter)/(the emission intensity of the quencher at any given time in the reaction tube), and Rn− is (the emission intensity of the reporter)/(the emission intensity of the quencher measured before PCR amplification in the same reaction tube). The Rn value represents the emission of the reporter over the starting background fluorescence and was used for construction of amplification plots.
Table 1.
Primers and Probes Used in this Study
| Target sequence | Primer/probe | Sequence |
|---|---|---|
| Type I collagen | Forward primer | 5′-CCAAGGAGAAAAAGCATGTCTG-3′ |
| TaqMan probe | 5′-TTTGGAGAGAGCATGACCGATGGA-3′ | |
| Reverse primer | 5′-CGCTTCCATACTCGAACTGGA-3′ | |
| Type IV collagen | Forward primer | 5′-GACCCCGAGGTTAGGAAGG-3′ |
| TaqMan probe | 5′-ATCGAGCCGAGCCTAGAGCTGAAAGA-3′ | |
| Reverse primer | 5′-CACTCGGTCCATGATCCCA-3′ | |
| TGF-β1 | Forward primer | 5′-AAGTCACCCGCGTGCTAATG-3′ |
| TaqMan probe | 5′-TGGACCGCAACAACGCAATCTATG-3′ | |
| Reverse primer | 5′-CCCGAATGTCTGACGTATTGAA-3′ | |
| α-SMA | Forward primer | 5′-CACGGCATCATCACCAACTG-3′ |
| TaqMan probe | 5′-ACGACATGGAAAAGATCTGGCACCAC-3′ | |
| Reverse primer | 5′-ACGCGAAGCTCGTTATAGAAGG-3′ |
Statistical Analysis
All values are expressed as the mean ± SE and analyzed by Mann-Whitney nonparametric analysis, or one-way analysis of variance with a modified t-test, performed using the Bonferroni correction. Statistical significance was defined as P < 0.05.
Results
Urine Albumin Excretion
The urine albumin excretion, which was corrected for urine creatinine concentration as denominator, is demonstrated in Figure 1▶ . The disease control group (group 2) showed markedly increased amounts of urine albumin, compared to the normals. The OCT-treated group and the 1,25(OH)2D3-treated group (groups 3 and 4) had a significantly lower urine albumin to creatinine ratio than the disease control.
Figure 1.

Urine albumin/creatinine excretion.
Plasma Biochemistry
The serum concentration of creatinine, BUN, calcium, and phosphate are represented in Figure 2▶ . There were no differences in serum creatinine levels between the disease control group and the OCT or the 1,25(OH)2D3 groups. BUN values were significantly lower in boththe OCT-and 1,25(OH)2D3-treated groups, compared tothe disease control group, however, BUN values werenot different between the OCT-treated group and 1,25(OH)2D3-treated group. Serum calcium was significantly higher in the 1,25(OH)2D3 group, compared to the disease control group. On the other hand, no difference in serum calcium between the disease control group and the OCT group was detected. The serum phosphate in both the OCT and 1,25(OH)2D3 groups were significantly lower compared to the disease control group.
Figure 2.

Biochemical data.
Histological Findings
Figure 3▶ shows a representative light microscopic picture in each group. The disease control group showed a markedly increased level of glomerular proliferation, on the other hand, the OCT- or 1,25(OH)2D3-treated groups ameliorated glomerular cell proliferation (Figure 4)▶ .Proliferating cells, detected by PCNA staining, weremarkedly increased in disease controls, and OCT- or 1,25(OH)2D3-treated groups had significantly decreased PCNA-positive cells. The disease control group showed increases in the mesangial matrix. The glomerulosclerosis index was higher in the disease control group, compared to the normal control group (Figure 4)▶ . Both the OCT- and 1,25(OH)2D3-treated groups significantly decreased the glomerulosclerosis index. However, no differences were found in the mean glomerular volume in each group (Figure 4)▶ . The mesangiolysis was observed at day 8 in the disease control group, and the lesion was also found in both the OCT- and 1,25(OH)2D3-treated groups. The mesangiolysis was decreased at day 14 in both the OCT- and 1,25(OH)2D3-treated groups and it was completely resolved at day 28 (Figure 3)▶ .
Figure 3.
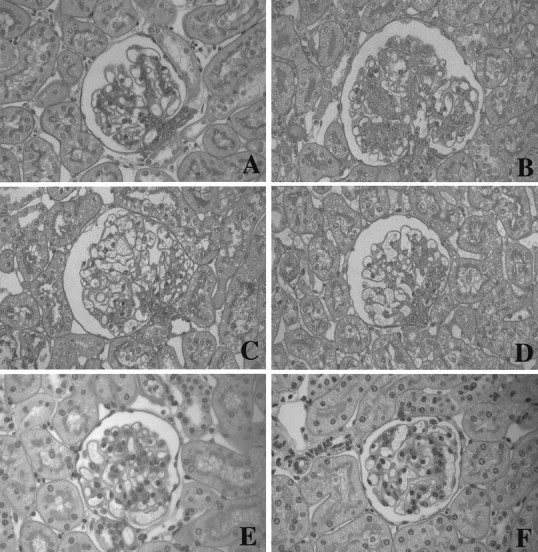
Glomerular periodic acid Schiff’s reagent staining of tissue obtained from a rat at 8 days after an intravenous injection with OX-7. A: Normal control rat. B: Disease control rat. C: OCT-treated rat after disease induction. D: 1,25(OH)2D3-treated rat after disease induction. E: OCT-treated rat at day 14 after disease induction. F: OCT-treated rat at day 28.
Figure 4.

Morphometric analysis of glomerular lesions. A: Glomerular cell proliferation. B: Sclerosis index. C: Glomerular volume. D: Percentage of glomerular PCNA-positive cells.
Immunoperoxidase Staining
Type IV collagen was clearly visible along the glomerular basement membrane as well as weakly in the mesangial area in the normal control group (Figure 5E)▶ . Type I collagen and α-SMA were not found in the normal glomeruli (Figure 5, A and I)▶ . In the disease control group these proteins were strongly positive in the expanded mesangial area (Figure 5; F, B, and J▶ ). Both the OCT- and 1,25(OH)2D3-treated groups had a significantly reduced expression of these proteins in glomeruli (Figure 5▶ and Table 2▶ ). A weak level of expression of TGF-β1 proteins was found in normal glomeruli, but was diffuse and strongly positive in diseased glomeruli. OCT and 1,25(OH)2D3 reduced the expression of TGF-β1 in glomeruli (Figure 5▶ and Table 2▶ ). The specificities of the staining of type I collagen and TGF-β1 was performed with the absorption study using excess amounts of each specific antigen, and the stainings of both type I collagen and TGF-β1 were completely blocked (Figure 6)▶ .
Figure 5.
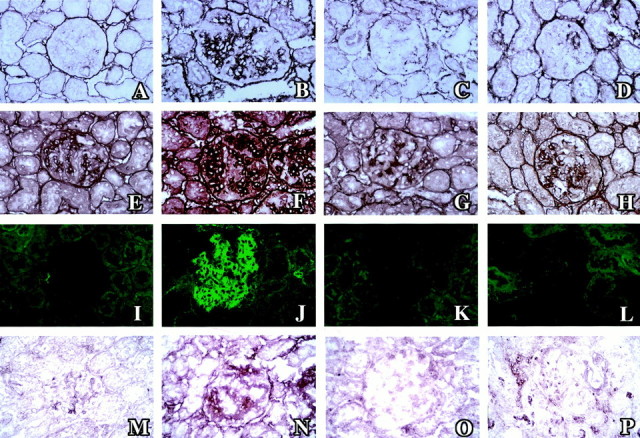
Immunohistochemical glomerular staining for type I collagen (A–D), type IV collagen (E–H), α-SMA (I–L), and TGF-β1 (M–P) in normal control rats (A, E, I, and M), disease control rats (B, F, J, and N), OCT-treated rats (C, G, K, and O) and 1,25(OH)2D3-treated rats (D, H, L, and P).
Table 2.
Glomerular Staining Scores
| Type I collagen | Type IV collagen | TGF-β1 | α-SMA | |
|---|---|---|---|---|
| Normal control rats (n = 5) | 0.20 ± 0.02 | 1.05 ± 0.03 | 0.25 ± 0.03 | 0.60 ± 0.03 |
| Disease control rats (n = 5) | 2.22 ± 0.07* | 2.55 ± 0.18* | 1.62 ± 0.06* | 2.18 ± 0.28* |
| OCT-treated rats (n = 5) | 1.07 ± 0.03† | 1.02 ± 0.04† | 0.62 ± 0.04*† | 0.97 ± 0.08*† |
| 1,25(OH)2D3-treated rats (n = 5) | 1.30 ± 0.06*† | 1.30 ± 0.06† | 0.80 ± 0.06*†‡ | 1.06 ± 0.04*† |
Mean ± SE.
*P < 0.05 versus normal control rats.
†P < 0.05 versus disease control rats.
‡P < 0.05 versus OCT-treated rats.
Figure 6.

The absorption experiments of the stainings of type I collagen and TGF-β1 with each specific antigen in disease control rat at day 8. A: Type I collagen staining. B: Type I collagen staining absorbed with specific antigen. C: TGF-β1 staining. D: TGF-β1 staining absorbed with specific antigen.
Expression of mRNA
Table 3▶ shows the mean mRNA concentrations of type I and type IV collagens, α-SMA, and TGF-β1, which were corrected for the level of 18s RNA. To normalize for the differences in the amount of total RNA added to each reaction, the 18s ribosome was selected as an endogenous RNA control. The mRNA expressions of type I and IV collagens as well as α-SMA were significantly increased in the diseased glomeruli compared to normals. OCT and 1,25(OH)2D3 led to a reduction in the level of expression of these mRNAs. The expression of TGF-β in glomeruli showed significantly an approximate twofold increase in the disease control group, and OCT and 1,25(OH)2D3 led to a significant decrease in mRNA expression.
Table 3.
mRNA for Type I and Type IV Collagens, TGF-β1 RNA and α-SMA
| Type I collagen | Type IV collagen | TGF-β1 | α-SMA | |
|---|---|---|---|---|
| Normal control rats (n = 5) | 21.11 ± 8.22 | 104.44 ± 15.01 | 121.07 ± 10.86 | 47.92 ± 9.02 |
| Disease control rats (n = 5) | 237.65 ± 60.08* | 194.83 ± 27.96* | 235.64 ± 43.35* | 1163.35 ± 167.96* |
| OCT treated rats (n = 5) | 138.40 ± 27.89* | 96.24 ± 8.89† | 112.27 ± 6.82† | 518.79 ± 85.01*† |
| 1,25(OH)2D3-treated rats (n = 5) | 84.03 ± 24.04† | 99.36 ± 16.58† | 125.54 ± 23.51† | 556.83 ± 141.11† |
All data are expressed normalized with the 18s ribosome.
Mean ± SE.
*P < 0.05 versus normal control rats.
†P < 0.05 versus disease control rats.
Discussion
The findings herein demonstrate that OCT inhibits mesangial cell proliferation and glomerulosclerosis without inducing hypercalcemia in anti-thy-1 glomerulonephritis. Treatment with OCT also inhibited the overexpression of type I and IV collagens and α-SMA in this model. The underlying mechanism of this suppression is related to the action of TGF-β. The compatible mRNA data in the glomeruli were also obtained by a specific real-time PCR technique. In conclusion, these results indicate that OCT has considerable potential for use as a therapeutic strategy in the treatment of progressive glomerular disease.
1,25(OH)2D3 is recognized, not only as an important factor in calcium homeostasis, but also as a potential therapeutic agent for hyperproliferative disorders20-22 and immune dysfunction.23 1,25(OH)2D3 also suppresses the growth of mesangial cells24 and proximal tubular cells in vitro.25 The administration of 1,25(OH)2D3 led to a significant reduction in proteinuria and suppressed the autoantibodies of active Heymann nephritis.26 Recently, 1,25(OH)2D3 has been reported to inhibit glomerular cell proliferation and glomerulosclerosis, and to prevent albuminuria in subtotally nephrectomized rats.5 However 1,25(OH)2D3 produces a significant risk for hypercalcemia and hyperphosphatemia, which are believed to be strong risk factors in the progression of chronic renal failure. In these aspects, it is not practical to treat the patients clinically with 1,25(OH)2D3. On the other hand, OCT, a vitamin D analog, could overcome these problems and has a promising potential for clinical use. It had a strong biological activity, including anti-proliferativeactivity and immunosuppressive activity. Its antiproliferative effect and potent cell differentiation activity are ∼10-fold, and immunosuppressive effect is ∼50-fold that of 1,25(OH)2D3. The mechanism of the difference is partly to because of the following points, including different binding activity of OCT to vitamin D receptor and vitamin D-binding protein (DBP) and different delivery and metabolism of OCT to target organ, compared to 1,25(OH)2D3. However, OCT was only 1/100 as active as 1,25(OH)2D3 in inducing hypercalcemia.27 The precise mechanism of low activity of hypercalcemia is still unknown, however all published data showed rapid metabolic clearance caused by low affinity with binding proteins and low intestinal absorption through calcium-binding proteins.
We reported previously that OCT suppressed the proliferation of mesangial cells in vitro.9 In a thy-1 model, mesangial cells are injured by antibody and activated complement at the initial phase followed by the proliferation of mesangial cells of transformed phenotype. The data herein show that OCT inhibits mesangial cell proliferation and extracellular matrix expansion, and prevents albuminuria. The anti-proliferative effect of OCT might be attributed to regulation of phenotypic change after the initial insult. It is important that preceding mesangial proliferation is a prerequisite for matrix expansion in several experiments, although it is still debatable.2,3 TGF-β is an important pathogenic factor for glomerulosclerosis and overexpression of TGF-β is found in most glomerular sclerotic lesions in vivo that are associated with increased turnover. The possibility cannot be excluded that the inhibition of the mesangial proliferation results in a prevention of matrix expansion, however it is likely that the suppression of TGF-β expression prevents the synthesis of mesangial matrix proteins. The mechanism to suppress TGF-β expression by OCT is still unknown, however, recently a molecular basis for cross-talk between TGF-β and vitamin D signal pathways was reported. The cooperative action of these molecules can be synergistic or antagonistic in a tissue-specific manner.28
The in vivo biological effects of OCT are distinguishable from those of 1,25(OH)2D3. The 1,25(OH)2D3-treated group showed lower body weight than disease control at day 8, however, the former represented the same food intake as the latter group (data not shown). The tendency of lower BUN and phosphate and normal plasma creatinine level in the 1,25(OH)2D3-treated group seems to be explained by the low food absorption especially low protein absorption because the animals developed hypercalcemia. On the other hand, OCT did not induce hypercalcemia in this experiment, therefore, the suppressive effects of BUN and plasma creatinine by OCT may be related to the direct effect of improvement of glomerular injury.
The real-time PCR method used in this study measures PCR product accumulation through a dual-labeled fluorogenic probe. The method is performed in a closed-tube system and requires no manipulation after PCR of the sample. The method analyzes during the log phase of product accumulation, which permits many different genes to be analyzed simultaneously. This supports the use of a housekeeping gene for quantitative reverse transcriptase-PCR controls. Therefore, the real-time RCR provides very accurate and reproducible quantitation of gene copies. The method guarantees the twofold difference of the gene expression in any experiments. The system also allows for a very large dynamic range.19
The biological effect of OCT is different from that of 1,25(OH)2D3 in this study. The differences probably relate to the pharmacokinetic properties of these analogs, which are mainly generated by their affinity for DBP. DBP is a serum protein that functions as a carrier of 1,25(OH)2D3 and its analogs. It has been estimated that the affinity of OCT for DBP is ∼1/600 that of 1,25(OH)2D3. After an in vivo injection, the low affinity of OCT for DBP allows it to circulate primarily as the unbound form and therefore promotes a rapid clearance and facilitates its accessibility to target tissues.29 Therefore, the in vivo effects of OCT on target gene activation are primarily dependent on its pharmacokinetic properties. These pathological effects of OCT in vivo were confirmed by chronic model of progressive glomerulosclerosis in subtotally nephrectomized rats.30 Further study is in progress to clarify the mechanism of gene regulation by OCT in vivo. In conclusion, these results indicate that OCT has powerful therapeutic potential for the treatment of progressive glomerular disease.
Footnotes
Address reprint requests to Toshio Doi, M.D. Deparment of Laboratory Medicine, School of Medicine, The University of Tokushima, 3-18-15 Kuramoto-cho, Tokushima-City, 770-8503, Japan. E-mail: doi@clin.med.tokushima-u.ac.jp.
Supported by grants-in-aid from the “Research for the Future” Program of Japan Society for the Promotion of Science (JSPS-RFTF97L00805).
References
- 1.Klahr S, Schreiner G, Ichikawa I: The progression of renal disease. N Engl J Med 1988, 318:1657-1666 [DOI] [PubMed] [Google Scholar]
- 2.Striker LJ, Doi T, Elliot S, Striker GE: The contribution of glomerular mesangial cells to progressive glomerulosclerosis. Kurtzman NA eds. Seminars in Nephrology, 1989, vol 9.:pp 318-328 PA, W.B. Saunders Company, Philadelphia [PubMed] [Google Scholar]
- 3.Striker LJ, Peten E, Elliot S, Doi T, Striker GE: Heparin and peptide growth regulators. Effect on mesangial cell turn over. Lab Invest 1991, 64:446-456 [PubMed] [Google Scholar]
- 4.Johnson RJ, Floege J, Couser WG, Alpers CE: Role of platelet-derived growth factor in glomerular disease. J Am Soc Nephrol 1993, 4:119-128 [DOI] [PubMed] [Google Scholar]
- 5.Schwarz U, Amann K, Orth SR, Simonaviciene A, Wessels S, Ritz E: Effect of 1,25(OH)2 vitamin D3 on glomerulosclerosis in subtotally nephrectomized rats. Kidney Int 1998, 53:1696-1705 [DOI] [PubMed] [Google Scholar]
- 6.Jones G, Strugnell SA, Deluca HF: Current understanding of the molecular actions of vitamin D. Physiol Rev 1998, 78:1193-1232 [DOI] [PubMed] [Google Scholar]
- 7.Brown AJ: Vitamin D analogues. Am J Kidney Dis 1998, 32:S25-S39 [DOI] [PubMed] [Google Scholar]
- 8.Abe J, Takita Y, Nakano T, Miyaura C, Suda T, Nishii Y: A synthetic analogue of vitamin D3, 22-oxa—1α,25-dihydroxyvitamin D3, is a potent modulator of in vivo immunoregulating activity without inducing hypercalcemia in mice. Endocrinology 1989, 124:2645-2647 [DOI] [PubMed] [Google Scholar]
- 9.Abe H, Iehara N, Utsunomiya K, Kita T, Doi T: A vitamin D analog regulates mesangial cell smooth muscle phenotypes in a transforming growth factor-β type II receptor-mediated manner. J Biol Chem 1999, 274:20874-20878 [DOI] [PubMed] [Google Scholar]
- 10.Sunamoto M, Kuze K, Tsuji H, Ohishi N, Yagi K, Nagata K, Kita T, Doi T: Antisense oligonucleotides against collagen-binding stress protein HSP47 suppress collagen accumulation in experimental glomerulonephritis. Lab Invest 1998, 78:967-972 [PubMed] [Google Scholar]
- 11.Schwab SJ, Christensen RL, Dougherty K, Klahr S: Quantitation of proteinuria by the use of protein-to-creatinine ratios in single urine sample. Arch Intern Med 1987, 147:943-944 [PubMed] [Google Scholar]
- 12.Doi T, Striker LJ, Gibson CC, Agodoa LYC, Brinster RL, Striker GE: Glomerular lesions in mice transgenic for growth hormone and insulin-like growth factor-I. Am J Pathol 1990, 137:541-552 [PMC free article] [PubMed] [Google Scholar]
- 13.Raij L, Azar S, Keane W: Mesangial immune injury, hypertension, and progressive glomerular damage in Dahl rats. Kidney Int 1984, 26:137-143 [DOI] [PubMed] [Google Scholar]
- 14.Dehoff RT, Rhines FN: Method of estimating size of discrete objects. DeHoff RT Rhines FN eds. Quantitative Microscopy. 1968, :pp 75-102 McGraw-Hill, New York [Google Scholar]
- 15.Doi T, Striker LJ, Kimata K, Peten EP, Yamada Y, Striker GE: Glomerulosclerosis in mice transgenic for growth hormone. Increased mesangial extracellular matrix is correlated with kidney mRNA levels. J Exp Med 1991, 173:1287-1290 [DOI] [PMC free article] [PubMed] [Google Scholar]
- 16.Doi T, Hattori M, Agodoa LYC, Sato T, Yoshida H, Striker LJ, Striker GE: Glomerular lesions of the non-obese diabetic (NOD) mouse; before and after the onset of hyperglycemia. Lab Invest 1990, 63:204-212 [PubMed] [Google Scholar]
- 17.Johnson RJ, Garcia RL, Pritzl P, Alpers CE: Platelets mediate glomerular cell proliferation in immune complex nephritis induced by anti-mesangial cell antibodies in the rat. Am J Pathol 1990, 136:369-372 [PMC free article] [PubMed] [Google Scholar]
- 18.Holland PM, Abramson RD, Watson R, Gelfand DH: Detection of specific polymerase chain reaction product by utilizing the 5′ → 3′ exonuclease activity of Thermus aquaticus DNA polymerase. Proc Natl Acad Sci USA 1991, 88:7276-7280 [DOI] [PMC free article] [PubMed] [Google Scholar]
- 19.Heid CA, Stevens J, Livak KJ, Williams PM: Real time quantitative PCR. Genome Res 1996, 6:986-994 [DOI] [PubMed] [Google Scholar]
- 20.Hansen CM, Mäenpää PH: EB1089, a novel vitamin D analog with strong antiproliferative and differentiation-inducing effects on target cells. Biochem Pharmacol 1997, 54:1173-1179 [DOI] [PubMed] [Google Scholar]
- 21.Nagakura K, Abe E, Suda T, Hayakawa M, Nakamura H, Tazaki H: Inhibitory effect of 1α,25-dihydroxyvitaminn D3 on the growth of the renal carcinoma cell line. Kidney Int 1986, 29:834-840 [DOI] [PubMed] [Google Scholar]
- 22.Morimoto S, Imanaka S, Koh E, Shiraishi T, Nabata T, Kitano S, Miyashita Y, Nishii Y, Ogihara T: Comparison of the inhibitions of the inhibitions of proliferation of normal and psoriatic fibroblasts by 1α,25-dihydroxyvitamin D3 and synthetic analogues of vitamin D3 with an oxygen atom in their side chain. Biochem Int 1989, 19:1143-1149 [PubMed] [Google Scholar]
- 23.Lillevang ST, Rosenkvist J, Andersen CB, Larsen S, Kemp E, Kristensen T: Single and combined effects of the vitamin D analogue KH1060 and cyclosporin A on mercuric-chloride-induced autoimmune disease in the BN rat. Clin Exp Immunol 1992, 88:301-306 [DOI] [PMC free article] [PubMed] [Google Scholar]
- 24.Hariharan S, Hong SY, Hsu A, Maccarthy EP, Gartside PS, Ooi BS: Effect of 1,25-dihydroxyvitamin D3 on mesangial cell proliferation. J Lab Clin Med 1991, 117:423-429 [PubMed] [Google Scholar]
- 25.Weinreich T, Müller A, Wüthrich RP, Booy C, Binswanger U: 1,25-Dihyroxyvitamin D3 and the synthetic vitamin D analogue, KH 1060, modulate the growth of mouse proximal tubular cells. Kidney Blood Press Res 1996, 19:325-331 [DOI] [PubMed] [Google Scholar]
- 26.Branisteanu DD, Leenaerts P, Damme BV, Bouillon R: Partial prevention of active Heymann nephritis by 1α,25 dihydroxyvitamin D3. Clin Exp Immunol 1993, 94:412-417 [DOI] [PMC free article] [PubMed] [Google Scholar]
- 27.Furuichi T, Kawata S, Asoh Y, Kumaki K, Ohyama Y: Differential time course of induction of 1α,25-dihydroxyvitamin D3–24-hydroxylase mRNA expression in rats by 1α,25-dihydroxyvitamin D3 and its analogs. Life Sci 1998, 62:453-459 [DOI] [PubMed] [Google Scholar]
- 28.Yanagisawa J, Yanagi Y, Masuhiro Y, Suzawa M, Watanabe M, Kashiwagi K, Toriyabe T, Kawabata M, Miyazono K, Kato S: Convergence of transforming growth factor b and vitamin D signal pathways on SMAD transcriptional coactivators. Science 1999, 283:1317-1321 [DOI] [PubMed] [Google Scholar]
- 29.Brown AJ, Finchi J, Grieff M, Ritter C, Kubodera N, Nishii Y, Slatopolsky E: The mechanism for the disparate actions of calcitriol and 22-oxacalcitriol in the intestine. Endocrinology 1993, 133:1158-1164 [DOI] [PubMed] [Google Scholar]
- 30.Hirata M, Katsumata K, Kusano K, Fukushima N, Makibayashi K, Doi T: 22-oxacalcitriol ameliorates glomerulosclerosis in subtotally nephrectomized rats. J Am Soc Nephrol 1999, 10:660A. [DOI] [PubMed] [Google Scholar]