Abstract
Current clinical judgment in bladder cancer (BC) relies primarily on pathological stage and grade. We investigated whether a molecular classification of tumor cell differentiation, based on a developmental biology approach, can provide additional prognostic information. Exploiting large preexisting gene-expression databases, we developed a biologically supervised computational model to predict markers that correspond with BC differentiation. To provide mechanistic insight, we assessed relative tumorigenicity and differentiation potential via xenotransplantation. We then correlated the prognostic utility of the identified markers to outcomes within gene expression and formalin-fixed paraffin-embedded (FFPE) tissue datasets. Our data indicate that BC can be subclassified into three subtypes, on the basis of their differentiation states: basal, intermediate, and differentiated, where only the most primitive tumor cell subpopulation within each subtype is capable of generating xenograft tumors and recapitulating downstream populations. We found that keratin 14 (KRT14) marks the most primitive differentiation state that precedes KRT5 and KRT20 expression. Furthermore, KRT14 expression is consistently associated with worse prognosis in both univariate and multivariate analyses. We identify here three distinct BC subtypes on the basis of their differentiation states, each harboring a unique tumor-initiating population.
Keywords: Boolean analysis, stem and progenitor cells, biomarker, cancer stem cell, systems biology
Bladder cancer (BC) is the sixth most common malignancy in the United States (1), accounting for ∼69,250 new cases and 14,990 deaths in 2010 (2). The vast majority (90%) of BCs are histologically classified as urothelial carcinomas (UCs) (3). UCs originate from the bladder urothelium, an epithelial tissue with a clear hierarchical organization consisting of three morphologically distinct cell types: basal, intermediate, and umbrella cells (4), representing early, mid, and later differentiation states, respectively. Malignant transformation can occur in any of these cell types thus giving rise to tumors with diverse phenotypes (5).
Currently, the World Health Organization (WHO) BC classification scheme relies primarily on pathologic stage and histological grade for prognostic classification. Identification of new molecular markers would allow for improved risk stratification so that we may better use risk-adapted therapies. Recent molecular profiling of unfractionated BCs has identified unique prognostic gene signatures (6–17). However, these gene signatures have not been clinically used and their biological relevance has remained to be elucidated. Here, we developed a biologically supervised computational approach to mine the extensive repertoire of publicly available gene expression array data to define molecular markers of cellular differentiation consistent across the range of mammalian cellular diversification (18). This algorithm uses Boolean logic to evaluate large datasets to identify genes that sequentially change expression during differentiation (e.g., progenitor genes that decrease during differentiation with the concomitant up-regulation of differentiation genes). In the current study, we have successfully predicted and functionally validated molecular markers for multiple differentiation steps in BC and analyzed their association with patient survival.
Results
In the presented study we focus on UCs, hereafter synonymously called BC, and excluded other BC subtypes (squamous and adenocarcinomas) from gene-expression, phenotypical, functional, and patient survival analyses.
Overall Strategy to Predict, Functionally Validate, and Associate Differentiation States to Survival in BC.
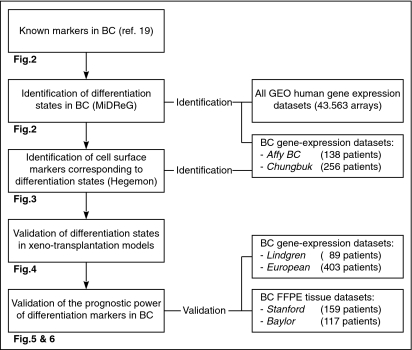
A biologically supervised approach was used to predict markers of differentiation states in BC (Fig. 1). The expression patterns of our two previously published hierarchically related differentiation markers in BC, keratin (KRT) 5 and KRT20 (19), were analyzed by the algorithm “mining developmentally regulated genes” (MiDReG), which revealed a third differentiation marker, KRT14. We therefore hypothesized the existence of three distinct differentiation states marked by KRT14, -5, and -20, which are shared by both normal urothelium and BC. We then used the algorithm “hierarchical exploration of gene-expression microarrays online” (Hegemon) to identify cell surface markers corresponding to each differentiation state. FACS separation with these surface marker combinations allowed for the isolation of the respective tumor-initiating cell (T-IC) populations from clinical samples and analysis of their respective tumorigenic and differentiation potential in xenotransplantation models. We then analyzed the prognostic utility of these differentiation markers using patient gene-expression arrays (492 patients) and formalin-fixed paraffin-embedded (FFPE) (275 patients) tissue sets.
Fig. 1.
Flowchart of identification and validation of differentiation states in BC. Markers of differentiation (keratins) are identified by using “mining developmentally regulated genes” (MiDReG) and corresponding cell surface markers are identified by using “hierarchical exploration of gene-expression microarray online” (Hegemon). The hypothetical hierarchy of differentiation is evaluated in patient tumor cell xenotransplantation mouse models. Association of differentiation states in bladder cancer with patient outcome is validated with existing databases and archival tissues.
Keratin 14 Is Predicted to Precede Keratin 5 and -20 in Urothelial Differentiation.
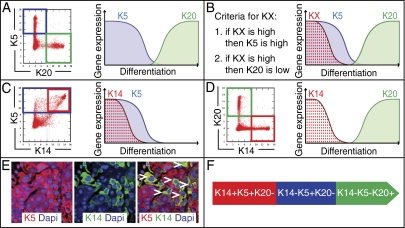
KRTs are differentially expressed during epithelial tissue differentiation, a phenotype that is often conserved in neoplastic transformation (20, 21). During normal urothelial differentiation, it is proposed that basal and intermediate cells express KRT5, but not KRT20. Conversely, terminal differentiation involves the loss of KRT5 and gain of KRT20 expression (22, 23) (Fig. 2A). Immunofluorescence analysis confirmed our previous finding that coexpression of CD44 and KRT5 define basal/progenitor cells in BC, whereas terminally differentiated tumor cells express KRT20 but not CD44 and KRT5 (19) (Fig. S1A).
Fig. 2.
Keratin 14, -5, and -20 define three differentiation states in BC. Keratins are abbreviated as KX. (A) K5 is expressed early during differentiation (blue) and its expression is temporally exclusive with that of the terminal differentiation marker K20 (green) in bladder cancer (BC). The mutual relationship of K5 and K20 in their temporal expression is consistent across diverse tissues (totaling 75,000 data points) in multiple species (human, mouse, and rat; Fig. S1 B–E). (B) Schematic illustrating the principle behind the computational strategy MiDReG used to predict a keratin X (KX, red), which is precursor to K5 and K20 by fulfilling two Boolean relationships: (i) when KX expression is high (red), expression of the early progenitor marker K5 is also high (blue) and (ii) when KX expression is high (red), expression of the differentiation marker K20 is low (green). (C) K14 fulfills the first Boolean relationship, its expression is high (red) when the expression of early progenitor marker K5 is also high (blue). (D) K14 fulfills the second Boolean relationship, its expression is low (red) when the expression of terminal differentiation marker K20 is high (green). (E) KRT14-expressing cells (Alexa 488/green) mark a subpopulation of KRT5+ cells (Alexa 594/red) in BC; white arrows indicate double positive cells, yellow. (F) Schematic illustration of the three predicted differentiation states in urothelial biology.
We developed a biologically supervised computational approach, which mines the repertoire of publicly available microarray data to identify genes that are down-regulated during cellular differentiation (18). Starting with the knowledge that KRT5 and KRT20 expression is limited to progenitor and downstream populations, respectively (Fig. 2A), we applied MiDReG to predict upstream keratins (KX) that satisfy two Boolean relationships (i) when KX expression is high, expression of progenitor KRT5 is high (Fig. 2B, red/blue), and (ii) when KX expression is high, expression of terminal differentiation marker KRT20 is low (Fig. 2B, red/green) (details described in SI Methods) (18, 24, 25). Using AffyBC and Chungbuk datasets, we identified four keratins (KRT14, KRT16, KRT6A, and KRT6B; Fig. S1F, details in SI Methods) that fulfilled these criteria (Fig. 2 C and D). Analysis of the Chungbuk dataset revealed two keratins significantly associated with outcome: KRT14 (hazard ratio (HR) 2.75, P < 0.05), and KRT6B (HR 3.48, P < 0.05) (Fig. S1F). We further focused on KRT14, as this marker was more highly and consistently expressed within the AffyBC and Chungbuk datasets. Immunofluoresence analysis confirmed KRT14 expression (Fig. 2E, green cells) marks a subpopulation of KRT5+ cells in BC (Fig. 2E, red cells) (double positive cells, yellow, are indicated by white arrows). Analogous to BC, KRT14 staining on normal bladder tissue shows a basal-cell–restricted expression pattern (Fig. S2 D and E). On the basis of the MiDReG analysis (Fig. S2 A–C). we predicted the existence of three differentiation states in urothelial cells: basal (KRT14+KRT5+KRT20−), intermediate (KRT14−KRT5+KRT20−), and differentiated (KRT14−KRT5−KRT20+) (Fig. 2F).
Identification of Corresponding Surface Markers to the Predicted Keratin Differentiation States in BC.
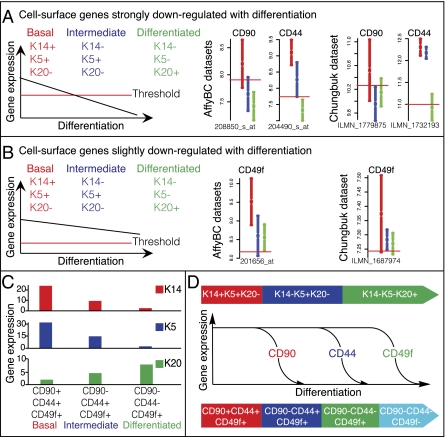
We identified surface markers specific for each of the three BC differentiation states to allow for prospective isolation by FACS and in vivo functional validation via a xenotransplantation model. To perform this analysis, we developed a software program named Hegemon (SI Methods) to identify surface markers highly expressed in the basal cells (KRT14+) and progressively down-regulated in intermediate (KRT5+) and differentiated cells (KRT20+) (Fig. 3A and Fig. S3F). Using Hegemon, we ranked each marker on the basis of association with patient survival (via hazard ratios) (Dataset S1) and identified CD248, S100A8, COL1A1, and CD90 (THY1) as the top candidate markers (Fig. 3A and Fig. S3F and Dataset S1). We focused on CD90, because a flow-cytometry–compatible antibody was commercially available. As expected, our previously identified marker, CD44, was also demonstrated to exhibit a predominant basal (KRT14+) distribution (Fig. 3A and Fig. S3F and Dataset S1). We next used Hegemon to identify those surface markers that are expressed in all cells but down-regulated in the transition from basal to differentiated cells (Fig. 3B and Fig. S3G and Dataset S1). From this group, we focused on CD49f (ITGA6), as this marker has been reported to be coexpressed with KRT14 and is down-regulated during differentiation in various normal epithelial tissues and cancer types (26, 27).
Fig. 3.
Discovery of corresponding surface markers to keratins for differentiation states in BC. Keratins are abbreviated as KX. Schematics demonstrating the two criteria used to set the threshold for discovering surface markers that would correspond with the following differentiation states (K14+K5+K20− red; K14−K5+K20− blue; K14−K5−K20+ green). The discovery analysis was performed in the AffyBC and the Chungbuk datasets (red horizontal line indicates the StepMiner-based threshold). Boxplots with mean and confidence interval for cell surface genes that fulfill the two separate criteria were shown independently. (A) The threshold was set in a way that would discover surface markers that were highly expressed in basal cells (K14+K5+K20−, red) and strongly down-regulated during differentiation. (B) The threshold was set in a way that would discover surface markers that highly expressed all three differentiation states (red, blue, and green), and slightly down-regulated during differentiation. The detailed method of discovery and ranking of cell surface markers is presented in Fig. S3 and listed in Dataset S1. (C) Messenger RNA expression of K14, K5, and K20 in each of the differentiation states defined by corresponding surface markers was analyzed by real-time PCR. Corresponding surface marker combination that defines each differentiation state was listed in the x axis, representing basal, intermediate, and differentiated states, respectively. The relative gene-expression level was indicated in the y axis. (D) Schematic illustrating BC differentiation states as defined by keratin (K) and corresponding surface marker expression profiles.
Next, we used flow cytometry to examine whether a combination of these newly identified markers, CD90 and CD49f, and the previously identified marker CD44 could subdivide BC into distinct differentiation states. Analysis of primary tumors revealed four predicted BC populations: CD90+CD44+CD49f+ (primitive/basal) → CD90−CD44+CD49f+ → CD90−CD44−CD49f+ → CD90−CD44−CD49f− (terminal differentiated) (Fig. 3D). Gene expression of KRT14, -5, and -20 in each of these purified subpopulation was analyzed by q-PCR (Fig. 3C). As expected, primitive/basal CD90+CD44+CD49f+ BC cells expressed high levels of KRT14 and -5 (Fig. 3C, red and blue) and low levels of KRT20 (Fig. 3C, green). KRT14 and -5 expression were decreased in the CD90−CD44+CD49f+ intermediate population and had the lowest expression in CD90−CD44−CD49f+ differentiated population (Fig. 3C). KRT20 expression was highest in the CD90−CD44−CD49f+ differentiated population (Fig. 3C).
Functional Validation of Three BC Subtypes.
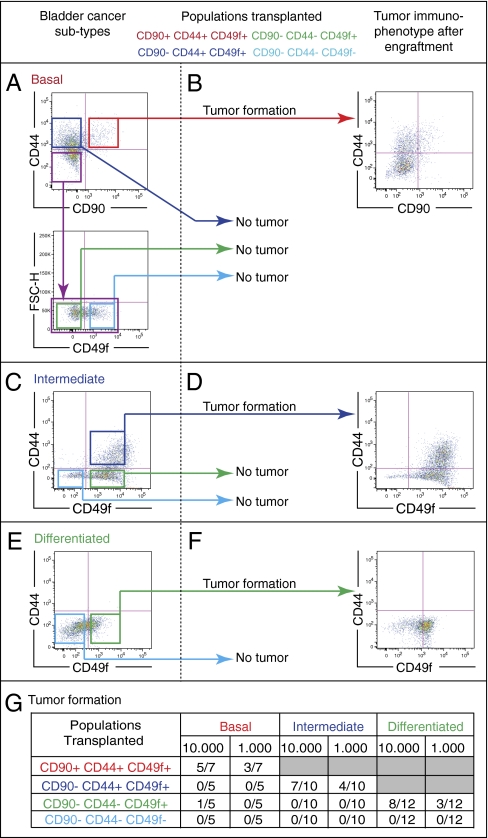
To functionally validate these predicted BC differentiation states, we used our unique surface marker profiles to isolate populations corresponding to each differentiation state from patient BCs using FACS (Fig. 4A). These isolated populations were then transplanted in vivo into immunodeficient SCID mice. As noted above, only the most upstream population harbored T-IC potential in all BCs tested. For example, in a representative BC that contained all four differentiation states (Fig. 4A), only the most primitive tumor cells (CD90+CD44+CD49f+) exhibited tumorigenicity in vivo (Fig. 4G, basal), regenerating all downstream populations (Fig. 4A) and effectively reconstituting all cellular compartments from the original BC. Interestingly, within this same tumor, transplantation of a more downstream population (CD90−CD44+CD49f+) failed to reestablish the tumor (Fig. 4A).
Fig. 4.
Functional validation of the computationally predicted differentiation states in BC. In vivo validation of three phenotypically distinct subtypes of bladder cancer (BC) according to their differentiation states: (A) basal, (C) intermediate, and (E) differentiated as defined by surface marker profiles (CD90, CD44, and CD49f). BC cells were purified by FACS and xenotransplanted intradermally into immunodeficient mice in limited dilution (103 and 104). (B, D, and F) The immunophenotypes of xenograft tumors derived from each BC subtype were reanalyzed by FACS postengraftment. (A) The basal BC subtype is composed of all differentiation states [CD90+CD44+CD49f+ (red box) → CD90−CD44+CD49f+ (blue box) → CD90−CD44−CD49f+ (green box) → CD90−CD44−CD49f− (light blue box)]. (B) Only the most upstream (CD90+CD44+CD49f+) population forms xenograft tumors and recapitulates all downstream differentiation states (CD90−CD44+CD49f+ → CD90−CD44−CD49f+ → CD90−CD44−CD49f−). (C) The intermediate BC subtype lacks the basal differentiation state (CD90+CD44+CD49f+). (D) Only the most upstream differentiation state (CD90−CD44+CD49f+) forms xenograft tumors and can reconstitute all downstream states (CD90−CD44−CD49f+ → CD90−CD44−CD49f−). (E) In differentiated BCs that lack both the basal (CD90+CD44+CD49f+) and the intermediate (CD90−CD44+CD49f+) differentiation states, (F) only the existing differentiation state (CD90−CD44−CD49f+) forms xenograft tumors and recapitulates the terminally differentiated (CD90−CD44−CD49f−) downstream state. (A, C, and E) The terminally differentiated subpopulations (CD90−CD44−CD49f−) never give rise to tumors. (G) Frequency of tumor formation of all transplanted cell populations described in A, C, and E.
Examination of a panel of patient BC specimens revealed significant heterogeneity among tumors, some missing one or more differentiation states (Fig. 4 C and E). On the basis of our analyses, BCs could be generalized into at least three subtypes: the basal subtype, which contains all four predicted differentiation states (CD90+CD44+CD49f+, CD90−CD44+CD49f+, CD90−CD44−CD49f+, and CD90−CD44−CD49f−) (Fig. 4A); the intermediate subtype, which lacks the basal state (no CD90+CD44+CD49f+ population) (Fig. 4C); and the differentiated subtype, which lacks both the basal and intermediate (no CD90+CD44+CD49f+ or CD90−CD44+CD49f+ populations) states (Fig. 4E). FACS isolation and subsequent xenotransplantation of sorted cells from each differentiation state from specimens representing each BC subtype revealed that only the most primitive upstream populations formed tumors (Fig. 4G) (e.g., in basal BC subtype, CD90+CD44+CD49f+ cells; in intermediate BC subtype, CD90−CD44+CD49f+ cells; and in differentiated BC subtype, CD90−CD44−CD49f+ cells). Furthermore, the T-IC population from each BC subtype reformed only those downstream and not any upstream populations (Fig. 4 B, D, and F). These results revealed three phenotypically distinct BC subtypes, each containing a distinct T-IC population that invariably represented the most primitive differentiation state from that tumor (Fig. 4G).
Basal Subtype Is Significantly Associated with Poor Overall Survival.
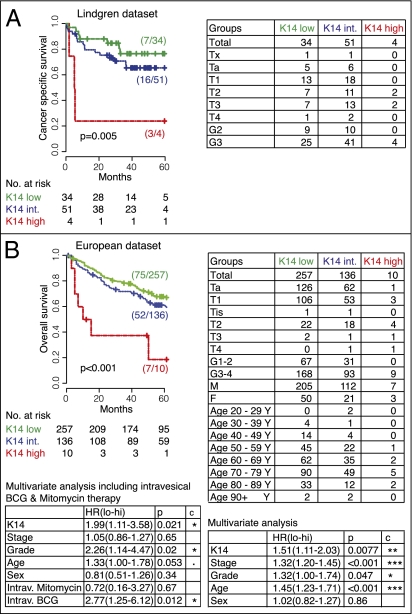
To evaluate the clinical significance of these three unique BC subtypes, we analyzed their prognostic utility in two independent BC gene-expression datasets with a total of 492 patients [Lindgren n = 89 (9) and European n = 403 (6), Fig. 5]. Because the Chungbuk dataset is used as a training dataset to identify our markers, it was excluded from further validation analysis. These datasets represent all publicly available BC datasets. Survival data for two additional BC datasets were not available for analysis (10, 11). The basal BC differentiation subtype, defined by keratin (K14+K5+K20−) or surface (CD90+CD44+CD49f+) marker combinations were associated with worse overall survival compared with both intermediate (K14−K5+K20−/CD90−CD44+CD49f+) and differentiated (K14−K5−K20+/CD90−CD44−CD49f+) subtypes (Fig. S4 A and B). This result was additionally validated in two independent FFPE patient tissue registries with a total of 275 patients (Stanford, n = 158; Baylor, n = 117) on the basis of immunohistochemical analysis of KRT14, KRT5, and KRT20 expression (Fig. S5).
Fig. 5.
Keratin 14 gene expression is associated with worse patient survival in BC. Kaplan–Meier analysis of the probability of cancer-specific (A) and overall (B) survival according to differentiation states in bladder cancer as defined by Keratin 14 (K14) gene-expression level in two independent datasets, Lindgren (A) and European (B).
It is worth noting that a subset of patient samples in our analysis did not fit easily into one of our three BC subtypes (others, gray; Fig. S4). This additional heterogeneity may represent a block in differentiation, which may occur at any stage of differentiation. We believe that such heterogeneity complements the proposed BC differentiation states and reveals additional heterogeneity within BC subtypes that should be investigated in future analyses (Fig. S4D).
Basal/Primitive Cell Marker Keratin 14 Is Significantly Associated with Poor Overall Survival in BC.
Because of the significantly worse overall survival associated with the basal BC subtype, and the clinical applicability of a single immunohistochemistry (IHC) marker, we evaluated the clinical significance of KRT14 as a single basal differentiation marker.
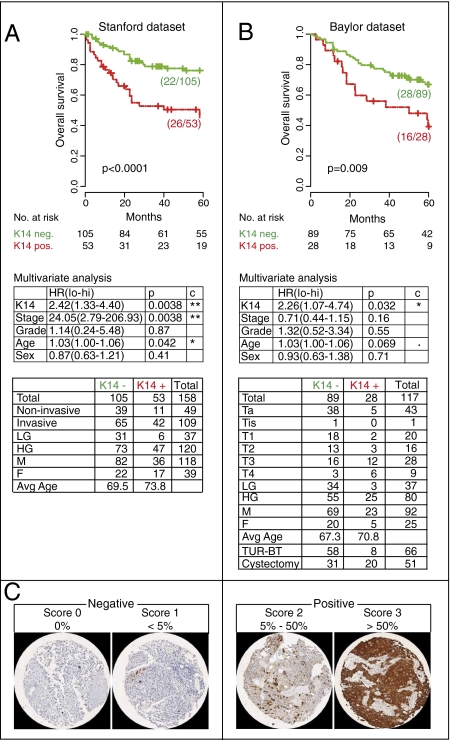
Our analysis revealed that KRT14 gene expression was associated with significantly worse overall survival in two independent datasets (Lindgren, P = 0.005; European, P < 0.001) (Fig. 5 A and B). In the European dataset, the prognostic power of KRT14 was statistically significant in both univariate and multivariate analysis when accounting for stage, grade, age, and sex (multivariate P = 0.0077, respectively P = 0.021, including tumors treated with intravesical bacillus Calmette–Guérin/chemotherapy) (Fig. 5B). This prognostic power remained significant when KRT14 gene expression was analyzed as a continuous variable in both uni- and multivariate analysis in the European dataset (Table S1; multivariate P = 0.013, respectively P = 0.02, including bacillus Calmette–Guérin/chemotherapy). Validation by measuring KRT14 protein expression within two independent FFPE BC tissue cohorts revealed a significant association between KRT14 and overall survival (Stanford P < 0.0001, multivariate P = 0.0038; Baylor P = 0.009, multivariate P = 0.032; Fig. 6 A and B). It is important to note that different datasets use different grading systems. Whereas the gene expression datasets are based on the 3-grade (Lindgren) or 4-grade (European) system, the FFPE BC cohorts (Stanford and Baylor) are annotated with the more recently adopted 2-grade (low and high) system. Nevertheless, the prognostic power of KRT14 holds regardless of different grading systems. Of note, although the prognostic utility of KRT14 is not confounded by pathological grade, high grade tumors are significantly enriched for KRT14 expression and vice versa (IHC datasets, Pearson's χ2 test: Stanford, P = 0.01; Baylor, P = 0.006). Finally, subgroup analysis of clinically important BC groups, including muscle invasive disease (≥pT2), low stage disease (pTa), and patients treated with radical cystectomy, could be consistently stratified by KRT14 expression in all datasets tested (Figs. S6 and S7).
Fig. 6.
Keratin 14 protein expression is associated with worse patient survival in BC. (A and B) Kaplan–Meier analysis of the probability of overall survival according to differentiation states in bladder cancer as defined by keratin 14 (K14) in two independent tissue datasets, Stanford (A) and Baylor (B). (C) Representative micrographs of K14 IHC staining, scoring (0–3), and stratification (negative, 0–1; positive, 2–3) are presented.
Discussion
Identification and characterization of differentiation steps are critical to our understanding of both normal tissue development and malignant transformation. During normal urothelial differentiation, it is generally accepted that basal, intermediate, and umbrella cells represent sequential differentiation, from primitive to mature. It is likely that malignant transformation can occur in any of these cell types to form tumors with distinct T-IC populations (5). Our results indicate a multistep differentiation hierarchy in BCs that parallels normal urothelial differentiation. The resulting unique classification scheme broadly divides BC into three differentiation subtypes—basal, intermediate, and differentiated. We further demonstrated that each BC subtype possesses its own phenotypically distinct T-IC population within its most primitive compartment. Such a T-IC population exists at the top of a hierarchical relationship and is capable of reconstituting all downstream populations. These results add complexity to our originally proposed T-IC model (19) and suggest BC conforms to the cancer stem cell model (19, 28–33).
A subset of patient samples in our analysis does not fit into the three BC subtypes, which may reflect additional diversity. However, we did not find evidence of cellular plasticity as recently described by Chaffer et al. (34). In our functional in vivo studies, BC cells give rise to downstream differentiation states but are incapable of reforming upstream populations. More stringent biological assays such as lineage tracing in mice can be explored in future to provide definitive evidence supporting our hierarchy model.
Stratification of patients by BC subtypes, using keratin and cell surface markers, showed significant prognostic utility. Moreover, KRT14 expression is strongly associated with poor survival, independent of established clinical and pathological variables including stage, grade, age, and sex. For example, KRT14 identifies patients with worse outcome in both nonmuscle invasive (pTa) and muscle invasive (pT2 and ≥pT2) tumors. Within the muscle invasive cohort, identification of high-risk patients may allow for effective early utilization of aggressive therapies like neoadjuvant chemotherapy and provide another means to stratify patients in clinical trials. These considerations provide strong rationale for prospective studies evaluating KRT14 expression as a risk-stratifying marker.
The prognostic utility of KRT14 held when tumors were analyzed by both gene expression and IHC, the latter being a technique easily added to the repertoire of clinical laboratories. However, our IHC analysis identified relatively more KRT14 positive patients than gene-expression analysis. There are two possible explanations: differences in patient cohorts and assay sensitivity. The IHC data were obtained from patients treated at Stanford University and Baylor College of Medicine, which are tertiary referral centers that commonly treat advanced-stage BCs (59% with invasive disease), whereas gene-expression data were obtained from patients treated at multiple different European centers (ranging from primary to tertiary centers) and therefore had overall less advanced BCs (19% with invasive disease). Additionally, gene-expression analysis averages mRNA expression throughout an entire sample, whereas IHC provides resolution up to a single cell. Therefore, the same patient who may appear KRT14 negative in a gene-expression analysis may be identified through IHC as KRT14 positive. However, the fact that both gene-expression and IHC analyses indicated KRT14 as an independent prognostic marker speaks to the robustness of this early progenitor cell marker in BC prognosis.
In addition to the differences between gene expression and IHC analysis, the nature of a retrospective study has its own limitations. For example, important clinical parameters such as lymph node status, detailed cytopathological features, and full treatment history are not always available. Additionally, the distribution of clinicopathological features in the study cohorts may not reflect the natural patient distribution. For example, carcinoma in situ cases are relatively underrepresented in all of the datasets used in this study. To overcome these limitations, the clinical utility of KRT14 needs to be validated in future prospective trials.
In summary, we have developed a unique computational strategy to identify prognostic markers linked to cellular differentiation. We subsequently validated a set of distinct differentiation markers in BC through in vivo assays and clinical outcomes analyses. It is likely that this method can be readily generalizable to other cancers. Our results hold immediate implications to understanding BC biology and further development of unique targeted therapies. Finally, our analysis revealed a clinically applicable marker, KRT14, which we believe is an ideal candidate for a large prospective trial to assess risk-adapted therapies.
Methods
Data Collection, Processing, and Statistical Analysis.
See SI Methods for further details.
Identification of Differentiation States Using MiDReG and Identification of Corresponding Surface Markers using Hegemon.
See Figs. S1 and S3, Table S1, and SI Methods for further details.
Immunofluorescence Staining and Immunohistochemistry.
See SI Methods for further details.
Bladder Tumor Tissue Dissociation, Flow Cytometry Analysis and Cell Sorting, and Xenografting.
Dissociation, FACS analysis, sorting, and xenografting were preformed as previously described (19). See SI Methods for further details.
Patient Classification for Outcome Analysis According to Bladder Cancer Differentiation Status.
See SI Methods for further details.
Supplementary Material
Acknowledgments
We thank J. Lipsick, F. Scheeren, P. Dalerba, S. Mitra, M. Diehn, S. Hilsenbeck, K. C. Osborne, D. Rowley, J. Rosen, J. D. Brooks, and R. Levy for critical discussion, helpful suggestions, and technical advice; J. Liao, H. Gill, J. Presti, M. Gonzalgo, J. Bruno, and J. Santos for consenting patients and providing bladder cancer specimens for the current study; L. Jerabek and A. Mosley for laboratory and mouse management; and K. Montgomery, S. Varma, W. Jian, and R.Ashfaq for tissue sectioning, staining, and scanning. J-P.V. is supported by Deutsche Forschungsgemeinschaft Grant VO 1704/1−1 and grants from the Urologisch Wissenschaftliche Gesellschaft. D.S. is supported by National Institutes of Health (NIH) Grant K99CA151673-01A1, Department of Defense Grant W81XWH-10-1-0500, and a grant from the Siebel Stem Cell Institute and the Thomas and Stacey Siebel Foundation. R.K.C. is supported by Radiological Society of North America Grants RR0832 and RR0907. C.T. is supported by the Howard Hughes Medical Institute Medical Fellow Program and the Stanford Medical Scholar Program. S.B.W. is supported by a grant from the Lacob Program of Excellence in Gynecologic-Ovarian Cancer Research and Treatment. H.C.-T. is supported by California Institute of Regerenative Medicine Grant TB1-01190. I.L.W. is supported by a Ludwig Institute Grant, the Jim and Carolyn Pride Family Fund, the Smith Family Foundation, and NIH Grant P01CA139490. K.S.C. is supported by the National Cancer Institute Grant R00CA129640-04 and the V Foundation for Cancer Research V Scholar Award.
Footnotes
Conflict of interest statement: I.L.W. owns Amgen stock and is a director of Stem Cells, Inc. To the authors’ knowledge neither entity has a direct interest in the research reported here.
This article contains supporting information online at www.pnas.org/lookup/suppl/doi:10.1073/pnas.1120605109/-/DCSupplemental.
References
- 1.US Cancer Statistics Working Group United States Cancer Statistics: 1999–2007 Incidence and Mortality Web-Based Report (US Department of Health and Human Services, Centers for Disease Control and Prevention, and National Cancer Institute, Atlanta) 2010. Available at http://apps.nccd.cdc.gov/uscs/toptencancers.aspx. Accessed November 9, 2010.
- 2.Jemal A, Siegel R, Xu J, Ward E. Cancer statistics, 2010. CA Cancer J Clin. 2010;60:277–300. doi: 10.3322/caac.20073. [DOI] [PubMed] [Google Scholar]
- 3.Wu XR. Urothelial tumorigenesis: A tale of divergent pathways. Nat Rev Cancer. 2005;5:713–725. doi: 10.1038/nrc1697. [DOI] [PubMed] [Google Scholar]
- 4.Lewis SA. Everything you wanted to know about the bladder epithelium but were afraid to ask. Am J Physiol Renal Physiol. 2000;278:F867–F874. doi: 10.1152/ajprenal.2000.278.6.F867. [DOI] [PubMed] [Google Scholar]
- 5.Weissman I. Stem cell research: Paths to cancer therapies and regenerative medicine. JAMA. 2005;294:1359–1366. doi: 10.1001/jama.294.11.1359. [DOI] [PubMed] [Google Scholar]
- 6.Dyrskjøt L, et al. Gene expression signatures predict outcome in non-muscle-invasive bladder carcinoma: A multicenter validation study. Clin Cancer Res. 2007;13:3545–3551. doi: 10.1158/1078-0432.CCR-06-2940. [DOI] [PubMed] [Google Scholar]
- 7.Kim WJ, et al. Predictive value of progression-related gene classifier in primary non-muscle invasive bladder cancer. Mol Cancer. 2010;9:3. doi: 10.1186/1476-4598-9-3. [DOI] [PMC free article] [PubMed] [Google Scholar]
- 8.Kim WJ, et al. A four-gene signature predicts disease progression in muscle invasive bladder cancer. Mol Med. 2011;17:478–485. doi: 10.2119/molmed.2010.00274. [DOI] [PMC free article] [PubMed] [Google Scholar]
- 9.Lindgren D, et al. Combined gene expression and genomic profiling define two intrinsic molecular subtypes of urothelial carcinoma and gene signatures for molecular grading and outcome. Cancer Res. 2010;70:3463–3472. doi: 10.1158/0008-5472.CAN-09-4213. [DOI] [PubMed] [Google Scholar]
- 10.Sanchez-Carbayo M, Socci ND, Lozano J, Saint F, Cordon-Cardo C. Defining molecular profiles of poor outcome in patients with invasive bladder cancer using oligonucleotide microarrays. J Clin Oncol. 2006;24:778–789. doi: 10.1200/JCO.2005.03.2375. [DOI] [PubMed] [Google Scholar]
- 11.Mitra AP, et al. Generation of a concise gene panel for outcome prediction in urinary bladder cancer. J Clin Oncol. 2009;27:3929–3937. doi: 10.1200/JCO.2008.18.5744. [DOI] [PMC free article] [PubMed] [Google Scholar]
- 12.Smith SC, et al. A 20-gene model for molecular nodal staging of bladder cancer: Development and prospective assessment. Lancet Oncol. 2011;12:137–143. doi: 10.1016/S1470-2045(10)70296-5. [DOI] [PMC free article] [PubMed] [Google Scholar]
- 13.Monzon FA, et al. Multicenter validation of a 1,550-gene expression profile for identification of tumor tissue of origin. J Clin Oncol. 2009;27:2503–2508. doi: 10.1200/JCO.2008.17.9762. [DOI] [PubMed] [Google Scholar]
- 14.Stransky N, et al. Regional copy number-independent deregulation of transcription in cancer. Nat Genet. 2006;38:1386–1396. doi: 10.1038/ng1923. [DOI] [PubMed] [Google Scholar]
- 15.Wild PJ, et al. Gene expression profiling of progressive papillary noninvasive carcinomas of the urinary bladder. Clin Cancer Res. 2005;11:4415–4429. doi: 10.1158/1078-0432.CCR-05-0259. [DOI] [PubMed] [Google Scholar]
- 16.Modlich O, Prisack HB, Munnes M, Audretsch W, Bojar H. Immediate gene expression changes after the first course of neoadjuvant chemotherapy in patients with primary breast cancer disease. Clin Cancer Res. 2004;10:6418–6431. doi: 10.1158/1078-0432.CCR-04-1031. [DOI] [PubMed] [Google Scholar]
- 17.Karni-Schmidt O, et al. Distinct expression profiles of p63 variants during urothelial development and bladder cancer progression. Am J Pathol. 2011;178:1350–1360. doi: 10.1016/j.ajpath.2010.11.061. [DOI] [PMC free article] [PubMed] [Google Scholar]
- 18.Sahoo D, et al. MiDReG: A method of mining developmentally regulated genes using Boolean implications. Proc Natl Acad Sci USA. 2010;107:5732–5737. doi: 10.1073/pnas.0913635107. [DOI] [PMC free article] [PubMed] [Google Scholar]
- 19.Chan KS, et al. Identification, molecular characterization, clinical prognosis, and therapeutic targeting of human bladder tumor-initiating cells. Proc Natl Acad Sci USA. 2009;106:14016–14021. doi: 10.1073/pnas.0906549106. [DOI] [PMC free article] [PubMed] [Google Scholar]
- 20.Fuchs E. Epidermal differentiation and keratin gene expression. J Cell Sci Suppl. 1993;17:197–208. doi: 10.1242/jcs.1993.supplement_17.28. [DOI] [PubMed] [Google Scholar]
- 21.Chu PG, Weiss LM. Keratin expression in human tissues and neoplasms. Histopathology. 2002;40:403–439. doi: 10.1046/j.1365-2559.2002.01387.x. [DOI] [PubMed] [Google Scholar]
- 22.Johansson SL, Cohen SM. Epidemiology and etiology of bladder cancer. Semin Surg Oncol. 1997;13:291–298. doi: 10.1002/(sici)1098-2388(199709/10)13:5<291::aid-ssu2>3.0.co;2-8. [DOI] [PubMed] [Google Scholar]
- 23.De La Rosette J, Smedts F, Schoots C, Hoek H, Laguna P. Changing patterns of keratin expression could be associated with functional maturation of the developing human bladder. J Urol. 2002;168:709–717. doi: 10.1097/00005392-200208000-00085. [DOI] [PubMed] [Google Scholar]
- 24.Sahoo D, Dill DL, Gentles AJ, Tibshirani R, Plevritis SK. Boolean implication networks derived from large scale, whole genome microarray datasets. Genome Biol. 2008;9:R157. doi: 10.1186/gb-2008-9-10-r157. [DOI] [PMC free article] [PubMed] [Google Scholar]
- 25.Inlay MA, et al. Ly6d marks the earliest stage of B-cell specification and identifies the branchpoint between B-cell and T-cell development. Genes Dev. 2009;23:2376–2381. doi: 10.1101/gad.1836009. [DOI] [PMC free article] [PubMed] [Google Scholar]
- 26.Stingl J, et al. Purification and unique properties of mammary epithelial stem cells. Nature. 2006;439:993–997. doi: 10.1038/nature04496. [DOI] [PubMed] [Google Scholar]
- 27.Lim E, et al. Aberrant luminal progenitors as the candidate target population for basal tumor development in BRCA1 mutation carriers. Nat Med. 2009;15:907–913. doi: 10.1038/nm.2000. [DOI] [PubMed] [Google Scholar]
- 28.He X, et al. Differentiation of a highly tumorigenic basal cell compartment in urothelial carcinoma. Stem Cells. 2009;27:1487–1495. doi: 10.1002/stem.92. [DOI] [PMC free article] [PubMed] [Google Scholar]
- 29.Yang YM, Chang JW. Bladder cancer initiating cells (BCICs) are among EMA-CD44v6+ subset: Novel methods for isolating undetermined cancer stem (initiating) cells. Cancer Invest. 2008;26:725–733. doi: 10.1080/07357900801941845. [DOI] [PubMed] [Google Scholar]
- 30.She JJ, Zhang PG, Wang ZM, Gan WM, Che XM. Identification of side population cells from bladder cancer cells by DyeCycle Violet staining. Cancer Biol Ther. 2008;7:1663–1668. doi: 10.4161/cbt.7.10.6637. [DOI] [PubMed] [Google Scholar]
- 31.Su Y, et al. Aldehyde dehydrogenase 1 A1-positive cell population is enriched in tumor-initiating cells and associated with progression of bladder cancer. Cancer Epidemiol Biomarkers Prev. 2010;19:327–337. doi: 10.1158/1055-9965.EPI-09-0865. [DOI] [PMC free article] [PubMed] [Google Scholar]
- 32.Chan KS, Volkmer JP, Weissman I. Cancer stem cells in bladder cancer: A revisited and evolving concept. Curr Opin Urol. 2010;20:393–397. doi: 10.1097/MOU.0b013e32833cc9df. [DOI] [PMC free article] [PubMed] [Google Scholar]
- 33.Reya T, Morrison SJ, Clarke MF, Weissman IL. Stem cells, cancer, and cancer stem cells. Nature. 2001;414:105–111. doi: 10.1038/35102167. [DOI] [PubMed] [Google Scholar]
- 34.Chaffer CL, et al. Normal and neoplastic nonstem cells can spontaneously convert to a stem-like state. Proc Natl Acad Sci USA. 2011;108:7950–7955. doi: 10.1073/pnas.1102454108. [DOI] [PMC free article] [PubMed] [Google Scholar]
Associated Data
This section collects any data citations, data availability statements, or supplementary materials included in this article.


