Abstract
We have developed an integrated spectroscopy system combining total internal reflection fluorescence microscopy imaging with confocal single-molecule fluorescence spectroscopy for two-dimensional interfaces. This spectroscopy approach is capable of both multiple molecules simultaneously sampling and in situ confocal fluorescence dynamics analyses of individual molecules of interest. We have demonstrated the calibration with fluorescent microspheres, and carried out single-molecule spectroscopy measurements. This integrated single-molecule spectroscopy is powerful in studies of single molecule dynamics at interfaces of biological and chemical systems.
INTRODUCTION
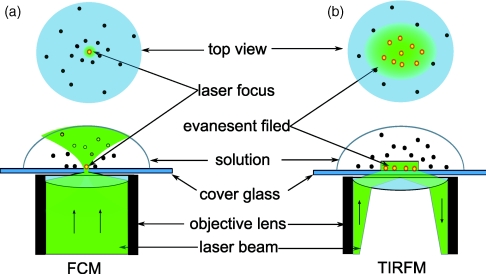
Fluorescence confocal microscopy (FCM) has been widely applied in the single-molecule imaging1, 2, 3, 4, 5, 6 with diffraction limited spatial resolution near half of the excitation light wavelength ∼250–300 nm, as illustrated in Figure 1a. Its capability of decreasing detection volume has shown a significant advantage in extraction of weak signals from background, through confining the excitation and detection in the conjugated diffraction limited focal volumes.1, 2, 3, 7, 8 Combined with fast-gated single photon counting techniques and ultrafast pulse laser excitation, confocal configuration is well used for single-molecule time-resolved fluorescence measurements and fluorescence correlation spectroscopy,9, 10, 11, 12 which can provide the information about single molecule dynamics associated with molecular interactions and biochemical reactions in biological and chemical systems. Compared to fluorescence confocal microscopy, total internal reflection fluorescence microscopy (TIRFM)13, 14, 15, 16 takes the advantages of evanescent light field with exponential intensity decay at the interface to simultaneously probe a wide plane area, typically ∼104 times larger than the size of a confocal focus spot, as illustrated in Figure 1b. Since the excitation is carried out by an evanescent electromagnetic field exhibiting exponential intensity decay in ∼200 nm vertically from the total internal reflection interface, TIRFM eliminates background of fluorescence photons from fluorescent molecules located more than ∼200 nm away from the interface.
Figure 1.
Schematic overview of basic characteristics of fluorescence confocal microscope and total internal reflection fluorescence microscope. (a) Fluorescence confocal microscope (FCM) with excitation beam waist ∼250–300 nm. (b) Total internal reflected fluorescence microscope (TIRFM) with wide excitation area, which is typically ∼104 times larger than confocal spot in objective-type configuration, and with vertical resolution ∼100 nm.
Although both fluorescence confocal microscope imaging and TIRFM imaging serve as essential approaches to observe single molecule dynamics with wide applications,1, 2, 3, 4 they also show their limitations when simultaneously requiring sampling view fields and sampling time resolutions. Fluorescence confocal microscope is often equipped with avalanche photodiodes or single photon avalanche diodes (SPAD), which are suitable for high time resolution measurements in time-resolved dynamics analyses. However, the single pinpoint detection constrains the efficiency of detecting spatially and temporally randomly distributed single-molecule fluorogenic events, such as fluorogenic product turnovers of single-molecule enzymatic reactions. TIRFM cannot provide high time resolution due to two-dimensional imaging. However, the much larger simultaneously sampling view fields dramatically improve the possibility of identifying the tethered enzymes only by the temporally random fluorogenic signal. Therefore, it is desirable to design an integrated spectroscopy combining the advantage of wide field imaging of TIRFM with the advantage of high time resolution of confocal fluorescence spectroscopy, through (1) detecting reaction active sites and recording their coordinates by TIRFM and (2) relaying on the recorded coordinates to guide the confocal single-molecule spectroscopy measurements for individual pinpoints of interest.
Combining the advantages of spatial resolution of confocal microscopy and total internal reflection microscopy had been well demonstrated by the integrated apparatus in previously reported studies,17, 18, 19, 20, 21, 22, 23, 24, 25 which deployed vertical (z-axial) resolution of total internal reflection configuration and lateral resolution of confocal configuration to improve the imaging spatial resolution. In this article, we report our new development of integrated spectroscopy system, which combined the advantages of wide plane view field of objective-type TIRFM imaging with high time-resolution confocal single-molecule spectroscopy to address the challenge of probing both temporally and spatially stochastic events of the single-molecule reactions, such as fluorogenic enzymatic reactions with enzyme tethered to a solution/glass interface.26 We have demonstrated the calibration of this integrated apparatus with fluorescence microspheres and the feasibility by spectroscopy measurement of single molecule Rhodamine 6G on glass surface. Finally, we have demonstrated the application to spatially and temporally randomly distributed single-molecule enzymatic reaction of fluorogenic substrate, horseradish peroxidase-catalyzed oxidation of amplex red.
INSTRUMENT DESIGN
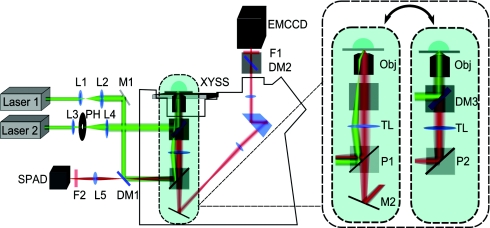
This objective-type TIRFM imaging-guided confocal single-molecule fluorescence spectroscopy system (Figure 2) is based on an inverted microscope (Axiovert 200M, Carl Zeiss) in an epi-illumination configuration to combine TIRFM mode with confocal mode, facilitated with a home-developed software for recording imaging from TIRFM mode and shifting the pinpoints of interest from TIRFM imaging to confocal single-molecule spectroscopy measurements.
Figure 2.
Schematic of TIRFM imaging-guided confocal single-molecule fluorescence spectroscopy. Laser 1: cw laser source; Laser 2: pulse laser source; L1–L5: lenses; M1: reflection mirror; DM1–DM3: dichroic mirror beam splitters; P1: side port prism for left/vis obs; TL: tube lens; Obj: Objective; XYSS: x-y scanning stage; M2: beam path switch for visual obs; F1–F2: emission filters; PH: excitation pin hole; P2: side port prism for left. TIRFM mode beam path: Laser 1-L1-L2-M1-DM1-P1-TL-Obj-TL-P1-M2-DM2-F1-EMCCD; confocal mode beam path: Laser 2-L3-PH-L4-DM3-Obj-DM3-TL-P2-DM1-L5-F2-SPAD.
In the TIRFM mode, a cw laser (GCL-050-L, CrystaLaser) beam is expanded by the telescope of lens 1 and lens 2, and aligned to the side port of the microscope stand by a dichroic mirror beam splitter (DM1) with axis of rotation located in the intermediate image plane. The beam from the side port is then reflected by the side port prism (P1), passed through the empty filter cube, and focused by the tube lens (TL) on the back focal plane of the objective (Plan-Fluar, 1.45 NA, 100×, Carl Zeiss). After passing through the objective, the beam is tightly collimated and incident on the cover glass. By fine adjusting the rotation angle of the DM1 slightly from 45º relative to the incident direction of the laser beam, the incident angle at the cover glass/solution interface can be adjusted to exceed the critical angle of total internal reflection. An evanescent electromagnetic field with exponential intensity decay in the normal direction is generated at the cover glass-solution interface. The fluorescence molecules located in the evanescent field range are selectively excited. The fluorescence emission is collected by the same microscope objective, passing P1, reflected by M2 to the top port of the microscope stand. Before entering the multiplication charge coupled device (EMCCD) camera (Photomax 512B, Princeton Instruments), the emission signal is purified by dichroic mirror beam splitter (DM2) and emission filter (F1) with deflection and blocking the excitation laser light, respectively. In our current experiments, the refractive index of solution is 1.33 and that of the cover glass is 1.515; here, 0.68º deviation from the 45º incident angle of the DM1 provides total internal reflection with evanescent field depth about 100 nm.
In the confocal mode, a femtosecond pulse laser (Laser 2, Ti:Sapphire Mira 900F/P, Coherent Inc.) is used. After an optical parametric oscillator (OPO BASIC, Coherent Inc.) and frequency doubling by a β-barium borate crystal (BBO), the linear-polarized pulse laser is aligned through a lens-pinhole-lens system which includes lens (L3), pinhole (PH, 10 μm), and lens (L4) to expand the beam diameter. Then the extended parallel beam, passing through the back port of the microscope stand, is reflected by the dichroic mirror beam splitter (DM3) in the filter cube, and focused on cover glass-solution interface by the objective (Obj). The cover glass is fixed on the piezoelectric scanning stage (Nano-H100, MCL) with a positioning resolution of 0.2 nm for fine-tune. Fluorescence emission from the excitation focal volume is collected by the same objective (Obj). After transmitting DM3, the signal is reflected by the side port prism (P2), transmitted DM1, and then refocused by the re-magnification lens (L5) to the SPAD (PDM50ct, MPD) entrance. Here the sensor target diameter of SPAD is 50 μm, which also serves as a pinhole to reject stray and ambient light noise. The signal from the detector is processed by a single photon counting module (SPC-830, Becker & Hickl GmbH) to record both chronic arrival time and delay time between the pulse excitation and molecule excited state emission with high time resolution for each single photon event.
The common part of the optical paths for the two modes lies between DM1 and the cover glass. Switching between the two modes is achieved by toggling the filter cube turret and the side port prism. To guide the confocal spectroscopic measurements of the spots of interest in the TIRFM frame, the coordinates of the spots of interest in sample scanning stage frame is determined by matrix transformation. The sample does not move relative to the stage, which makes the system stable under experimental conditions. The transformation relationship is as follows:
| (1) |
Here (xccd, yccd) is any spot of interest in TIRFM frame, and (xsss, ysss) is the coordinate of this spot in sample scanning stage frame. T is the transformation matrix that can be determined from any three non-collinear patterned spots’ coordinates in TIRFM frame and the sample scanning stage frame.
CALIBRATION AND TEST
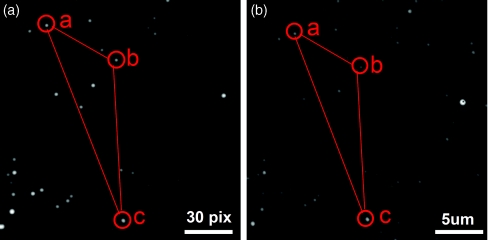
We have demonstrated a calibration experiment, using 100 nm fluorescence microspheres (F-8800, Invitrogen) as imaging probes to construct the transformation matrix. Excitation and emission maxima of the fluorescence microspheres are 540 nm and 560 nm, respectively. The sample was prepared by dropping diluted solution of microspheres on a clean cover glass (Gold seal, 3419). When the microspheres were dry, the cover glass was placed on the sample scanning stage. Then, about 30 μl water was slowly dropped near the laser position on cover glass, and the microspheres were still attached to the cover glass. Figures 3a, 3b show the fluorescence images from EMCCD in the TIRFM imaging mode and from SPAD through scanning the sample scanning stage in the confocal imaging mode, respectively. From the distribution pattern of the microspheres, it is identifiable that the microsphere a in Figure 3a is the same one as the microsphere a in Figure 3b. Similarly, the microsphere b and microsphere c in Figure 3a are the same ones as the microsphere b and microsphere c in Figure 3b. Substituting the corresponding coordinates of a, b, and c in Figures 3a, 3b to Eq. 1, the transformation matrix is then determined, and this transformation relationship is used to guide registration of any spot of interest in EMCCD view field to the confocal excitation spot.
Figure 3.
Calibration of TIRFM imaging-guided confocal single-molecule fluorescence spectroscopy. (a) Fluorescence image of the microspheres in EMCCD coordinates by TIRFM mode. (b) Fluorescence image of the microspheres in scanning translation stage coordinates by confocal mode. According to the special pattern, the microspheres a, b, and c in (a) are the same ones a, b, and c in (b).
Considering that the accuracy of localization of the selected microspheres in different coordinates influences the accuracy of transformation matrix T, we calculated the center of each microsphere of interest by using the two-dimensional Gaussian fit of the spatial distribution of fluorescence intensity. The uncertainty of the center localization is determined by27
| (2) |
where the index i refers to x axis or y axis, and other parameters are the number of collected photons (N), the standard deviation of Gaussian distribution (s), the pixel size of imaging detector (a), and the background noise (b). The number of collected photons is crucial in determining the uncertainty (σi). In our experiments, using the high-brightness fluorescence microspheres and the long exposure time, the uncertainty of the center can be controlled in nm scale.
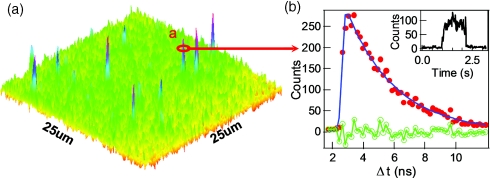
We have demonstrated the feasibility of the TIRFM imaging-guided confocal single-molecule fluorescence spectroscopy with single-molecule spectroscopic measurement of Rhodamine 6G molecules. In sample preparation, the cover glass was cleaned by corrosion of fresh chromic acid solution to eliminate the possible fluorescent spots. After washing with water and dry with nitrogen gas, the clean cover glass was first spin-coated (3000 rpm, Spincoat G3-8) with 20 μl Rhodamine 6G aqueous solution (3 × 10⁻¹¹ M), then 30 μl PMMA/toluene (1 wt. %) solution was spin-coated on the cover glass to confine Rhodamine 6G molecules from diffusion. The thickness of PMMA film is about 26 nm, and the optical index of the PMMA film is essentially similar to that of the cover glass (both are close to 1.52).28 After placing cover glass on the sample scanning stage, 30 μl water was dropped on the cover glass, which provided a solution/cover-glass interface. Figure 4a shows a total internal reflection fluorescence microscopy imaging result of Rhodamine 6G molecules. According to transformation relationship, the emission of any pinpoint spot of interest in Figure 4a can be shifted to the focal spot of the femtosecond laser by coordinating the computer controlled x-y scanning stage at nanosclae precision. Figure 4b shows the time-resolved fluorescence intensity decay of single Rhodamine 6G molecule from the selected spot a of Figure 4a imaged by TIRFM. The lifetime of the confined single Rhodamine 6G was determined as 3.1 ± 0.3 ns by a single exponential fit.
Figure 4.
Feasibility of TIRFM imaging-guided confocal single-molecule fluorescence spectroscopy. (a) Image of Rhodamine 6G molecules in TIRFM mode. (b) The corresponding confocal single-molecule spectroscopy measurement on molecule a in (a). The fluorescence intensity decay from single-molecule photon stamping recording is fitted with exponential decay with fit residual; the fluorescence lifetime of the single Rhodamine 6G molecule is 3.1 ± 0.3 ns. Inset: The intensity trajectory of the single molecule.
Finally, we have demonstrated the application of TIRFM imaging-guided confocal single-molecule fluorescence spectroscopy through detecting spatially and temporally randomly distributed single-molecule enzymatic reaction of fluorogenic substrate, horseradish peroxidase-catalyzed oxidation of amplex red. In sample preparation, the clean cover glass was silanized overnight with mixture solution of (3-aminopropyl) trimethoxysilane (Fluka, 09324), isobutyltrimethoxysilane (Sigma, 444065), and dimethylsulfoxide (Sigma, D4540) with ratio at 1:30 000:600 000 (in volume). After washing with methanol and water, the silanized cover glass was incubated in 10 nM dimethyl suberimidate (Thermo Scientific, 20700) in 50 mM PBS buffer (pH 8.0) for 4 h. The phosphate buffer (PBS) was prepared with potassium phosphate monobasic solution (Sigma Aldrich, P8709) and potassium phosphate dibasic solution (Sigma Aldrich, P8584). At this step, one amine-reactive imidoester group of dimethyl suberimidate is linked to the amino group on the modified cover glass surface. After additional washing, the cover glass was incubated with 1 nM horseradish peroxidase (HRP) (Sigma Aldrich, P8375) in 50 mM PBS buffer (pH 8.0) for 4 h followed by rinsing with water and PBS buffer. Then, another amine-reactive imidoester group of dimethyl suberimidate reacted with the amino group in HRP and linked the HRP to the cover glass. After placing a modified cover glass on the sample scanning stage, 30 μl reaction solution containing amplex red (200 nM), H2O2 (2 mM) in PBS buffer solution (pH 7.3) was dropped on the cover glass. The spatially and temporally randomly distributed turnover events of fluorescent products of the enzymatic reaction were recorded by EMCCD in TIRFM mode.
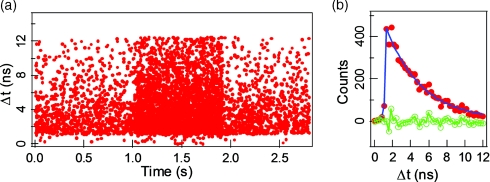
The single-molecule photon time-stamping data contains more detailed information than a conventional time-correlated single photon counting delay time histogram, adding the chronic arrival time trajectory, i.e., the consecutive arrival time of each detected photon. Figure 5a shows the single-molecule photon time-stamping recording of an individual turnover event of fluorescent product from one of the active tethered enzyme. Each dot in Figure 5a corresponds to a detected photon plotted by its chronic arrival time and delay time. From the photon density along the x axis, the background and the signal associated with recording a product turnover before product releasing can be clearly discriminated. Here, we only show the lifetime analysis of the enzymatic product resorufin confined by a single enzyme, before it was released. The fluorescence intensity decay is shown as dots (which was binned with 0.25 ns in histogram) in Figure 5b. The lifetime of the detected enzymatic product resorufin molecule is determined as 3.9 ± 0.2 ns by a single exponential fit, and the corresponding fitting residual is also shown.
Figure 5.
Application of TIRFM imaging-guided confocal single-molecule fluorescence spectroscopy on spatially and temporally randomly distributed single-molecule enzymatic reaction, horseradish peroxidase-catalyzed oxidation of amplex red. Horseradish peroxidase uses amplex red as an electron donor in the reduction of hydrogen peroxide to water. The product of enzymatic reaction, resorufin, is a highly fluorescent compound. (a) The single-molecule photon time-stamping raw data of an individual turnover event of fluorescent product from one of the active tethered enzyme. Each dot corresponds to a photon stamped with the chronic arrival time (t) and the single-photon delay time (Δt) between the photon emission and femtosecond laser pulse excitation. (b) Fluorescence intensity decay of a newly formed single resorufin molecule confined in the enzyme. The fluorescence intensity decay from single-molecule photon time-stamping recording is fitted with exponential, with fit residual. The fluorescence lifetime of the confined single resorufin molecule is 3.9 ± 0.2 ns.
CONCLUSIONS
In conclusion, we have demonstrated a new integrated single-molecule spectroscopy approach by using total internal reflection fluorescence microscopy imaging to guide confocal single molecule fluorescence spectroscopic measurements. With the localization by two-dimensional Gaussian fit and coordinates transformation, any single-molecule fluorescence spot of interest in the imaging field of TIRFM imaging mode is accurately registrated and shifted to the excitation focus of confocal mode for single-molecule fluorescence spectroscopic measurements, through a computer-controlled close loop piezoelectric x-y scanning stage. Our integrated system have a number of significant advantages including the low requirement for laser power of the femtosecond pulse laser, avoiding of photon bleaching by wide field excitation, high signal collection efficiency for the confocal single-molecule fluorescence spectroscopic measurements. We have demonstrated the capability of both multiple molecules sampling simultaneously and in situ fluorescence time-resolved analyses for pinpoint individual molecules. It is applicable to conduct the measurements of the spatially and temporally stochastic single-molecule on interfaces.
ACKNOWLEDGMENTS
This work is supported by the Office of Basic Energy Sciences within the Office of Science of the U.S. Department of Energy (DOE) and by the Basic Material Sciences of Army Research Office. This work is also supported in part by NIH NIGMS and NIH NIEHS. We thank Yufan He for his stimulating discussions and Lijun Guo for his contribution to early setup of the microscope system.
References
- Nie S. M. and Zare R. N., Annu. Rev. Biophys. Biomol. Struct. 26, 567 (1997). 10.1146/annurev.biophys.26.1.567 [DOI] [PubMed] [Google Scholar]
- Ambrose W. P., Goodwin P. M., Jett J. H., Van Orden A., Werner J. H., and Keller R. A., Chem. Rev. 99(10), 2929 (1999). 10.1021/cr980132z [DOI] [PubMed] [Google Scholar]
- Moerner W. E. and Fromm D. P., Rev. Sci. Instrum. 74(8), 3597 (2003). 10.1063/1.1589587 [DOI] [Google Scholar]
- Michalet X., Weiss S., and Jager M., Chem. Rev. 106(5), 1785 (2006). 10.1021/cr0404343 [DOI] [PMC free article] [PubMed] [Google Scholar]
- Krichevsky O. and Bonnet G., Rep. Prog. Phys. 65(2), 251 (2002). 10.1088/0034-4885/65/2/203 [DOI] [Google Scholar]
- Lu H. P., Acc. Chem. Res. 38(7), 557 (2005). 10.1021/ar0401451 [DOI] [PubMed] [Google Scholar]
- Nie S. M., Chiu D. T., and Zare R. N., Science 266(5187), 1018 (1994). 10.1126/science.7973650 [DOI] [PubMed] [Google Scholar]
- Jeffries G. D. M., Lorenz R. M., and Chiu D. T., Anal. Chem. 82(23), 9948 (2010). 10.1021/ac102173m [DOI] [PMC free article] [PubMed] [Google Scholar]
- Tan X., Hu D. H., Squier T. C., and Lu H. P., Appl. Phys. Lett. 85(12), 2420 (2004). 10.1063/1.1791329 [DOI] [Google Scholar]
- Tan X., Nalbant P., Toutchkine A., Hu D. H., Vorpagel E. R., Hahn K. M., and Lu H. P., J. Phys. Chem. B 108(2), 737 (2004). 10.1021/jp0306491 [DOI] [Google Scholar]
- Hu D. H. and Lu H. P., J. Phys. Chem. B 107(2), 618 (2003). 10.1021/jp0213654 [DOI] [Google Scholar]
- Yang H. and Xie X. S., J. Chem. Phys. 117(24), 10965 (2002). 10.1063/1.1521154 [DOI] [Google Scholar]
- Axelrod D., Burghardt T. P., and Thompson N. L., Annu. Rev. Biophys. Bioeng. 13(1), 247 (1984). 10.1146/annurev.bb.13.060184.001335 [DOI] [PubMed] [Google Scholar]
- Schneckenburger H., Curr. Opin. Biotechnol. 16(1), 13 (2005). 10.1016/j.copbio.2004.12.004 [DOI] [PubMed] [Google Scholar]
- Tokunaga M., Kitamura K., Saito K., Iwane A. H., and Yanagida T., Biochem. Biophys. Res. Commun. 235(1), 47 (1997). 10.1006/bbrc.1997.6732 [DOI] [PubMed] [Google Scholar]
- Wazawa T. and Ueda M., Adv. Biochem. Engin./Biotechnol. 95, 77 (2005). [DOI] [PubMed] [Google Scholar]
- Thompson N. L., Wang X., and Navaratnarajah P., J. Struct. Biol. 168(1), 95 (2009). 10.1016/j.jsb.2009.02.013 [DOI] [PMC free article] [PubMed] [Google Scholar]
- Ries J., Petrov E. P., and Schwille P., Biophys. J. 95(1), 390 (2008). 10.1529/biophysj.107.126193 [DOI] [PMC free article] [PubMed] [Google Scholar]
- Thompson N. L. and Steele B. L., Nat. Protoc. 2(4), 878 (2007). 10.1038/nprot.2007.110 [DOI] [PubMed] [Google Scholar]
- Hassler K., Anhut T., Rigler R., Gosch M., and Lasser T., Biophys. J. 88(1), L1 (2005). 10.1529/biophysj.104.053884 [DOI] [PMC free article] [PubMed] [Google Scholar]
- Hassler K., Leutenegger M., Rigler P., Rao R., Rigler R., Gosch M., and Lasser T., Opt. Express 13(19), 7415 (2005). 10.1364/OPEX.13.007415 [DOI] [PubMed] [Google Scholar]
- Ruckstuhl T. and Seeger S., Appl. Opt. 42(16), 3277 (2003). 10.1364/AO.42.003277 [DOI] [PubMed] [Google Scholar]
- Ruckstuhl T. and Seeger S., Opt. Lett. 29(6), 569 (2004). 10.1364/OL.29.000569 [DOI] [PubMed] [Google Scholar]
- Burghardt T. P., Ajtai K., and Borejdo J., Biochemistry 45(13), 4058 (2006). 10.1021/bi052097d [DOI] [PubMed] [Google Scholar]
- Ivanov D., Shcheslavskiy V., Marki I., Leutenegger M., and Lasser T., Appl. Phys. Lett. 94(8), 3 (2009). 10.1063/1.3077309 [DOI] [Google Scholar]
- Blank K., Cremer G. De, and Hofkens J., Biotechnol. J. 4(4), 465 (2009). 10.1002/biot.200800262 [DOI] [PubMed] [Google Scholar]
- Thompson R. E., Larson D. R., and Webb W. W., Biophys. J. 82(5), 2775 (2002). 10.1016/S0006-3495(02)75618-X [DOI] [PMC free article] [PubMed] [Google Scholar]
- Walsh C. B. and Franses E. I., Thin Solid Films 429(1-2), 71 (2003). 10.1016/S0040-6090(03)00031-2 [DOI] [Google Scholar]


