Abstract
Purpose: Since the introduction of clinical x-ray phase-contrast mammography (PCM), a technique that exploits refractive-index variations to create edge enhancement at tissue boundaries, a number of optimization studies employing physical image-quality metrics have been performed. Ideally, task-based assessment of PCM would have been conducted with human readers. These studies have been limited, however, in part due to the large parameter-space of PCM system configurations and the difficulty of employing expert readers for large-scale studies. It has been proposed that numerical observers can be used to approximate the statistical performance of human readers, thus enabling the study of task-based performance over a large parameter-space.
Methods: Methods are presented for task-based image quality assessment of PCM images with a numerical observer, the most significant of which is an adapted lumpy background from the conventional mammography literature that accounts for the unique wavefield propagation physics of PCM image formation and will be used with a numerical observer to assess image quality. These methods are demonstrated by performing a PCM task-based image quality study using a numerical observer. This study employs a signal-known-exactly, background-known-statistically Bayesian ideal observer method to assess the detectability of a calcification object in PCM images when the anode spot size and calcification diameter are varied.
Results: The first realistic model for the structured background in PCM images has been introduced. A numerical study demonstrating the use of this background model has compared PCM and conventional mammography detection of calcification objects. The study data confirm the strong PCM calcification detectability dependence on anode spot size. These data can be used to balance the trade-off between enhanced image quality and the potential for motion artifacts that comes with use of a reduced spot size and increased exposure time.
Conclusions: A method has been presented for the incorporation of structured breast background data into task-based numerical observer assessment of PCM images. The method adapts conventional background simulation techniques to the wavefield propagation physics necessary for PCM imaging. This method is demonstrated with a simple detection task.
Keywords: mammography, phase-contrast, task-based assessment, background model
INTRODUCTION
In-line phase-contrast mammography (PCM) employs x-ray Gabor holography to measure intensity variations that arise from refractive index discontinuities in breast tissue.1 With minor modifications to the conventional mammography geometry and x-ray tube anode spot size, PCM exploits the fact that changes in tissue density, which give rise to refractive index variations, can provide significant soft-tissue contrast from small structures even when conventional absorption contrast is low.2, 3, 4 Indeed, preliminary studies using the Konica-Minolta REGIUS PureView™ system have demonstrated improved lesion detection from PCM when compared to conventional mammography.5 However there remains a significant need for further system assessment and optimization. Several studies of physical image quality metrics have been performed for the optimization of phase-contrast imaging systems.6, 7, 8, 9, 10, 11, 12 For example, Yamazaki et al. investigated the edge response, noise characteristics, and effects of object position and orientation both experimentally and with computer simulations.12
Despite these investigations, studies employing task-based, or objective, image quality measures have been very limited.13 Task-based image quality analysis provides a numerical assessment of a human or numerical observer’s average performance of a specific diagnostic task. As it is impractical to employ expert readers to assess images acquired over a wide parameter space, numerical observers are often used. Numerical observers make a binary decision by comparing a numerical test statistic, which is calculated from the observed image data, to a numerical decision threshold. In the signal-known-exactly, background-known-statistically (SKE-BKS) task that is employed in this work, numerical observers require knowledge of the signal and the statistical properties of the background. Indeed, background variability is known to be a limiting factor in signal detection14 and is, therefore, important to model in PCM. In conventional mammography, background data are often simulated using lumpy background models, which are generated by superimposing randomly positioned lump structures.14 Conventional lumpy background (CLB) models, which employ clusters of circularly nonsymmetric exponential lumps, mimic the structural appearance and statistical properties of healthy breast tissue background images.15, 16 As these models account for only the absorption response from breast tissue, they are not appropriate for direct application to PCM techniques.
In this work, the CLB model proposed by Bochud et al.15 is adapted by using breast tissue refractive indices to construct monoenergetic x-ray wavefields from the background breast tissue structure that are subsequently propagated with Fresnel propagation methods and weighted by the spectrum from a clinical source to form polyenergetic PCM intensity images. The statistical properties of the resulting intensity data are incorporated into a detection task and, as a demonstration of the technique, an analysis of the impact of x-ray tube anode spot size and calcification diameter on ideal observer detection performance is conducted.
METHODS
Image formation
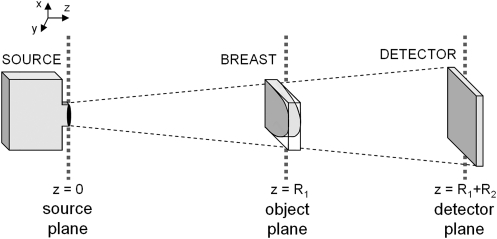
Unlike conventional mammography, PCM exploits the phase perturbations that occur upon x-ray wavefield propagation through tissue. This refraction process has been simulated using geometrical optics approximations in the past,12 but we forgo this approximation in favor of a full-wave description of the imaging system. Under this model, the formation of a PCM intensity image requires the propagation of a wavefield that has been perturbed by the breast (see Fig. 1 for the geometry of a PCM system). For a breast composed of M tissue types, a monoenergetic wavefield at the object plane is written as
| (1) |
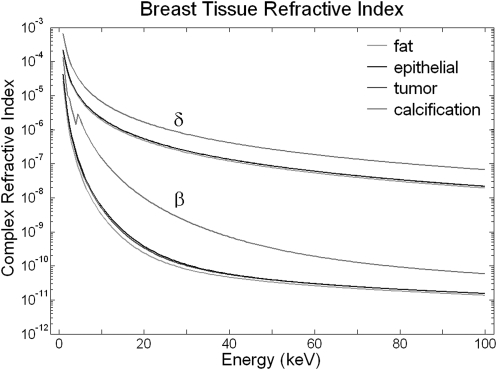
under a thin-specimen plane-wave model, where x, y, and z are Cartesian coordinates with z oriented in the x-ray propagation direction, R1 is the source-to-breast distance, βm(r, E) and δm(r, E) are respectively the absorption and refraction components of the mth breast tissue complex refractive index nm(r, E) = 1 − δm(r, E) + iβm(r, E), tm is the thickness of the mth tissue, ℏ is the reduced Planck constant, and c is the speed of light. Published elemental composition data17, 18, 19, 20, 21 for adipose tissue, tumor tissue, epithelial tissue, and calcifications are used, along with published tissue density values ρm (Refs. 17, 18, 20, 21, 22; see Table Table I.), to find narrow-beam attenuation values μm(E) from the XCOM database.23 The refractive indices, shown in Fig. 2, are computed from these data as
| (2) |
and
| (3) |
where re is the classical electron radius and u is the unified atomic mass unit.24
Figure 1.
This diagram shows the geometry of a phase-contrast mammography system. Phase perturbations due to breast refractive index discontinuities manifest as intensity variations at the detector.
Table 1.
Tissue properties, derived from published data,17, 18, 19, 20, 21, 22 used to compute the complex refractive index of the simulation model. These data are derived from published values.
| Elemental composition (%) | ||||||||
|---|---|---|---|---|---|---|---|---|
| Tissue type | H | C | N | O | Cl | Ca | P | Density (g/cm3) |
| Tumor | 9.6 | 26.2 | 5.5 | 57.3 | 0.0 | 0.0 | 0.0 | 1.043 |
| Adipose | 11.8 | 65.6 | 0.9 | 21.7 | 0.1 | 0.0 | 0.1 | 0.925 |
| Epithelium | 9.8 | 18.4 | 3.8 | 67.8 | 0.0 | 0.0 | 0.5 | 1.038 |
| Calcification | 4.5 | 0.0 | 0.0 | 59.1 | 0.0 | 22.7 | 13.6 | 3.200 |
Figure 2.
The energy-dependent x-ray refractive index (n = 1 − δ + iβ) properties of breast tissue shown here were derived from the XCOM database and the elemental compositions shown in Table Table I..
Each calculated monoenergetic wavefield is propagated to the detector plane (z = R1 + R2, where R2 is the breast-to-detector distance) using a Fresnel propagator, which is expressed in the spatial Fourier domain as
| (4) |
where F and denote the two-dimensional Fourier transform and inverse Fourier transform operations, kx and ky are the spatial frequency-space coordinates conjugate to x and y, and is the Fresnel propagation kernel.25 After propagation of the monoenergetic wavefields, the simulated26 source spectrum fluence Φ(E) and detector efficiency q(E) data are applied and the detector-plane field intensity calculated by
| (5) |
Incorporation of a background model
In this section, the main contribution of this work, namely the adaptation of a CLB model for task-based evaluation of PCM imaging, is described. The CLB intensity is formed by summing over rotated sets of randomly positioned lumps centered around randomly positioned clusters. Construction of an object-plane wavefield via Eq. 1 requires background tissue component thickness data. As the CLB intensity map is used to mimic mammography projection images from compressed healthy breast tissue, one can assume that the breast tissue is composed of fat and epithelial tissues and use the Beer–Lambert Law to write the background intensity
| (6) |
where βe(E) and βf(E) are the imaginary parts of the complex refractive indices of epithelial and fat tissue, respectively, and te(x,y) and tf(x,y) are the transverse spatial distributions of epithelial and fat tissue thicknesses, respectively. To solve for te(x,y) and tf(x,y), the center energy (Ec) for a typical mammography spectrum is used and the thickness values are calculated by te(x,y) = ln[ICLB(x,y;Ec) + μf(Ec)t]/μf(Ec) − μe(Ec) and tf(x,y) = t − te(x,y), where t = te(x,y) + tf(x,y) is the spatially uniform compressed breast thickness. Furthermore, the CLB method is designed for use with clinical detector pixel sizes (approximately 300 μm),15 but much finer sampling (approximately 1 μm) is required for PCM simulation in order to generate a wavefield with a smoothly varying phase. To adapt the technique for regions having an arbitrary pixel size and region size, the original lump size and position standard deviation were scaled.
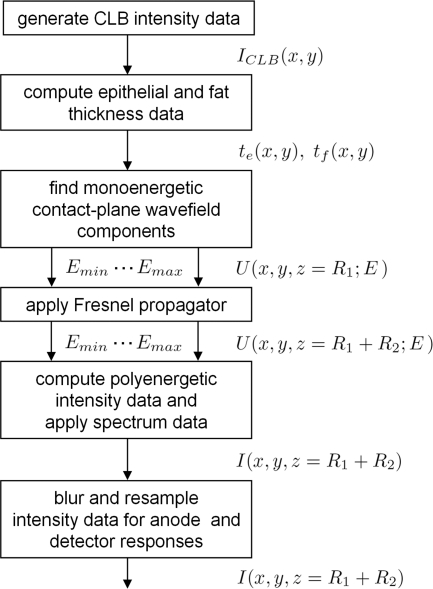
As shown in Fig. 3, evaluating Eq. 1 using these computed tissue thickness data, applying the propagation described in Eq. 4, and summing over all source spectral components via Eq. 5 yields intensity data at the detector plane. System and source anode spot size blur and detector pixel binning may be approximated by convolution with a Gaussian function and rebinning, respectively (see Fig. 4). Finally, an appropriate clinical image exposure time can be determined by setting the maximum mean glandular dose and employing techniques described in the literature.27 Evaluation of Eq. 1 is carried out both with and without an object of interest present in the tissue thickness data tm. This results in wavefield data that, after propagation and spectral weighting, yield signal-present (also known as object-present) and signal-absent (or object-absent) M × M images, respectively, which are denoted g1 and g0 in M2 × 1 column vector form.
Figure 3.
This flow chart shows the steps necessary to adapt the CLB model for PCM and compute propagated detector-plane intensity data.
Figure 4.
This figure shows the effect of anode spot size on edge enhancement in PCM. The image on the left (and inset line plot through the center row) shows the ideal intensity, with an infinitely small spot size, due to an 80-μm-diameter calcification object in an adapted CLB breast background under a Konika–Minolta system geometry (Ec = 25 keV, E = 25 keV). The middle and right images have been blurred to account for 20 μm and 50 μm anode spot sizes, respectively. Images are displayed in Hounsfield units.
Simulation study
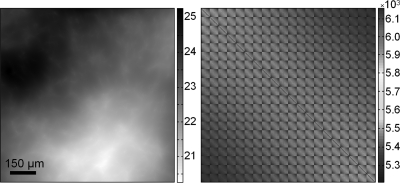
Task-based evaluation of the simulated image data is carried out by comparing a decision threshold to the signal-present test statistic λ(g1) and the signal-absent test statistic λ(g0). The ideal observer SKE-BKS test statistic, when the noise and background processes are approximated as Gaussian,28 is expressed λ(gj) = ΔsTK−1gj, where (·)T denotes the transpose operation, Δs = g1 − g0 is the image signal vector and K is the M2 × M2 covariance matrix due to variability in the background data and noise. An estimate of the covariance matrix is computed emprically29 as , where , with 1 × 10⁶ total realizations of background and noise. The test statistic used here, which incorporates a signal-absent K estimate, approximates the ideal observer test statistic under a weak-object assumption. Specifically, for computational efficiency the covariance matrix was empirically computed using background data only, as the weak signal is assumed to have little influence on the statistics. The covariance matrix estimate due to the PCM background intensity on the detector plane is shown in Fig. 5. These data play a central role in the calculation of the test statistic. The covariance matrix shown here demonstrates the significant spatial correlation present in the PCM background data, as the matrix is not diagonal in this representation.
Figure 5.
The background intensity data on the left is the detector-plane intensity due to the propagation of a monoenergetic wavefield derived from a CLB model (Konica-Minolta system geometry, Ec = 25 keV, E = 25 keV, 49 μm pixel size; intensity is displayed as percent transmission). The image on the right shows the empirically computed noisy background covariance estimate K for polyenergetic background data (28 kVp Mo source, 30 -μm-thick Mo filter, 100 μm anode spot size, and 100 mRad mean glandular dose).
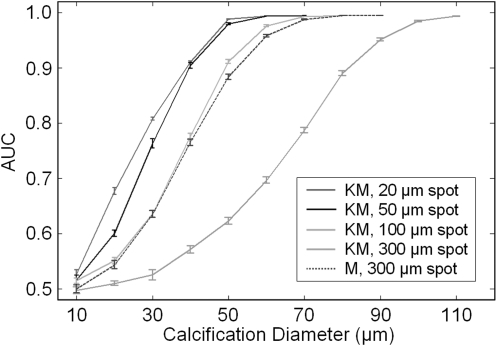
As an example of the methods presented in this work, we consider the task of detecting a spherical calcification object of varying diameter (10–150 μm) in a 4-cm-thick breast having a 50% glandular composition. The Konica-Minolta system geometry (R1 = 65 cm, R2 = 49 cm) and a conventional mammography geometry (R1 = 65 cm, R2 = 2 cm) were simulated with a Mo source (28 kVp, 4.5 kW maximum power, 30 -μm-thick Mo filter, 20–300 μm variable anode spot size) and a digital detector (200 -μm-thick CdZnTe layer, 49 -μm detector pixel size). In this study, a constant mean glandular dose of 100 mRad was maintained, causing the imaging time to vary as a function of tube power. The region of interest was limited to a 20 × 20 pixel detector area for computational efficiency,30 and 5000 total realizations of background and detector pixel position were employed in five groups of equal size. The receiver operating characteristic curve is computed by sweeping a threshold value across all test statistic values and computing the true positive fraction and the false positive fraction. The area under the receiver operating characteristic curve (AUC) is used here as a detectability figure of merit.
RESULTS AND DISCUSSION
The results of this initial demonstration are shown in Fig. 6, where the AUC values are shown for multiple calcification diameters and anode spot sizes. For all system configurations, the detectability behaves as expected, varying from 0.5 (the result when the object identification task is reduced to a guess) to 1 (the result when error-free object identification is achieved) while increasing with calcification size. Under the Konica-Minolta system geometry, calcification detectability improves with decreasing anode spot size, a result that confirms the well-known importance of the source spot size on PCM system performance. It is worth reiterating that mean glandular dose was held constant in this work, causing imaging time to decrease with increasing spot size (20, 50, 100, and 300 μm spots yield imaging times of 66.1, 10.6, 2.6, and 0.3 s, respectively), an issue with clear clinical implications in regards to patient motion and associated blurring artifacts. Imaging times on the order of 10 s are used clinically in some breast tomosynthesis systems, demonstrating the possibility of significant acquisition times without corruption due to patient motion. A PCM acquisition time on this order, when coupled with a reduced spot size of 50 μm, as is available in microfocus tubes, could significantly improve the detectability of small calcifications when compared to the 100 μm spot size used in the clinical Konica-Minolta system.
Figure 6.
As an example of the methods described in this work, the effect of the source spot size on calcification detectability was studied for the Konica-Minolta system geometry (denoted KM) and a typical mammography geometry (denoted M). These results show that, although the typical Konica-Minolta system configuration (source size of 100 μm) may offer somewhat better performance than mammography, improved detectability can be achieved when the source spot size is further reduced. Note that the mean glandular dose was held constant at 100 mRad for these studies and that imaging times varied.
It is also noteworthy that PCM results showed a small improvement in detectability over the conventional mammography geometry, which is consistent with the modest enhancement demonstrated from preliminary clinical studies.31 This improvement is likely underestimated due to the fact that the effects of Compton scattering were not included in this preliminary study. Because of the large air gap between the object and detector in PCM, the amount of scattered radiation detected is less than in conventional mammography. Although it is beyond the scope of this work, a variety of techniques for simulating the contribution of scatter, including analytical methods,32 could potentially be applied for future comprehensive system optimization studies. Furthermore, it should be noted that the use of a spherical calcification in this study is a first approximation of a real calcification and may be easier to detect than a highly irregular object.
The background structure used in this work is directly computed from the CLB technique, which has been demonstrated to closely mimic the appearance and statistical properties of mammography backgrounds. As this computation is performed using the Beer−Lambert Law, which is derived from first principles, the background structure has a close physical relationship to the breast background structure that forms PCM images. There is a need for further validation of these background structures using a large-scale database of experimental PCM data.
This work is the first to incorporate a realistic breast background structure into signal detectability studies of PCM. Moreover, this work specifically addresses the lack of PCM background simulation methods in the literature. The construction and propagation of a wavefield due to normal breast structures is a significant step toward the task-based assessment and optimization of PCM systems, as structured background data are crucial to the accuracy of task-based image quality assessment. In particular, these techniques can be used to more completely investigate the task-based performance of PCM system configurations over a larger parameter space than is feasible using experimental results and human readers. These methods will facilitate further optimization of PCM for the detection of small breast cancer features and may, in turn, improve the clinical performance of this promising technique.
ACKNOWLEDGMENTS
This work was supported in part by National Institutes of Health grants (Grant Nos. CA111976, CA136102, and EB009715) and National Science Foundation grants (Grant Nos. CAREER 0546113 and CBET 1135068).
References
- Wu X. and Liu H., “Clinical implementation of x-ray phase-contrast imaging: Theoretical foundations and design considerations,” Med. Phys. 30, 2169–2179 (2003). 10.1118/1.1593836 [DOI] [PubMed] [Google Scholar]
- Arfelli F., Bonvicini V., Bravin A., Cantatore G., Castelli E., Palma L. D., Michiel M. D., Fabrizioli M., Longo R., Menk R. H., Olivo A., Pani S., Pontoni D., Poropat P., Prest M., Rashevsky A., Ratti M., Rigon L., Tromba G., Vacchi A., Vallazza E., and Zanconati F., “Mammography with synchrotron radiation: Phase-detection techniques,” Radiology 215, 286–293 (2000). [DOI] [PubMed] [Google Scholar]
- Gabor D., “A new microscopic principle,” Nature (London) 4098, 777–778 (1948). 10.1038/161777a0 [DOI] [PubMed] [Google Scholar]
- Ingal V. N., Beliaevskaya E. A., Brianskaya A. P., and Merkurieva R. D., “Phase mammography-a new technique for breast investigation,” Phys. Med. Biol. 43, 2555–2567 (1998). 10.1088/0031-9155/43/9/009 [DOI] [PubMed] [Google Scholar]
- Tanaka T., Honda C., Matsuo S., Noma K., Oohara H., Nitta N., Ota S., Tsuchiya K., Sakashita Y., Yamada A., Yamasaki M., Furukawa A., Takahashi M., and Murata K., “The first trial of phase contrast imaging for digital full-field mammography using a practical molybdenum X-ray tube,” Invest. Radiol. 40, 385–396 (2005). 10.1097/01.rli.0000165575.43381.48 [DOI] [PubMed] [Google Scholar]
- Donnelly E. F., Price R. R., and Pickens D. R., “Quantification of the effect of system and object parameters on edge enhancement in phase-contrast radiography,” Med. Phys. 30, 2888–2896 (2003). 10.1118/1.1617430 [DOI] [PubMed] [Google Scholar]
- Gureyev T. E., Nesterets Y. I., Stevenson A. W., Miller P. R., Pogany A., and Wilkins S. W., “Some simple rules for contrast, signal-to-noise and resolution in in-line x-ray phase-contrast imaging,” Opt. Express 16, 3223–3241 (2008). 10.1364/OE.16.003223 [DOI] [PubMed] [Google Scholar]
- Matsuo S., Katafuchi T., Tohyama K., Morishita J., Yamada K., and Fujita H., “Evaluation of edge effect due to phase contrast imaging for mammography,” Med. Phys. 32, 2690–2697 (2005). 10.1118/1.1992087 [DOI] [PubMed] [Google Scholar]
- Nesterets Y. I., Wilkins S. W., Gureyev T. E., Pogany A., and Stevenson A. W., “On the optimization of experimental parameters for x-ray in-line phase-contrast imaging,” Rev. Sci. Instrum. 76, 093706 (2005). 10.1063/1.2038107 [DOI] [Google Scholar]
- Pogany A., Gao D., and Wilkins S. W., “Contrast and resolution in imaging with a microfocus x-ray source,” Rev. Sci. Instrum. 68, 2774–2782 (1997). 10.1063/1.1148194 [DOI] [Google Scholar]
- Wu X., Liu H., and Yan A., “Optimization of X-ray phase-contrast imaging based on in-line holography,” Nucl. Instr. Meth. Phys. Res. B 234, 563–572 (2005). 10.1016/j.nimb.2005.02.015 [DOI] [Google Scholar]
- Yamazaki A., Ichikawa K., and Kodera Y., “Investigation of physical image characteristics and phenomenon of edge enhancement by phase contrast using equipment typical for mammography,” Med. Phys. 35, 5134–5150 (2008). 10.1118/1.2968091 [DOI] [PubMed] [Google Scholar]
- Anastasio M. A., Chou C.-Y., Zysk A. M., and Brankov J. G., “Analysis of ideal observer signal detectability in phase-contrast imaging employing linear shift-invariant optical systems,” J. Opt. Soc. Am. A 27, 2648–2659 (2010). 10.1364/JOSAA.27.002648 [DOI] [PMC free article] [PubMed] [Google Scholar]
- Rolland J. P. and Barrett H. H., “Effect of random background inhomogeneity on observer detection performance,” J. Opt. Soc. Am. A 9, 649–658 (1992). 10.1364/JOSAA.9.000649 [DOI] [PubMed] [Google Scholar]
- Bochud F. O., Abbey C. K., and Eckstein M. P., “Statistical texture synthesis of mammographic images with clustered lumpy backgrounds,” Opt. Express 4, 33–43 (1999). 10.1364/OE.4.000033 [DOI] [PubMed] [Google Scholar]
- Castella C., Kinkel K., Descombes F., Eckstein M. P., Sottas P.-E., Vercun F. R., and Bochud F. O., “Mammographic texture synthesis: Second-generation clustered lumpy backgrounds using a genetic algorithm,” Opt. Express 16, 7595–7607 (2008). 10.1364/OE.16.007595 [DOI] [PubMed] [Google Scholar]
- Hammerstein G. R., Miller D. W., White D. R., Masterson M. E., Woodard H. Q., and Laughlin J. S., “Absorbed radiation dose in mammography,” Radiology 130, 485–491 (1979). [DOI] [PubMed] [Google Scholar]
- International Commission on Radiological Protection, Report of the Task Group on Reference Man, Report No. 23 (Pergamon, Oxford, 1975). [Google Scholar]
- Maughan R. L., Chuba P. J., Porter A. T., Ben-Josef E., and Lucas D. L., “The elemental composition of tumors: Kerma data for neutrons,” Med. Phys. 24, 1241–1244 (1997). 10.1118/1.598144 [DOI] [PubMed] [Google Scholar]
- Othman I., Spyrou N. M., Price J. L., and Gibbs N. M., Ultrastructure and Composition of Breast Calcification Using Electron Microscopy and Microprobe Analysis Euroanalysis III, edited by Carroll D.M. (Applied Science Publishers Ltd., London, 1979). [Google Scholar]
- Poletti M. E., Gonçalves O. D., and Mazzaro I., “X-ray scattering from human breast tissues and breast-equivalent materials,” Phys. Med. Biol. 47 47–63 (2002). 10.1088/0031-9155/47/1/304 [DOI] [PubMed] [Google Scholar]
- Johns P. C. and Yaffe M. J., “X-ray characterization of normal and neoplastic breast tissues,” Phys. Med. Biol. 32, 675–695 (1987). 10.1088/0031-9155/32/6/002 [DOI] [PubMed] [Google Scholar]
- Berger M. J., Hubbell J., and Seltzer S. M., “XCOM: photon cross section database NIST Standard Reference Database 8,” (1999).
- James R. W., The Optical Principles of the Diffraction of X-Rays (Ox Bow Press, Woodbridge, CT, 1962). [Google Scholar]
- Goodman J. W., Introduction to Fourier Optics (McGraw-Hill, New York, 1996). [Google Scholar]
- Cranley K., Gilmore B. J., Fogarty G. W. A., and Desponds L., “Catalogue of Diagnostic X-ray Spectra and Other Data,” IPEM Report 78 (The Institute of Physics and Engineering in Medicine, York, United Kingdom, 1997). [Google Scholar]
- Boone J. M., “Glandular breast dose for monoenergetic and high-energy x-ray beams: Monte Carlo assessment,” Radiology 213, 23–37 (1999). [DOI] [PubMed] [Google Scholar]
- Barrett H. H. and Myers K. J., “Statistical characterization of radiological images: Basic principles and recent progress,” Proc. SPIE 6510, 651002 (2007). 10.1117/12.716908 [DOI] [PMC free article] [PubMed] [Google Scholar]
- Barrett H. H. and Myers K. J., Foundations of Image Science (Wiley, Hoboken, NJ, 2004). [Google Scholar]
- Baydush A. H., Catarious D. M., Abbey C. K., and Floyd C. E., “Computer aided detection of masses in mammography using subregion Hotelling observers,” Med. Phys. 30, 1781–1787 (2003). 10.1118/1.1582011 [DOI] [PubMed] [Google Scholar]
- Morita T., Yamada M., Kano A., Nagatsuka S., Honda C., and Endo T., “A comparison between film-screen mammography and full-field digital mammography utilizing phase contrast technology in breast cancer screening programs,” Lect. Notes Comput. Sci. 5116, 48–54 (2008). 10.1007/978-3-540-70538-3_7 [DOI] [Google Scholar]
- Boone J. M. and Seibert J. A., “An analytical model of the scattered radiation distribution in diagnostic radiology,” Med. Phys. 15, 721–725 (1988). 10.1118/1.596186 [DOI] [PubMed] [Google Scholar]


