Figure 1.

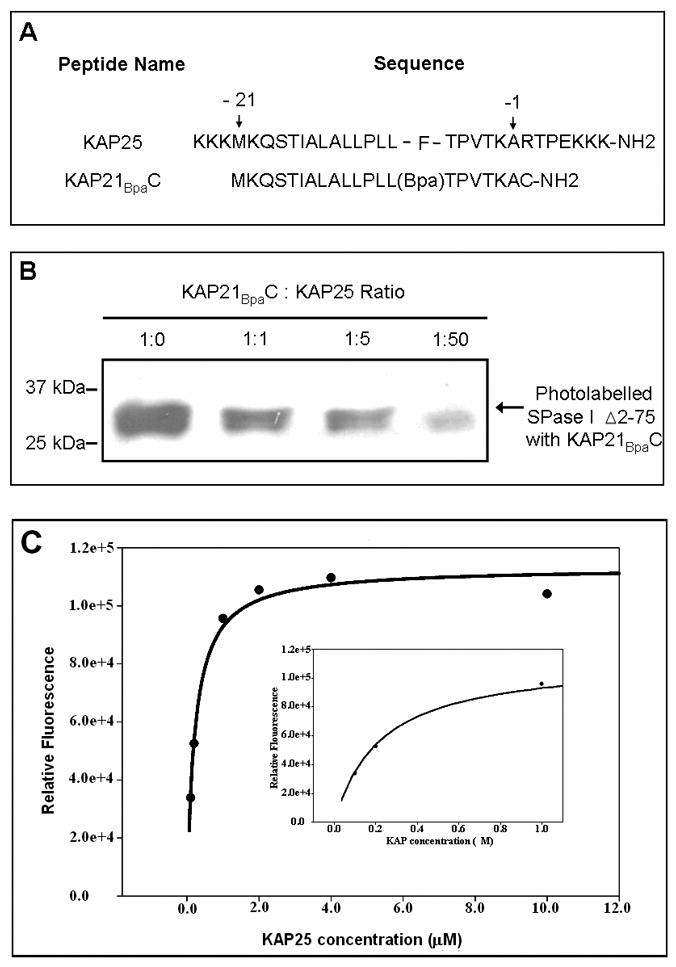
(A) The amino acid sequences of the KAP25 and KAP21BpaC peptides. Residues -21 and -1 mark the first and last residue of the alkaline phosphatase signal peptide, respectively (using the classical numbering scheme for the signal peptide region). For the KAP25 peptide, four residues of the mature protein (RTPE) are also included. (B) Western blot of the SPase I Δ2-75 photolabeled with the biotinylated KA21BpaC. SPase I Δ2-75 at 6.4 μM, was incubated with KAP21BpaC at 6.4μM in the presence and absence of increasing concentrations of KAP25. A decrease in the intensity of the photolabeled enzyme band is observed with an increase in KAP25 concentration. 25kDa and 37kDa molecular weight markers are shown for reference. (C) Intensity of 0.2 μM SPase I Δ2-75 tryptophan emission at 338 nm upon titration with KAP25 after subtraction of the control (0.2 μM SPase I Δ2-75 in the absence of peptide). Inset provides a higher scale resolution between 0 and 1 μM of KAP25.
