Abstract
Electron transfer dissociation (ETD) has improved the mass spectrometric analysis of proteins and peptides with labile post-translational modifications and larger intact masses. Here, the parameters governing the reaction rate of ETD are examined experimentally. Currently, due to reagent injection and isolation events as well as longer reaction times, ETD spectra require significantly more time to acquire than collision-induced dissociation (CID) spectra (>100 ms), resulting in a trade-off in the dynamic range of tandem MS analyses when ETD-based methods are compared to CID-based methods. Through fine adjustment of reaction parameters and the selection of reagents with optimal characteristics, we demonstrate a drastic reduction in the time taken per ETD event. In fact, ETD can be performed with optimal efficiency in nearly the same time as CID at low precursor charge state (z = +3) and becomes faster at higher charge state (z > +3).
Keywords: Electron Transfer Dissociation, Quadrupole Linear Trap, Linear Trapping Quadrupole, Azulene, Fluoranthene
Introduction
Since its inception1, the application of mass spectrometry to the analysis of complex biological samples has proven to be remarkably successful. As the field of proteomic mass spectrometry has grown, it has been met with the challenge of increasingly complex mixtures1, 2. Providing the analytical power necessary to tackle these mixtures, advances made in fragmentation techniques3–6 as well as in instrument scanning speed, sensitivity, and resolution7–12 have enabled proteomics to render increasingly detailed views of biological systems.
The introduction of electron transfer dissociation (ETD) gave proteomicists a powerful tool to complement and, for some applications, to replace traditional vibrational fragmentation techniques. ETD is now becoming a widespread and powerful tool for the analysis of biological samples13. Its ability to provide efficient fragmentation while preserving post-translational modifications (PTMs) makes it ideally suited to the task of PTM site identification and sequence elucidation14. Despite these advantages, ETD still suffers a deficit to collision-induced dissociation (CID). With current ETD reagents and instrumentation, the scan times required to provide optimal fragmentation via ETD are nearly twice that of CID, resulting in a theoretical reduction in dynamic range in the context of LC-MS by nearly a factor of two.
The parameters governing the rate of ion/ion reactions have been investigated previously by McLuckey and coworkers15, 16. The most crucial parameters identified in this work include the reagent and precursor ion populations, the reagent m/z, and the Mathieu q at which the reagent is held during reaction (ion/ion q). The ion/ion q, and therefore the RF level applied to the trap during reaction, plays a major role in determining the rate of reaction as well as the range of masses trapped following reaction. It has been shown that as ion/ion q is increased, the average spatial distributions of ion clouds are reduced and their number densities are correspondingly increased17, 18. Since ETD reactions are of pseudo-first order15, the initial concentrations, or number densities, of these two ion clouds as well as their spatial overlap affect reaction rates. Finally, utilizing ETD reagents with optimized m/z values that react exclusively via ETD may also improve the speed and quality of ETD spectra.
Despite the increasing popularity of ETD, reaction times are still chosen via an empirical approach. Reaction times determined in this fashion may be longer than necessary, resulting in reduced fragment ion current, reduced signal to noise and increased scan times. With a constant ion/ion q and target values, reaction time alone determines the extent of reaction and thus, the visual appearance of resulting spectra. It is possible that reaction times that yield adequate spectra for database retrieval are shorter than those typically used, resulting in additional savings in scan time.
Here we demonstrate that the rate of the ETD reaction can be increased through the adjustment of ion/ion q, reagent target value, and the use of appropriate reagent species. In combination with these parameters, the optimization of ETD reaction times can drastically reduce the disparity in acquisition speed between ETD and CID scan events.
Materials and Methods
ETD Reagents
Azulene, fluoranthene and azobenzene where purchased from Aldrich at 99% purity. 2,2′-biquinoline was purchased at >99% purity from Fluka. All reagents were used without further purification. The vial heater was adjusted to facilitate <2 ms injection times (2×10⁵ charges) for each reagent.
Samples
Angiotensin I acetate hydrate (human) and vasoactive intestinal peptide (1–12) (human, porcine, rat) were purchased from Sigma-Aldrich at >99% purity. Solutions at a concentration of 1 pmol/μL were made in 40% acetonitrile (Mallinckrodt Chemicals) with 0.1% acetic acid (Sigma-Aldrich) for direct infusion. A solution of angiotensin I and vasoactive peptide at a concentration 500 fmol/μL in 0.1% acetic acid was used for chromatographic experiments. Further chromatographic experiments utilized a lys-C digestion of 100 pmol of bovine serum albumin (BSA) (Sigma-Aldrich) in 0.1% acetic acid.
Chromatography
Samples were bomb loaded onto a pre-column packed with 3 μm C18 resin. The pre-column was then connected to an analytical column (packed to 6 cm with the same resin) with integrated emitter (Sutter Instruments P-2000) and eluted at a flow rate of 60 nL/min with the following gradient: 0–60 %B in 60 min, 60–100 %B in 3 min, hold at 100 %B for 4 min.
Mass Spectrometry
All experiments were performed utilizing a Thermo Fisher Scientific LTQ Orbitrap mass spectrometer modified to enable ion/ion reactions with a front-end ETD ion source. Data collection was automated via the use of Thermo Fisher Scientific’s proprietary Ion Trap Control Language (ITCL). Waveform isolation was used to eliminate any impurities in the reagent ion spectrum.
Results and Discussion
Parametric Resonance
When performing an ETD scan event in a linear ion trap, a radio-frequency (RF) potential is applied to the end lenses of the linear trap or the RF applied to matched rod sets is unbalanced to provide charge-sign independent trapping (CSIT)4, 16. While this step successfully confines positive and negative ions in an axial pseudopotential simultaneously, it comes at a price. The interaction of the lens RF, operated at a frequency around one half that of the main linear ion trap RF, results in a parametric resonance19 that is capable of ion ejection. Prior to optimizing the parameters governing ETD reaction rates, the location of this resonance must be known to avoid experimental artifacts.
To identify the location of this resonance, ETD reactions were performed on angiotensin I with the reagent ion maintained at various ion/ion q values while monitoring the fragment ion current, precursor area and reduced charge species area. A limited reaction time of 20 ms was used to ensure that the precursor would not be totally depleted at any q. The low mass cutoff (LMCO) was calculated based on the highest ion/ion q sampled and the scan range was adjusted appropriately to eliminate any potential artifacts due to a moving LMCO.
An abnormality between a q of 0.6 and 0.7 was detected (Supporting Figure 1). Here, the precursor ion current returned to its maximal value, indicating that no reaction was occurring. The parametric resonance in this region ejected the reagent ion and prevented any reaction via ETD. Thus, for this work, the range where ion/ion q > 0.55 will not be examined.
Reaction rate
Investigation of the effect of ion/ion q, reagent m/z, and target values on ETD reactions requires the determination of reaction rates. Reactions occurring in an ion trap are dependent on the local ion densities of the reactants in the region in which they overlap. Necessarily then, a distinction between a general excess and a local excess of a reactant present in the ion trap must be made. While a large precursor ion number and small reagent ion number would be viewed as a general excess of the precursor, a local excess of reagent is still possible. Locally, where the ion clouds overlap, there may exist a region in which the reagent is more concentrated than the precursor due to two factors: 1.) The precursor always has a higher charge state, resulting in a lower ion density and 2.) The reagent is typically of lower m/z than the precursor, resulting in a higher density (smaller volume) when compared to the precursor. These combined effects result in pseudo-first order conditions for which one may write:
| (1) |
where [Cation] and [Anion] are the gas phase “concentrations” or, more accurately, number densities of the two reactants. k′ is the pseudo-first order rate constant where:
| (2) |
with units of s−1. In this case, a meaningful value for the initial number density of the anion (and cation) is difficult to define. Since the ion density is directly related to ion/ion q, holding this parameter constant within experiments ensures pseudo-first order kinetics are observed. Pseudo-first order rate constants determined in this way provide an accurate relative measurement of reaction rate for the following experiments and will be used throughout but have an arbitrary unit.
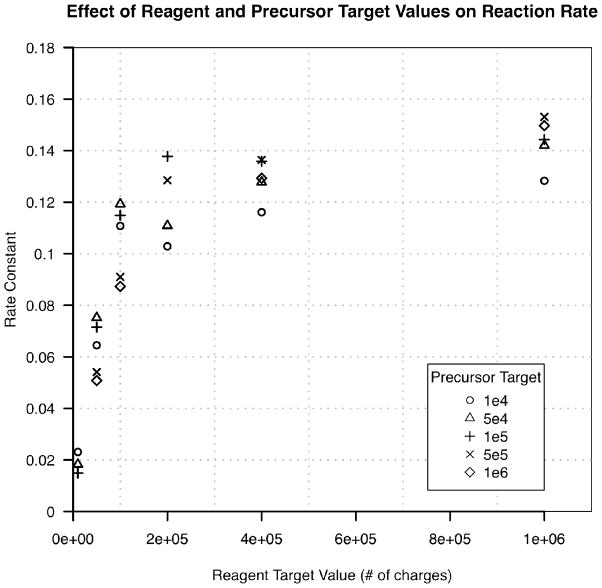
The rate of the ETD reaction as a function of reagent and precursor target values was evaluated in the context of the above reaction kinetics. Vasoactive intestinal peptide was directly infused and the +3 charge state selected for ETD fragmentation via reaction with fluoranthene at an ion/ion q of 0.55. Figure 1 demonstrates a rapid increase in reaction rate until a reagent target value of ~2×10⁵ charges. Past this point, little is gained in reaction rate by increased target values, indicating that the ion trap is becoming saturated at ~2×10⁵ reagent charges. Because the reagent ion is lower in m/z than the precursor, it resides at a higher q, making its spatial distribution smaller than that of the precursor18. Therefore, changes to the reagent target value have a much greater impact on the density of the reagent cloud than the addition of an equivalent number of charges to the precursor cloud. In figure 1, the large change in reaction rate as a function of reagent target value for any precursor target value may result from this more rapid change in density. One would also predict a relatively minor increase in reaction rate when moving from low to high precursor target values (for a constant reagent target) as this much larger ion cloud would gain density. However, these data are too noise to reliably demonstrate this trend. Regardless, these data demonstrate that a target value of 2×10⁵ for the reagent represents the best balance between reaction rate and reagent injection time for any precursor target value (in the range sampled).
Figure 1.
The ETD reaction rate for various precursor and reagent target values. At high precursor target values, rate constants for the lowest reagent target value could not be obtained because the change in precursor intensity was on the order of scan-to-scan variation.
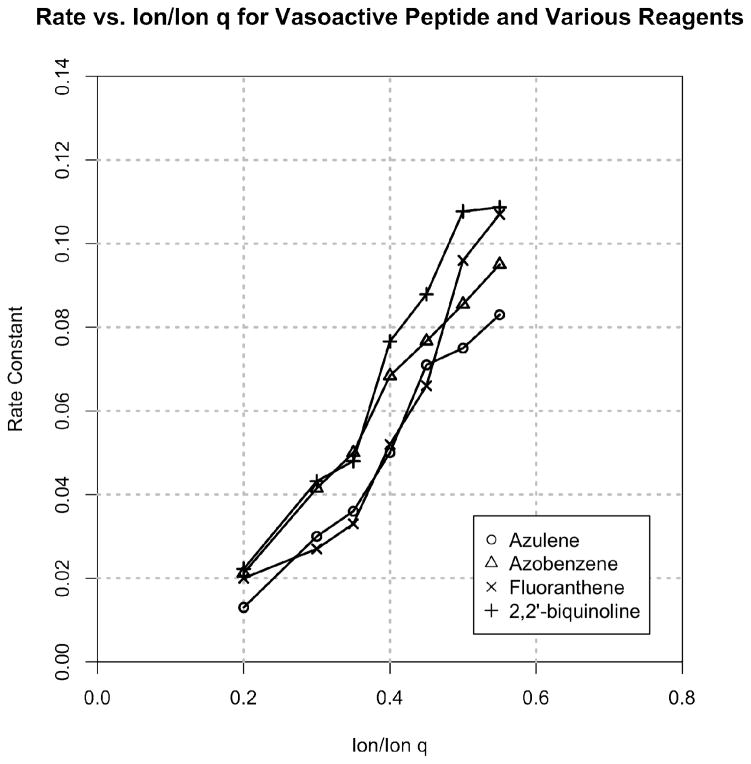
The rate of reaction as a function of reagent m/z and ion/ion q was subsequently examined. Here, multiple different reagents were reacted at various ion/ion q values (Azulene, 128 amu; Azobenzene, 182 amu; Fluoranthene, 202 amu; 2,2′-biquinoline, 256 amu). Figure 2 indicates that all of the reagents assayed demonstrated optimized reaction rates at approximately the same ion/ion q of q = 0.55. Since the reagents used here are −1 ions, they will have the same number density when at equivalent q values, resulting in similar reaction rates for differing reagent m/z’s.
Figure 2.
Rate constant as a function of ion/ion q for vasoactive peptide reacted with various reagents.
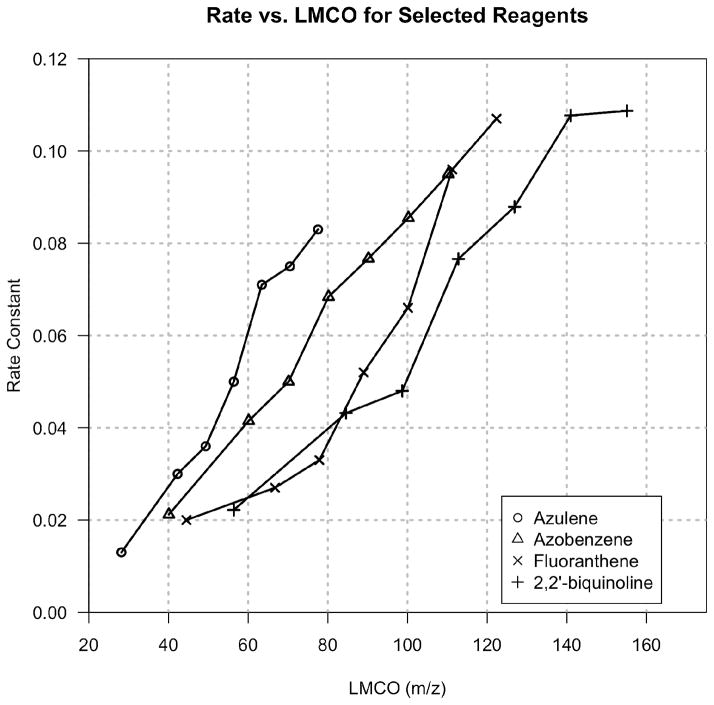
Considering, with the current instrumental setup, that all reagents react optimally at approximately q = 0.55, thought must be given to the requirements placed on reagents by this condition. To maintain an arbitrary low mass cutoff (LMCO) of m/z 90 when using a precursor of m/z 202 (fluoranthene), the ion/ion q must be ~0.4. Utilizing heavier reagents only exacerbates this problem by requiring an even lower ion/ion q to maintain an acceptable LMCO. Conversely, moving to lower m/z reagents provides the benefits of reacting at a higher ion/ion q, and therefore achieving a higher rate, while maintaining an acceptable LMCO. For example, azulene (m/z 128), reacted at a q of 0.55, provides an LMCO of m/z 80 while nearly doubling the reaction rate when compared to the previous example of fluoranthene, as evidenced in Figure 3.
Figure 3.
Rate constant as a function of low mass cutoff for vasoactive peptide reacted with various reagents.
Reagent partitioning between ETD and PTR
During an ETD reaction, several outcomes may result that are dependent on the properties of the reactants20, 21. In the simplest case, the reagent would transfer an electron to the precursor, causing it to fragment and dissociate. However, all ETD reagents have some capacity to perform proton transfer reaction (PTR)15, during which a proton is abstracted from the precursor by the reagent22. Further, the transfer of an electron can result, instead of backbone fragmentation, in the ejection of a hydrogen radical or a neutral loss from the precursor. Finally, multiple reactions may occur with the same precursor in various combinations. All of these pathways operating in concert render a precise determination of the efficiency of a reagent difficult. However, a relative, semi-quantitative metric can still be useful in displaying the properties of reagents.
In order to sample a range of reagent m/z values, several potential ETD reagents were used for the previous experiments. To evaluate these reagents for ETD activity, high-resolution spectra were acquired for each species reacted with the two standard peptides. The standards were chosen to provide dominant +3 peaks and have intact masses lower than 2 kDa to assure all product ions were within the detected mass range and that the ETD reaction proceeded efficiently. The spectra were acquired in the Orbitrap mass analyzer following reaction in the linear ion trap with a precursor target of 1×10⁶ and a reagent target of 2×10⁵. The reaction time was adjusted to reduce the precursor intensity to 20–30% of its original intensity.
Using the isotopic distribution of the precursor, the contributions to the reduced charge species from PTR/hydrogen detachment and electron transfer without dissociation could be deconvoluted, allowing calculation of % ETD and % PTR. In an automated fashion, a program written to perform this task provided efficient and reliable assessments of % PTR for many spectra, allowing averaging. The average % PTR for each reagent was calculated by summing the contributions to the reduced charge species via PTR/hydrogen detachment events and subsequently dividing by the total ion current. No consideration was given to neutral loss species and fragment ions were assumed to undergo no further reaction following formation. Table 1 displays the resulting average % PTR values for the range of reagents reacted with the standard precursors. Fluoranthene, azulene and 2,2′-biquinoline perform similarly. Performing considerably more PTR is azobenzene.
Table 1.
| Reagent | Vasoactive Peptide | Angiotensin I |
|---|---|---|
| Fluoranthene | 11.95 | 12.72 |
| Azulene | 10.39 | 12.87 |
| Azobenzene | 31.38 | 33.55 |
| Biquinoline | 11.02 | 10.38 |
The physical properties of these reagents also affect their utility as ETD reagents. Azulene sublimes very easily at STP and provides reagent signals that facilitate reagent injection times that are less than 2 ms without the need for heaters, simplifying instrument design requirements. Further, in the context of ETD, a high vapor pressure prevents accumulation of vaporized reagent on the cold surfaces of ion optics within the mass spectrometer. Therefore, azulene is the most desirable reagent assessed in this work due to its beneficial physical properties combined with the increased ETD reaction rate that it provides.
Optimized reaction times
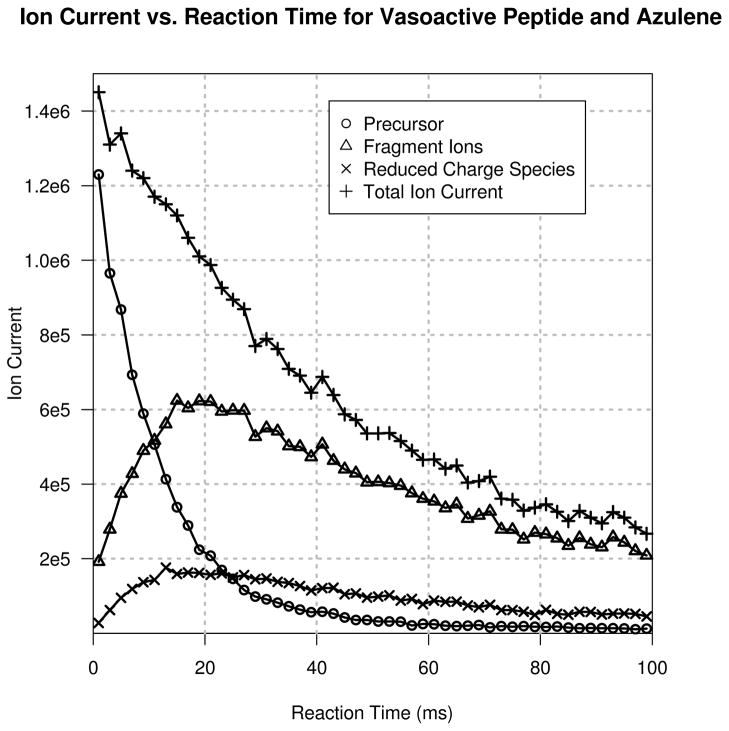
Leveraging the optimized parameters above, the effect of reaction time on the quality of ETD data produced was investigated. Figure 4 displays the plot of the reaction time course for azulene reacted with vasoactive peptide. The fragment ion current finds its maximum between 15–20 ms reaction time, a drastic reduction in comparison to reaction times commonly found in the literature: anywhere from 60–150 ms. Importantly, at any reaction time, the ratio of the fragment ions to the reduced charge species as a function of reaction time is constant. Therefore, extending the reaction time does not yield increased conversion of reduced charge species into fragment ions to any appreciable extent (at least in the case of +3 precursors).
Figure 4.
Various ion currents plotted as a function of reaction time for vasoactive intestinal peptide reacted with azulene at q = 0.55.
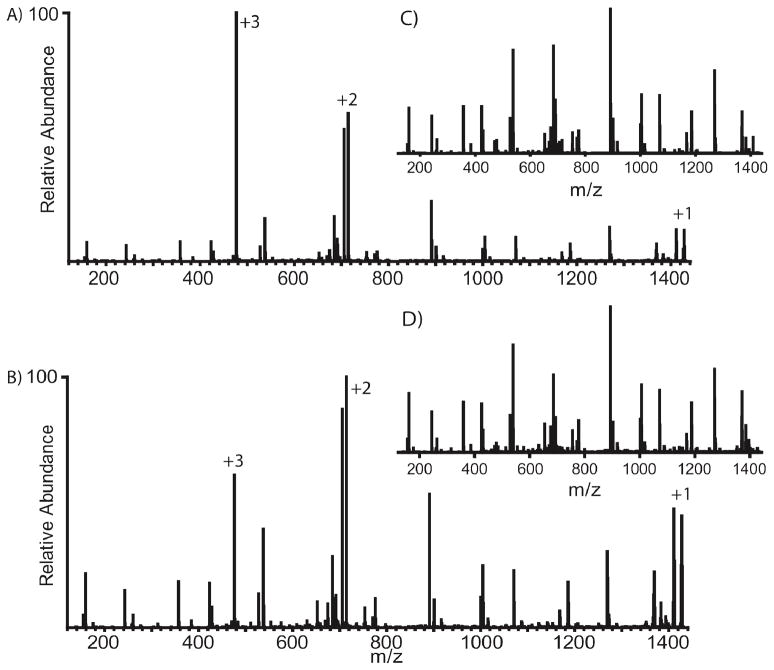
Spectra generated at these very short reaction times appear very different than those acquired at longer reaction times. Figure 5 displays vasoactive peptide reacted with azulene at optimal parameters (A) and at a slightly longer reaction time (B). The first spectrum represents the maximal product ion current achievable but the fragment ions do not represent the majority of the total ion current. The second spectrum displays reduced fragment ion current, most likely due to charge reduction either through additional ETD reactions or PTR, but the fragment ion current represents the majority of the total ion current. Thus, the second spectrum looks more pleasing to the eye but may not provide the highest quality data.
Figure 5.
ETD spectra of vasoactive peptide acquired under optimized conditions using A) 20 ms and B) 35 ms reaction times. These spectra were acquired back-to-back in a single LC-MS run. Insets C) and D) are spectra A) and B) following programmatic removal of the precursor and reduced charge species. The spectrum C) maintains a total ion current of 1.44×10⁷ while spectrum D) is reduced to 7.65×10⁶.
Following removal of the remaining precursor and reduced charge series (C and D), the spectra qualitatively look very similar. Further, the total ion current remaining following an optimized reaction time of 20 ms is higher than that of the longer reaction time by a factor of 2. Again, this can provide significant reductions in single scan times for ETD events.
To verify that these short reaction times generate high quality data, 5 pmol of a Lys-C digest of BSA was run with default settings of 100 ms reaction time at q = 0.40 and again with settings of 20 ms reaction time at q = 0.55 (rejecting +1 and +2 ions and using dynamic exclusion: repeat count, 3; repeat duration, 15; list size, 50; exclusion duration, 20). The resulting files were then searched with OMSSA against a single protein database following a Lys-C digestion. Each file was searched with the reduced charge species and precursor and again following their removal. The removal of the reduced charge species and precursor is an optional parameter in OMSSA. The results follow:
Following the removal of reduced charge species, the shorter reaction time affords similar sequence coverage to the run performed with default parameters, indicating that shorter reaction times provide high quality data when applied to the analysis of peptides.
Conclusions
Optimizing the parameters affecting the rate of an ETD reaction led to substantial improvements in scan speed. Investigations of reaction rates as a function of precursor and reagent target values not only provided insight into how ion clouds overlap during reaction, but also minimized scan time through optimized reagent target values. Investigating the effect of reagent mass as well as ion/ion q led to further savings in scan time. Implementing these optimized parameters, it was found that ETD data may be acquired with scan times equivalent to CID scans. Finally, azulene, due to its low m/z, high vapor pressure, and high % ETD make it the ideal ETD reagent.
Supplementary Material
Table 2.
| ion/ion q | % Sequence Coverage | |
|---|---|---|
| Regular | −RCS | |
| 0.4 | 75.29 | 80.56 |
| 0.55 | 67.22 | 82.04 |
Acknowledgments
The authors would like to thank John E. P. Syka for informative discussions and recognize Thermo Fisher Scientific as well as the National Institutes of Health (GM 037537 and AI 33993) for their support of this work.
References
- 1.Hunt DF, Yates JR, Shabanowitz J, Winston S, Hauer CR. Proc Natl Acad Sci U S A. 1986;83:6233–6237. doi: 10.1073/pnas.83.17.6233. [DOI] [PMC free article] [PubMed] [Google Scholar]
- 2.Thakur SS, Geiger T, Chatterjee B, Bandilla P, Froehlich F, Cox J, Mann M. Mol Cell Proteomics. doi: 10.1074/mcp.M110.003699. [DOI] [PMC free article] [PubMed] [Google Scholar]
- 3.Mabud MDA, Dekrey MJ, Cooks RG. International Journal of Mass Spectrometry and Ion Processes. 1985;67:285–294. [Google Scholar]
- 4.Syka JE, Coon JJ, Schroeder MJ, Shabanowitz J, Hunt DF. Proc Natl Acad Sci U S A. 2004;101:9528–9533. doi: 10.1073/pnas.0402700101. [DOI] [PMC free article] [PubMed] [Google Scholar]
- 5.Zubarev RA, Kelleher NL, McLafferty FW. J Am Chem Soc. 1998;120:3265–3266. [Google Scholar]
- 6.Coon JJ, Ueberheide B, Syka JE, Dryhurst DD, Ausio J, Shabanowitz J, Hunt DF. Proc Natl Acad Sci U S A. 2005;102:9463–9468. doi: 10.1073/pnas.0503189102. [DOI] [PMC free article] [PubMed] [Google Scholar]
- 7.Boldin IA, Nikolaev EN. Rapid Commun Mass Spectrom. 25:122–126. doi: 10.1002/rcm.4838. [DOI] [PubMed] [Google Scholar]
- 8.Londry FA, Hager JW. J Am Soc Mass Spectrom. 2003;14:1130–1147. doi: 10.1016/S1044-0305(03)00446-X. [DOI] [PubMed] [Google Scholar]
- 9.Makarov A, Denisov E, Kholomeev A, Balschun W, Lange O, Strupat K, Horning S. Anal Chem. 2006;78:2113–2120. doi: 10.1021/ac0518811. [DOI] [PubMed] [Google Scholar]
- 10.Makarov A, Denisov E, Lange O. J Am Soc Mass Spectrom. 2009;20:1391–1396. doi: 10.1016/j.jasms.2009.01.005. [DOI] [PubMed] [Google Scholar]
- 11.Olsen JV, Schwartz JC, Griep-Raming J, Nielsen ML, Damoc E, Denisov E, Lange O, Remes P, Taylor D, Splendore M, Wouters ER, Senko M, Makarov A, Mann M, Horning S. Mol Cell Proteomics. 2009;8:2759–2769. doi: 10.1074/mcp.M900375-MCP200. [DOI] [PMC free article] [PubMed] [Google Scholar]
- 12.Syka JE, Marto JA, Bai DL, Horning S, Senko MW, Schwartz JC, Ueberheide B, Garcia B, Busby S, Muratore T, Shabanowitz J, Hunt DF. J Proteome Res. 2004;3:621–626. doi: 10.1021/pr0499794. [DOI] [PubMed] [Google Scholar]
- 13.Mikesh LM, Ueberheide B, Chi A, Coon JJ, Syka JE, Shabanowitz J, Hunt DF. Biochim Biophys Acta. 2006;1764:1811–1822. doi: 10.1016/j.bbapap.2006.10.003. [DOI] [PMC free article] [PubMed] [Google Scholar]
- 14.Udeshi ND, Compton PD, Shabanowitz J, Hunt DF, Rose KL. Nat Protoc. 2008;3:1709–1717. doi: 10.1038/nprot.2008.159. [DOI] [PMC free article] [PubMed] [Google Scholar]
- 15.McLuckey SA, Stephenson JL, Jr, Asano KG. Anal Chem. 1998;70:1198–1202. doi: 10.1021/ac9710137. [DOI] [PubMed] [Google Scholar]
- 16.Xia Y, Wu J, McLuckey SA, Londry FA, Hager JW. J Am Soc Mass Spectrom. 2005;16:71–81. doi: 10.1016/j.jasms.2004.09.017. [DOI] [PubMed] [Google Scholar]
- 17.Tolmachev AV, Udseth HR, Smith RD. Rapid Commun Mass Spectrom. 2000;14:1907–1913. doi: 10.1002/1097-0231(20001030)14:20<1907::AID-RCM111>3.0.CO;2-M. [DOI] [PubMed] [Google Scholar]
- 18.Todd JFJ, Waldren RM, Freer DA, Turner RB. International Journal of Mass Spectrometry and Ion Physics. 1980:107–150. [Google Scholar]
- 19.March RE, McMahon AW, Allinson ET, Londry FA, Alfred RL, Todd JFJ, Vedel F. International Journal of Mass Spectrometry and Ion Processes. 1990;99:109–124. [Google Scholar]
- 20.Coon JJ, Syka JEP, Schwartz JC, Shabanowitz J, Hunt DF. International Journal of Mass Spectrometry. 2004;236:33–42. [Google Scholar]
- 21.Gunawardena HP, He M, Chrisman PA, Pitteri SJ, Hogan JM, Hodges BD, McLuckey SA. J Am Chem Soc. 2005;127:12627–12639. doi: 10.1021/ja0526057. [DOI] [PMC free article] [PubMed] [Google Scholar]
- 22.Herron WJ, Goeringer DE, McLuckey SA. Anal Chem. 1996;68:257–262. doi: 10.1021/ac950895b. [DOI] [PubMed] [Google Scholar]
Associated Data
This section collects any data citations, data availability statements, or supplementary materials included in this article.


