Abstract
We report the implementation of front-end higher energy collision induced dissociation (fHCD) on a bench-top dual pressure linear ion trap. Software and hardware modifications were employed, described in detail vide-infra, to allow isolated ions to undergo collisions with ambient gas molecules in an intermediate multipole (q00) of the instrument. Results comparing the performance of fHCD and resonance excitation collision induced dissociation (RE-CID) in terms of injection time, total number of scans, efficiency, mass measurement accuracy (MMA), unique peptide identifications, and spectral quality of labile modified peptides are presented. fHCD is approximately 23% as efficient as RE-CID and, depending on the search algorithm, it identifies 6.6% more or 15% less peptides (q<0.01) from a soluble whole-cell lysate (Caenorhabditis elegans) than RE-CID using Mascot or Sequest search algorithms, respectively. fHCD offers a clear advantage for the analysis of phosphorylated and glycosylated (O-GlcNAc) peptides as the average cross-correlation score (XCorr) for spectra using fHCD was statistically greater (p<0.05) than for spectra collected using RE-CID.
Introduction
Continued advancements in instrumentation, sample preparation methodologies and bioinformatics1–2 have increased the utility of mass spectrometry to address complex biological questions in the last decade. On the instrumentation front, the field has witnessed significant improvements including the development of hybrid FT-MS instruments3–4, the introduction of the orbitrap mass analyzer5–6, and improvements in time-of-flight (TOF) technology7–8. These developments have led to unprecedented instrument performance in terms of resolving power, mass measurement accuracy, dynamic range, and duty cycle. In combination with these advancements, new dissociation techniques including electron capture dissociation9 (ECD) and electron transfer dissociation10 (ETD) continue to drive the field of proteomics forward. ECD and ETD offer complimentary sequence information to collision induced dissociation (CID) and thus are becoming more widely used. In addition, due to the nonergodic nature of ECD and ETD, they are often the preferred method for pinpointing sites of labile modifications (e.g., phosphorylation, O-GlcNAc) along the peptide backbone.
The traditional method for peptide fragmentation, CID11, is a slow heating technique12 that uses multiple gas collisions to increase internal energy through vibrational pathways to an ion specific threshold prior to uni-molecular dissociation. It is a common method to obtain structural information, possibly owing to its relative simplicity and high efficiency, and is employed on a range of mass spectrometry platforms in slightly different varieties. Traditionally, CID has been accomplished using beam-type or tandem in space instruments (e.g., Triple quadrupole, q-TOF) in which selected ions are accelerated into an elevated pressure cell and subjected to collisions with inert gas molecules. For quadrupole ion trap and FT-ICR instruments (i.e., tandem in time), CID is achieved through resonance excitation collision induced dissociation (RE-CID) or sustained off resonance irradiation collision induced dissociation (SORI-CID)13, respectively. SORI-CID has seen limited use in the field of shotgun proteomics – largely due to the development of hybrid instruments and lengthy pump down periods associated with the method which are not realistic on an LC-MS timescale. A disadvantage of RE-CID for proteomic applications is the inherent low mass cut off which is a consequence of the magnitude of the radio frequency voltage needed to retain the resonantly excited precursor and resulting fragments. In beam-type CID the low mass ions are retained for mass analysis and as a result this technique is directly amenable to isobaric tagging strategies (iTRAQ)14 for multiplexed relative quantification. In addition, due the tendency for multiple bond breakage in beam-type dissociation as opposed to single bond breakage in RE-CID, immonium ions are often present and can be utilized to obtain sequence information.15
Mann and coworkers described beam-type fragmentation on a hybrid ion trap orbitrap in the c-trap or dedicated octopole and referred to the method as higher energy collision-induced dissociation (HCD).16 The latter version of the instrument is now commercially available on the orbitrap line of instruments (Thermo Fisher, San Jose, CA). To the authors’ knowledge this was the first report of beam-type fragmentation on a trapping-type instrument; however, implementation of HCD on a benchtop trapping instrument would also be beneficial for similar reasons described vide supra – in addition to the lower cost associated with the purchase and operation of these instruments. Recently, Coon and coworkers reported HCD capabilities on a benchtop quadrupole linear ion trap17 (LTQ XL, Thermo Fisher Scientific, San Jose, CA). In this work the instrument software was modified to enable isolated ions to be sent back through the high pressure regions of the ion trap to q0, colliding with background ambient gas molecules, and then fragments were sent back to the ion trap for mass spectral analysis. This study focused on optimizing instrument parameters for HCD (e.g., offset voltages, ejection times and collision energies) and illustrated an increase in quantifiable peptides using trap HCD compared to other dissociation techniques in an iTRAQ experiment.
Herein, we describe the capability to perform front-end higher energy collision induced dissociation (fHCD, commercially called “Trap HCD”) on a bench top dual pressure linear ion trap (LTQ-Velos Pro, Thermo Fisher Scientific, San Jose, CA). It is important to distinguish the setup described herein with the one reported by Coon and coworkers. A design characteristic, inherent to the Velos ion trap instruments, prevents beam-type fragmentation in the q0 region of the instrument due to the inability to accelerate ions of appreciable energy through a curved quadrupole (i.e., q0). In our setup, isolated ions are sent back to q00 multipole downstream from the S-lens, for beam-type fragmentation and fragments are then mass analyzed by the ion trap. A distinct advantage of this setup is the small length of q00 (25 mm) versus q0 (85 mm) which affords approximately a 10-fold decrease in extraction time. Ultimately, this decrease in extraction time yields an overall increase in duty cycle. In addition, the instrument reported here is commercially available from ThermoFisher (as the LTQ-Velos Pro).
The manuscript is divided into three separate experiments: 1) Determination of the efficiency of fHCD in relation to RE-CID; 2) A detailed comparison of the performance of fHCD and RE-CID for shotgun proteomics in terms of unique peptide identifications, total number of scans, and mass measurement accuracy; and 3) A comparison between fHCD and RE-CID for the analysis of peptides with labile modifications.
Methods
Materials
Formic acid, ammonium bicarbonate, DTT, and iodoacetamide, were obtained from Sigma Aldrich (St. Louis, MO). Proteomics grade trypsin was purchased from Promega (Madison, WI). HPLC grade acetonitrile was from Burdick & Jackson (Muskegon, MI). A Caenorhabditis elegans lysate (soluble fraction) was prepared as previously reported18 and used to evaluate the different dissociation methods. The phosphopeptide standard was obtained from Protea Biosciences (Morgantown, WV) while the glycosylated (O-GlcNAc) peptide standard was from Invitrogen (Carlsbad, CA).
Nano-flow LC-MS
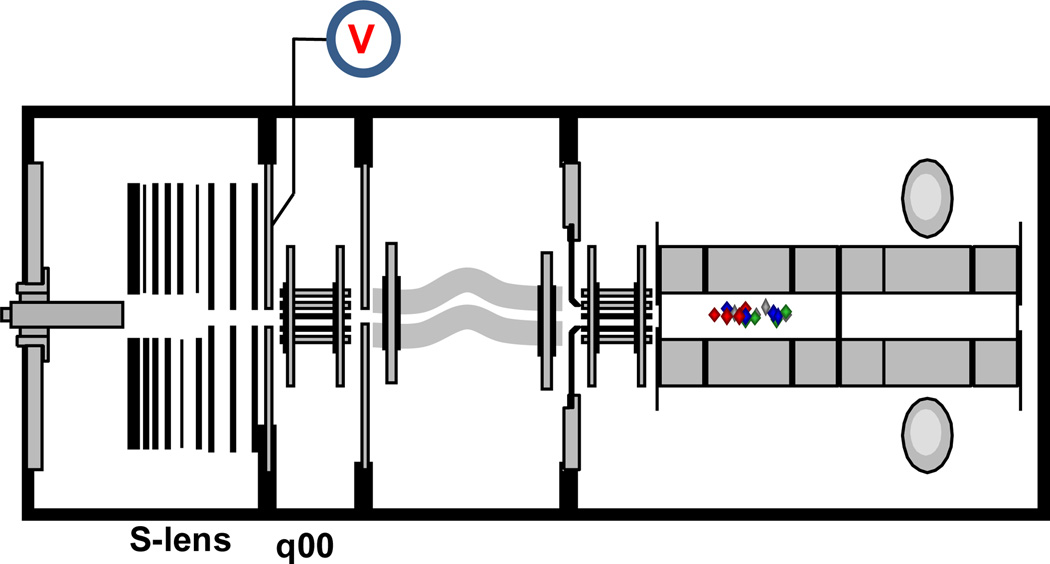
Nano-flow liquid chromatography was performed using an Agilent 1100 binary pump configured in a vented column design19. ESI columns were prepared as reported previously1 and then packed to a length of 25 cm with 4 µm C12 reverse phase particles (Phenomenex, Torrance, CA). A 90 min total LC-MS/MS analysis was performed using a gradient with the following time profile: 1) sample was loaded at 91% buffer A for 14 minutes; 2) a linear ramp from 9% to 38% buffer B over 55 minutes; 3) a linear ramp to 80% B over 1 minute; 4) held constant for 5 minutes (80% B) and 5) the column was re-equilibrated for 15 minutes at initial conditions (91% A). Solvents A and B were 95/4.9/0.1 water/acetonitrile/formic acid and 20/79.9/0.1 water/acetonitrile/formic acid, respectively. Mass spectral analysis was performed using a modified commercial LTQ-Velos mass spectrometer as shown in Figure 1 (ThermoFisher Scientific, San Jose, CA). Electrospray ionization was achieved by applying 2.5 kV distally via a liquid junction. For LC-MS analysis, ~1.5 µg of soluble lysate or 1 pmol of peptide standard was loaded on column.
Figure 1.
A schematic of the LTQ Velos Pro (ThermoFisher, San Jose, CA). To implement fHCD, q00 was replaced with an octopole and a DC voltage was placed on the exit lens downstream from the s-lens. Ions are isolated in the ion trap sent back to q00 (70 mtorr) for dissociation and then fragment ions are sent back to the ion trap for subsequent mass analysis.
Experiment 1 – Efficiency of fHCD vs. RE-CID
To evaluate the efficiency of fHCD, the manufacturer’s calibration solution was infused at a rate of 3 µL/min using the heated electrospray (HESI) probe and the IonMax source. The MRFA peptide was fragmented via fHCD and RE-CID. Five hundred scans were collected for each method at two different automatic gain control (AGC) target values of 10,000 and 20,000 ions. After converting the raw files to binary files using MakeMS2, custom software was written in-house to extract the ion injection times (IIT) and total ion intensity (TIC) values from each scan. The number of ions per scan was calculated by multiplying the IIT (s) by TIC values.
Experiment 2 – Comparisons of fHCD vs. RE-CID for Shotgun proteomics
For comparisons between CID and fHCD for shotgun proteomic experiments, a typical scan cycle was employed using 10 CID or fHCD events per precursor scan. Both rapid fHCD/CID and normal scan fHCD/CID rates were evaluated and runs were randomized throughout to minimize any measurement bias. In both experiments dynamic exclusion was used with a list size of 50 and a time of 30s. For both fHCD and CID experiments, a normalized collision energy of 35 was used. For fHCD, the optimal CE was empirically optimized to give the highest number of peptide IDs (Supplemental Figure 1). The target ion population for automatic gain control was set to 10,000 ions with a maximum ion injection time of 300 ms. A commercial digest consisting of 6 bovine proteins (Bruker Michrom, Auburn, CA) was ran after every 5 injections and was used to evaluate chromatographic peak shape, retention time reproducibility, and peak intensity.
Database Searching via Sequest and Mascot
Peptide matches were assigned to spectra using an in-house developed pipeline and the Sequest algorithm. Experimental spectra were searched against a sequence (target) and reversed-sequence (decoy) database of all annotated proteins for C. elegans. Candidate peptides for each spectrum were restricted to a +/−3 Daltons precursor mass tolerance, and included peptides resulting from semi-tryptic digestion and/or a single missed cleavage event. The target and decoy database search results were processed by Percolator1 to increase peptide-spectrum matches and enforce a PSM-level q value threshold of <0.01.
Mascot searches were automated using Mascot Daemon with a precursor/peptide fragment tolerance of 0.8 Daltons and searched against the same database as the Sequest results. Peptide charge states 1+, 2+ and 3+ were considered and a single miscleavage was allowed. Data were searched against a target and decoy database using the Mascot automatic decoy search. Mascot Percolator20 was used as a post-processor to improve the sensitivity of the search and enforce a PSM-level q value threshold of <0.01.
Mass Measurement Error Analysis
The mass measurement error characteristics of each fragmentation technique were compared by analysis of confident PSMs identified using Sequest and Percolator. For each PSM, the mass measurement error of every singly-charged b and y ion peak is determined by subtracting the mass of the theoretical peak from the mass of the nearest peak in the MS/MS spectrum.
Experiment 3 - Evaluation of spectral quality of labile modified peptides
The spectral quality of peptides modified with either a phosphate or a β-Nacetylglucosamine (O-glcNAc) was compared between RE-CID and fHCD. In this experiment, 1 pmol of peptide standard was injected on column. Alternating CID and fHCD scan events interrogated the most abundant precursor from the precursor scan and dynamic exclusion was turned off. This effectively led to several RE-CID and fHCD MS2 scans across the elution profile of each peptide standard. Spectral quality between RE-CID and fHCD was evaluated by both qualitatively comparing the spectra and quantitatively comparing the cross-correlation scores (XCorrs) between experimental and theoretical data.
Results and Discussion
Implementation of fHCD on Velos
Figure 1 displays a schematic of the instrument used in these studies. To implement fHCD in the q00 region, a DC voltage of 100 V was placed on the exit lens downstream from the s-lens, to block ions entering the device from the source and create a trapping well for ions injected from the ion trap. The q00 device is normally a square quadrupole, but was replaced with an octopole ion guide. The octopole has a higher ion storage capacity and better gas conductance than the square quadrupole, which resulted in increased sensitivity for fHCD analysis. As listed in the figure, fHCD analysis consists of 3 simple steps: 1) Ions are isolated in the ion trap; 2) Isolated ions are sent to q00 for activation/dissociation; and 3) Fragment ions are sent back to the ion trap for mass analysis. To complete this series of events requires approximately 2 ms.21 Because there is nominally no dc potential gradient along the length of q00, its short length (25.4 mm) is fundamental to the speed of the extraction process. The lens potentials do penetrate some distance into the device, but still ions must reach the exit volume by simple diffusion. Hence, the pressure in q00 is important to the ion extraction time from q00, which is < 0.5 ms for normal conditions. To be conservative the experiment employed an extraction time of 2ms, which is still 10-fold faster than reported using q0 for HCD on a quadrupole linear ion trap.17
A normalized collision energy method22 was developed for fHCD to automatically determine the optimum offset voltage for a given m/z. Optimum offsets were empirically determined for several ions in the standard LTQ Calibration Mix (Sigma) to produce a m/z to collision energy calibration. To standardize the fragmentation across different instruments, the optimum offsets were normalized to an arbitrary reference value of 40%, as described previously.22 Thereafter, collision offsets were specified in the instrument method in terms of a collision energy percent and not an absolute voltage offset. The collision energies were also subsequently scaled as a function of charge state. The scaling factors were determined by a large scale LC-MS study of optimum offsets for peptides of various mass and charge.21
Experiment 1 – Efficiency of RE-CID vs. fHCD
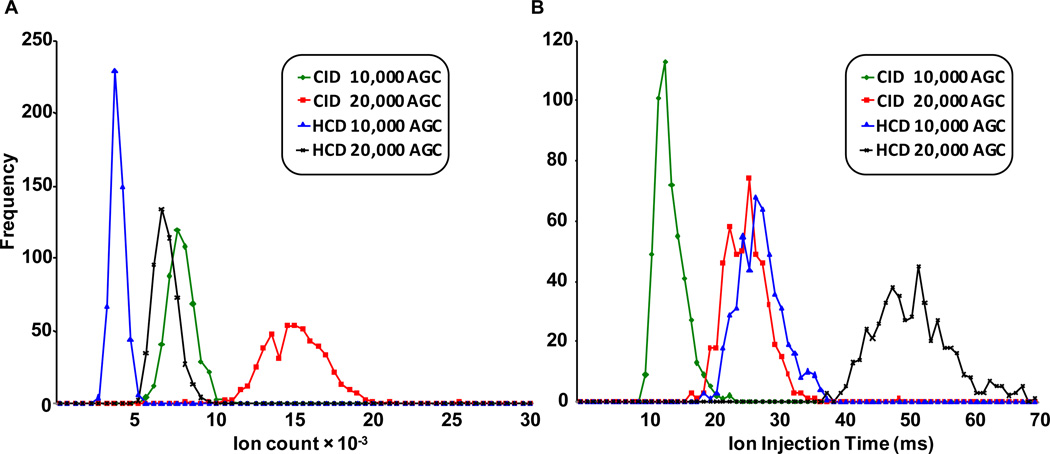
RE-CID is known to be extremely efficient in the conversion of precursor to fragment ions.23 Therefore, it was necessary to quantitatively determine the efficiency of this novel way to perform HCD on the front end of the Velos ion trap (fHCD) and compare it with RE-CID. Figure 2A displays a histogram of the total number of ions (TIC × IIT) from the dissociation of peptide MRFA between RE-CID and fHCD at two different AGC target values. On average fHCD and RE-CID returned 3,433 ± 416 and 7,495 ± 866 ions at a target AGC value of 10,000 respectively. At a target AGC of 20,000, similar differences were observed between fHCD (6,505 ± 744 ions) and RE-CID (14,790 ± 1892 ions). Figure 2B displays a histogram of the ion injection times from these same experiments between RE-CID and fHCD. The IITs for fHCD events were calculated by first following the same procedure as for calculating IITs for RE-CID events and then doubling the result. This was done to partially compensate for the inefficiency of fHCD and is similar to what is done for pulsed-Q dissociation (PQD) and electron transfer dissociation (ETD). Accounting for this 2-fold increase in IIT, fHCD is ~23% as efficient compared to RE-CID on this particular instrument. Similar data describing fHCD efficiency in relation to RE-CID were obtained in an LC-MS run (i.e., shotgun proteomics) and are noted in Supplemental Figure 2.
Figure 2.
A) A comparison of the number of ions from the dissociation of MRFA by RE-CID and fHCD. 500 scans were taken at each AGC target value. B) A histogram of the ion injection times from these same experiments. For a given AGC target the IIT were doubled for fHCD to partially account the lower efficiency of fHCD.
Experiment 2 – Comparisons of fHCD vs. RE-CID for Shotgun proteomics
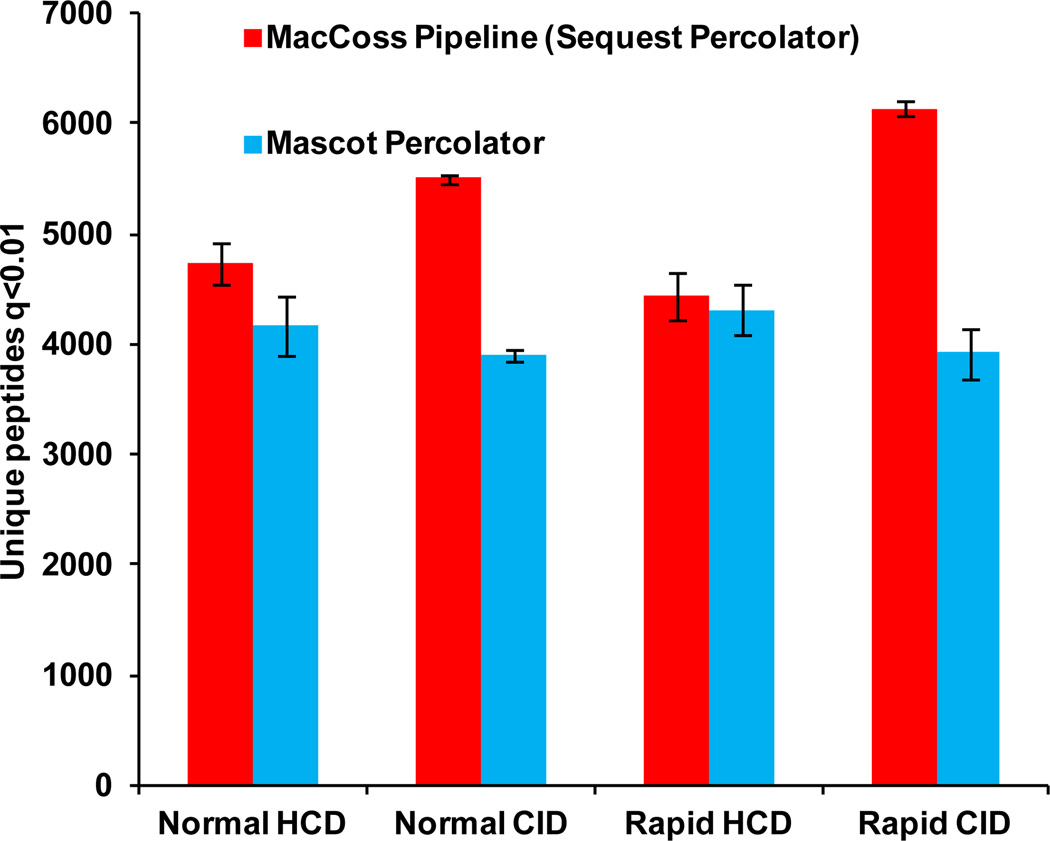
Figure 3 displays the number of unique peptides identified from a soluble fraction of a C. elegans lysate between RE-CID and fHCD. Data were searched with both Sequest Percolator and Mascot Percolator. fHCD yielded approximately 6.5% more unique peptides (p=0.04) than RE-CID when searched with Mascot. However, the opposite was observed when conducting the searches with Sequest, as RE-CID afforded approximately a 15% increase in unique peptide identifications (p=0.02) compared to fHCD. These discrepancies emphasize the importance of the search algorithm when analyzing these data.
Figure 3.
The number of unique peptides identified between fHCD and RE-CID from a soluble lysate of C. elegans using Mascot and Sequest. Both searches were post processed with Percolator to enforce a q value of <0.01 at the PSM level. Normal and rapid scan rates were also evaluated (see text for further details).
In addition, Figure 3 compares normal and rapid scan rate acquisitions. Rapid scan is a new scan option available on the Velos Pro instrument – a slightly lower resolution is used to double the scan out rate (33 kDa/s vs. 66 kDa/s) affording an increase in duty cycle compared to the more commonly used normal scan. Doubling of the scan rates yields on average a 12.9% and 11.7% increase in total number of scans for RE-CID and fHCD runs, respectively (Supplemental Figure 3). This increase in scan rate acquisition leads to an 11% increase in identifications by RE-CID; however, an insignificant difference in the number of unique peptide identifications by fHCD was observed using Sequest. Mascot identified approximately 4% more peptides when using the rapid scan rate option for the data set collected under fHCD conditions. Interestingly, for RE-CID no significant difference in peptide identifications was observed between rapid and normal scan rates.
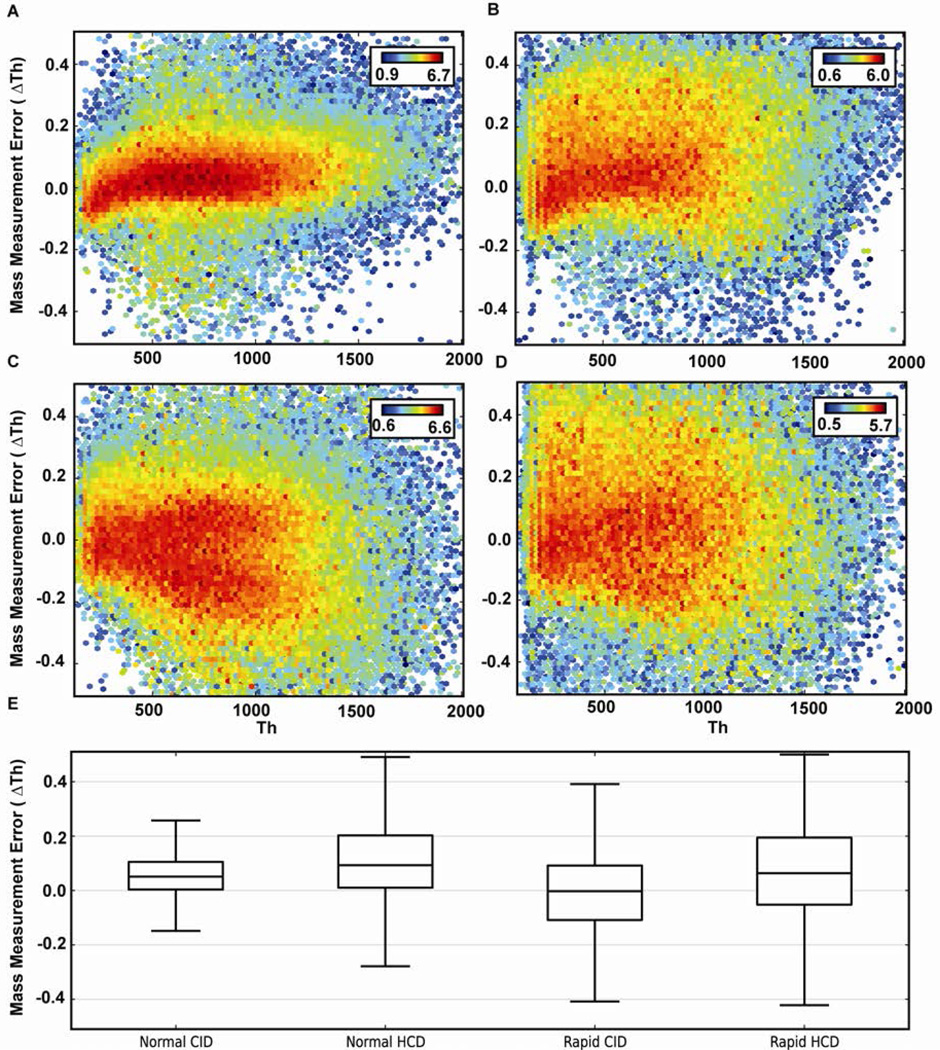
To investigate the differences in data quality between spectra collected using rapid scan rate vs. normal scan rate acquisitions, the mass measurement accuracy of fragment ions was examined. Figure 4A–D displays a heat map of the mass error of each identified fragment ion as a function of m/z for normal scan RE-CID, normal scan fHCD, rapid scan RE-CID and rapid scan fHCD, respectively. The heat describes the summed intensity of the peaks at their respective coordinate (mass error vs. m/z). Although similar accuracies were observed, the precision of the measurements were worse for rapid scan rates for both RE-CID and fHCD. Interestingly, it was also observed that fHCD data were routinely less precise than RE-CID data when comparing either normal or rapid scan rates. Figure 4E displays a box plot of each data set.
Figure 4.
A heat map and box plot comparing the MMA distribution of fragment ions between A) RE-CID normal scan rate; B) fHCD normal scan rate; C) RE-CID rapid scan rate; D) fHCD rapid scan rate. The heat is the log of the summed fragment ion intensity for each bin. E) A box plot comparing the mass errors of each data set. The line through the box represents the median (50th percentile) while the box represents the lower (25th percentile) and upper (75th percentile) quartiles. Whiskers extend to farthest points that are still 1.5 interquartile ranges within the upper and lower quartiles.
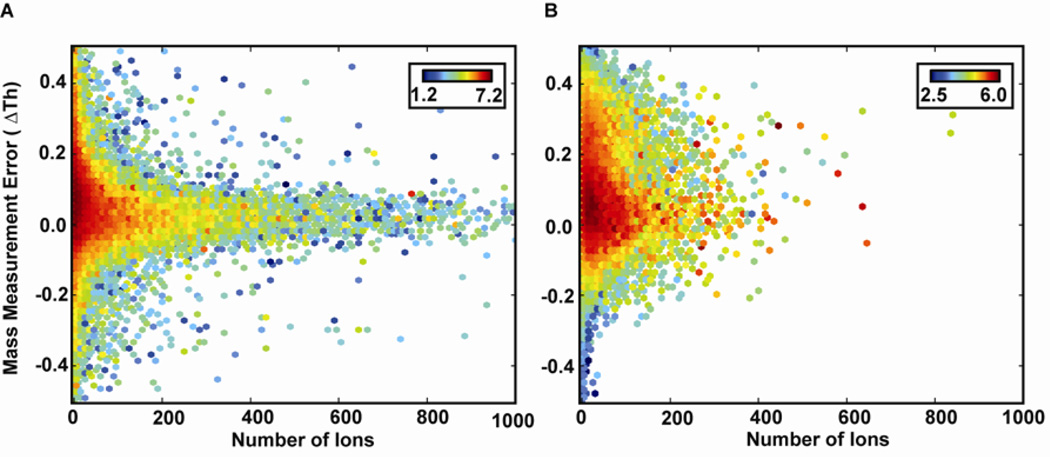
It was hypothesized that the lower number of ions per fragment channel, due to the lower efficiency and the more distributed nature of product ion intensities characteristic of fHCD, was responsible for the imprecise results of fHCD compared to RE-CID. Figure 5A–B displays a heat map of the mass error as a function of number of ions for RE-CID (normal scan) and fHCD (normal scan), respectively. The plot shows that there are many fragment ion peaks with a low number of ions in the fHCD data. As a result, the precision is lower in these data when compared to RE-CID data. It is believed that the relationship between low number of total fragment ions and imprecise results is simply due to the fact that there are lower number of events (ions) that define each peak. As a consequence the deviation in the centroid of the peak is larger – ultimately leading to a larger mass error distribution.
Figure 5.
Mass error as a function of number of ions for A) Normal scan RE-CID and B) Normal scan fHCD. The heat is the log of the summed fragment ion intensity for each bin.
Experiment 3 – Evaluation of labile modified peptides
Due to the tendency for facile loss of labile groups in RE-CID which leads to limited sequence information, phosphorylated and glycosylated (i.e., O-GlcNAc) peptides are often analyzed via ECD24, ETD25, or a combination of techniques.26 Phosphorylation is involved in an array of cellular processes and its de-regulation has been implicated in the onset of several diseases.27 Methods for phosphoproteomics via tandem mass spectrometry have had a long productive history and have been thoroughly reviewed recently.28 Although significantly less studied, O-GlcNAc modified peptides are receiving more interest due to two main reasons: 1) technological/instrumentation developments allowing interrogation of these extremely labile peptides; and 2) mounting evidence of their critical role in the regulation of proteins involved in numerous biological processes including transcription, signal transduction, and metabolism.29–31 The continued development of robust fragmentation techniques, available on an array of MS platforms, to interrogate these modified peptides is essential. In this experiment, the capabilities of fHCD were evaluated for the analysis of either phosphorylated or glycosylated (O-glcNAc) peptides and compared to results from RE-CID experiments.
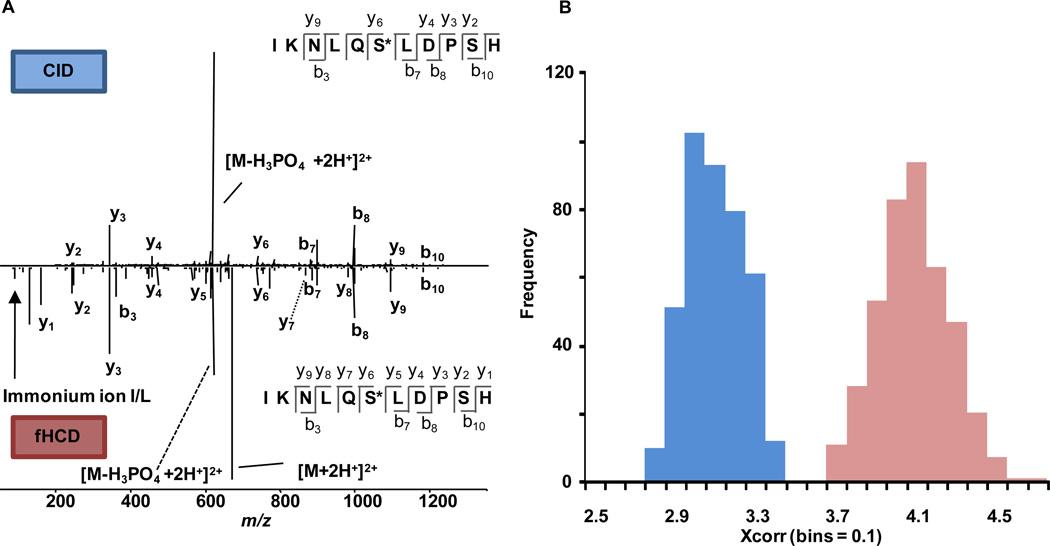
Figure 6A compares a representative mass spectrum from the analysis of a phosphorylated peptide by RE-CID and by fHCD (mirror axis). Although qualitatively the spectra seem rather similar, one can notice that several y and b-type ions are significantly more prevalent in the fHCD spectrum relative to the base peak. As expected, due to both techniques being slow heating dissociation methods12, one of the more abundant peaks is the neutral loss of the phosphate group (H3PO4) from the peptide backbone. In addition, it should be noted that the low MW cutoff is apparent in the RE-CID spectrum where in the fHCD spectrum the y1 and immonium ions are easily detected. Taking a more quantitative approach, Figure 6B compares the distributions of the cross correlation scores between the theoretical fragmentation pattern and those generated from RE-CID and fHCD. As shown, fHCD consistently returns higher quality spectra with an average cross correlation that is significantly higher (p<0.05) than the spectra obtained from the RE-CID experiments.
Figure 6.
A) A comparison between spectra of RE-CID and fHCD (mirrored axis) for the analysis of a phosphorylated peptide. B) fHCD afforded significantly higher spectral quality for this modified peptide as evidenced by the distribution of XCorrs.
Comparing the capabilities of fHCD and RE-CID for the analysis of O-GlcNAc peptide standard, several fragment ions were observed in the fHCD spectra; while, only two predominant peaks were observed in the RE-CID spectra (Supplemental Figure 4). These two peaks corresponded to the charge loss of the GlcNAc moiety from the precursor leaving the singly charged non-glycosylated peptide. While fHCD seemed to afford better sequence coverage, the XCorrs were similar between fHCD and RE-CID. This is because most of the peaks observed in the fHCD also correspond to the loss of the GlcNAc group. Ultimately, this is not surprising and is the result of the O-GlcNAc group being highly labile and both RE-CID and fHCD being slow heating dissociation methods.32–33 Nevertheless, fHCD on average, afforded a statistically greater XCorr (p<0.05). In addition, several low m/z fragment masses (m/z 186, m/z 168, m/z 144, m/z 138, m/z 126) were identified by fHCD that were not observed in the RE-CID spectra and are indicative of an O-GlcNAc modified peptide.26 Potentially with this information, mass of the precursor, and other fragment information, a de novo type sequencing scheme could be developed.
Conclusions
Software and hardware modifications were employed on a benchtop dual pressure linear ion trap to implement beam-type fragmentation. This process is referred to here as fHCD. Several characteristics of fHCD were evaluated including efficiency, mass measurement accuracy of fragment ions, unique peptide identifications, and spectral quality of labile modified peptides. fHCD was found to be ~23% as efficient as RE-CID. Although beam-type fragmentation is not necessarily less efficient than RE-CID, in this setup a large percentage of losses are incurred from the ions undergoing multiple passes through a series of conductance limits. A recent report determines the ion loss for this combined transfer to be ~40%.21 Regardless, fHCD identified ~6% more peptide identifications than RE-CID when using the Mascot search algorithm. However, RE-CID returned more peptide identifications using Sequest – indicating that the choice of database search algorithm is an important parameter when searching these data. It was found that the mass measurement accuracy (MMA) of fragment ions were considerably less precise in both rapid scan and fHCD data which was attributed to the lower number of ions defining each peak. fHCD yielded a significant advantage when interrogating both phosphorylated and glycosylated peptides (O-GlcNAc). Future work will entail using the low mass immonium ions as a feature in Percolator to increase sensitivity of fHCD and to evaluate the use of fHCD shotgun data in our discovery to targeted pipeline.
Supplementary Material
Acknowledgements
The authors greatly acknowledge the financial support from the National Institutes of Health (R01 DK069386, U01 HG004263, and P41 RR011823). MSB acknowledges support from the Genome Training Grant (T32 HG000035) and JDE appreciates support from the NIH F31 award (F31 AG037265).
References
- 1.Kall L, Canterbury JD, Weston J, Noble WS, MacCoss MJ. Nat Methods. 2007;4:923–925. doi: 10.1038/nmeth1113. [DOI] [PubMed] [Google Scholar]
- 2.Hsieh EJ, Hoopmann MR, MacLean B, MacCoss MJ. J Proteome Res. 2010;9:1138–1143. doi: 10.1021/pr900816a. [DOI] [PMC free article] [PubMed] [Google Scholar]
- 3.Syka JEP, Marto JA, Bai DL, Horning S, Senko MW, Schwartz JC, Ueberheide B, Garcia B, Busby S, Muratore T, Shabanowitz J, Hunt DF. J Proteome Res. 2004;3:621–626. doi: 10.1021/pr0499794. [DOI] [PubMed] [Google Scholar]
- 4.Olsen JV, Schwartz JC, Griep-Raming J, Nielsen ML, Damoc E, Denisov E, Lange O, Remes P, Taylor D, Splendore M, Wouters ER, Senko M, Makarov A, Mann M, Horning S. Mol Cell Proteomics. 2009;8:2759–2769. doi: 10.1074/mcp.M900375-MCP200. [DOI] [PMC free article] [PubMed] [Google Scholar]
- 5.Hu QZ, Noll RJ, Li HY, Makarov A, Hardman M, Cooks RG. J Mass Spectrom. 2005;40:430–443. doi: 10.1002/jms.856. [DOI] [PubMed] [Google Scholar]
- 6.Hardman M, Makarov AA. Anal Chem. 2003;75:1699–1705. doi: 10.1021/ac0258047. [DOI] [PubMed] [Google Scholar]
- 7.Bereman MS, Lyndon MM, Dixon RB, Muddiman DC. Rapid Commun Mass Spectrom. 2008;22:1563–1566. doi: 10.1002/rcm.3544. [DOI] [PubMed] [Google Scholar]
- 8.Andrews GL, Simons BL, Young JB, Hawkridge AM, Muddiman DC. Anal Chem. 2011;83:5442–5446. doi: 10.1021/ac200812d. [DOI] [PMC free article] [PubMed] [Google Scholar]
- 9.Kelleher RL, Zubarev RA, Bush K, Furie B, Furie BC, McLafferty FW, Walsh CT. Anal Chem. 1999;71:4250–4253. doi: 10.1021/ac990684x. [DOI] [PubMed] [Google Scholar]
- 10.Syka JEP, Coon JJ, Schroeder MJ, Shabanowitz J, Hunt DF. Proc Natl Acad Sci U S A. 2004;101:9528–9533. doi: 10.1073/pnas.0402700101. [DOI] [PMC free article] [PubMed] [Google Scholar]
- 11.Shukla AK, Futrell JH. J Mass Spectrom. 2000;35:1069–1090. doi: 10.1002/1096-9888(200009)35:9<1069::AID-JMS54>3.0.CO;2-C. [DOI] [PubMed] [Google Scholar]
- 12.McLuckey SA, Goeringer DE. J Mass Spectrom. 1997;32:461–474. [Google Scholar]
- 13.Keller KM, Brodbelt JS, Hettich RL, Van Berkel GJ. J Mass Spectrom. 2004;39:402–411. doi: 10.1002/jms.602. [DOI] [PubMed] [Google Scholar]
- 14.Ross PL, Huang YLN, Marchese JN, Williamson B, Parker K, Hattan S, Khainovski N, Pillai S, Dey S, Daniels S, Purkayastha S, Juhasz P, Martin S, Bartlet-Jones M, He F, Jacobson A, Pappin DJ. Mol Cell Proteomics. 2004;3:1154–1169. doi: 10.1074/mcp.M400129-MCP200. [DOI] [PubMed] [Google Scholar]
- 15.Falick AM, Hines WM, Medzihradszky KF, Baldwin MA, Gibson BW. J Am Soc Mass Spectr. 1993;4:882–893. doi: 10.1016/1044-0305(93)87006-X. [DOI] [PubMed] [Google Scholar]
- 16.Olsen JV, Macek B, Lange O, Makarov A, Horning S, Mann M. Nat Methods. 2007;4:709–712. doi: 10.1038/nmeth1060. [DOI] [PubMed] [Google Scholar]
- 17.McAlister GC, Phanstiel DH, Brumbaugh J, Westphall MS, Coon JJ. Mol Cell Proteomics. 2011;10 doi: 10.1074/mcp.O111.009456. O111 009456. [DOI] [PMC free article] [PubMed] [Google Scholar]
- 18.Bereman MS, Egertson JD, Maccoss MJ. Proteomics. 2011;11:2931–2935. doi: 10.1002/pmic.201100045. [DOI] [PMC free article] [PubMed] [Google Scholar]
- 19.Klammer AA, MacCoss MJ. J Proteome Res. 2006;5:695–700. doi: 10.1021/pr050315j. [DOI] [PMC free article] [PubMed] [Google Scholar]
- 20.Brosch M, Yu L, Hubbard T, Choudhary J. J Proteome Res. 2009;8:3176–3181. doi: 10.1021/pr800982s. [DOI] [PMC free article] [PubMed] [Google Scholar]
- 21.Remes PM, Schwartz JC, McAlister GC, Horner J, Zhang T, Kiyonami R, Specht A, Coon JJ. American Society for Mass Spectrometry (ASMS) Denver, CO: 2011. [Google Scholar]
- 22.Schwartz JC, Taylor DM. U.S. Patent 6,124,591. 1999 [Google Scholar]
- 23.Schwartz JC, Senko MW, Syka JEP. J Am Soc Mass Spectr. 2002;13:659–669. doi: 10.1016/S1044-0305(02)00384-7. [DOI] [PubMed] [Google Scholar]
- 24.Sweet SM, Bailey CM, Cunningham DL, Heath JK, Cooper HJ. Mol Cell Proteomics. 2009;8:904–912. doi: 10.1074/mcp.M800451-MCP200. [DOI] [PMC free article] [PubMed] [Google Scholar]
- 25.Chalkley RJ, Thalhammer A, Schoepfer R, Burlingame AL. Proc Natl Acad Sci USA. 2009;106:8894–8899. doi: 10.1073/pnas.0900288106. [DOI] [PMC free article] [PubMed] [Google Scholar]
- 26.Zhao P, Viner R, Teo CF, Boons GJ, Horn D, Wells L. J Proteome Res. 2011;10:4088–4104. doi: 10.1021/pr2002726. [DOI] [PMC free article] [PubMed] [Google Scholar]
- 27.Cohen P. Eur J Biochem. 2001;268:5001–5010. doi: 10.1046/j.0014-2956.2001.02473.x. [DOI] [PubMed] [Google Scholar]
- 28.Nagaraj N, D'Souza RCJ, Cox J, Olsen JV, Mann M. J Proteome Res. 2010;9:6786–6794. doi: 10.1021/pr100637q. [DOI] [PubMed] [Google Scholar]
- 29.Hanover JA, Krause MW, Love DC. Biochim Biophys Acta. 2010;1800:80–95. doi: 10.1016/j.bbagen.2009.07.017. [DOI] [PMC free article] [PubMed] [Google Scholar]
- 30.Love DC, Hanover JA. Sci STKE. 2005;2005:re13. doi: 10.1126/stke.3122005re13. [DOI] [PubMed] [Google Scholar]
- 31.Zachara NE, Hart GW. Biochim Biophys Acta. 2004;1673:13–28. doi: 10.1016/j.bbagen.2004.03.016. [DOI] [PubMed] [Google Scholar]
- 32.Jebanathirajah J, Steen H, Roepstorff P. J Am Soc Mass Spectr. 2003;14:777–784. doi: 10.1016/S1044-0305(03)00263-0. [DOI] [PubMed] [Google Scholar]
- 33.Chalkley RJ, Burlingame AL. J Am Soc Mass Spectrom. 2001;12:1106–1113. doi: 10.1016/s1044-0305(01)00295-1. [DOI] [PubMed] [Google Scholar]
Associated Data
This section collects any data citations, data availability statements, or supplementary materials included in this article.


