Abstract
It has been widely believed that drug entry from the middle ear into perilymph occurs primarily via the round window (RW) membrane. Entry into scala vestibuli (SV) was thought to be dominated by local, inter-scala communication between scala tympani (ST) and SV through permeable tissues such as the spiral ligament. In the present study, the distribution of the ionic marker trimethylphenylammonium (TMPA) was compared following intracochlear injections or applications to the RW niche, with or without occlusion of the RW membrane or stapes area. Perilymph TMPA concentrations were monitored either in real time with TMPA-selective microelectrodes sealed into ST and SV, or by the collection of sequential perilymph samples from the lateral semi-circular canal. Local inter-scala communication of TMPA was confirmed by measuring SV and ST concentrations following direct injections into perilymph of ST. Application of TMPA to the RW niche also showed a predominant entry into ST, with distribution to SV presumed to occur secondarily. When the RW membrane was occluded by a silicone plug, RW niche irrigation produced higher concentrations in SV compared to ST, confirming direct TMPA entry into the vestibule in the region of the stapes. The proportion of TMPA entering by the two routes was quantified by perilymph sampling from the lateral semi-circular canal. The TMPA levels of initial samples (originating from the vestibule) were markedly lower when the stapes area was occluded with silicone. These data were interpreted using a simulation program that incorporates all the major fluid and tissue compartments of the cochlea and vestibular systems. From this analysis it was estimated that 65 % of total TMPA entered through the RW membrane and 35% entered the vestibule directly in the vicinity of the stapes. Direct entry of drugs into the vestibule is relevant to inner ear fluid pharmacokinetics and to the growing field of intratympanic drug delivery.
Keywords: Cochlea, Perilymph, Round Window, Intratympanic drug delivery, TMPA, Trimethylphenylammonium
1.0 Introduction
It has been widely assumed that intratympanically-applied, low-molecular weight drugs enter the fluids of the inner ear predominantly by passing through the round window membrane (Smith and Myers 1979; Lundmann et al., 1987; Goycoolea and Lundmann, 1997; Salt and Plontke, 2005). Larger molecules, such as albumin and thorotrast, have been reported to be less permeable and do not easily pass unless the RW membrane is damaged or in a pathologic state. (Höft, 1969; Goycoolea et al., 1980). Tanaka and Motomura (1981) reported that horseradish peroxidase (HRP) could pass through both the RW membrane and through the stapediovestibular joint, but no quantification of the relative rates was attempted. Saijo and Kimura (1984) found there were “no essential differences” in the distribution of HRP when applied to the middle ear cavity, directly to the basal turn of scala tympani or to the cerebrospinal fluid. This was thought to be consistent with HRP primarily entering scala tympani (ST) of the cochlea through the RW membrane. In the same study, HRP was found in the vestibular organs and endolymphatic sac when middle ear applications were performed after occluding the round window with dental cement. Their conclusions of entry by routes other than the round window membrane were, however, tempered by a lack of confidence in the use of dental cement for occlusion, stating that it “proved to be an imperfect method for sealing”. Complicating the interpretation of middle ear application experiments are the presence of local, “radial” communication pathways between ST and scala vestibuli (SV). Using markers injected into one scala (ST or SV) and simultaneously monitored in the injected and the opposing perilymphatic scala with ion-selective microelectrodes, it was shown that substances could rapidly distribute from one perilymph scala to the other (Salt et al., 1991a; Salt et al., 1991b). The rapid communication between perilymphatic scalae has since been supported in magnetic resonance (MR) imaging studies, with locally-applied gadolinium (Gd) as a marker (Zou et al., 2005). In view of these data, it has been assumed that locally-applied drugs that have actions on the vestibular system, such as gentamicin, gain access to the vestibule by local communication pathways in the basal turn that do not involve passage through the helicotrema (Plontke et al., 2002). Indeed, this interpretation has been used to explain how vestibular ablation with gentamicin can occur with minimal hearing loss in humans (Salt et al., 2008). Perilymphatic measurements of substance entry into ST during RW niche irrigation added further support for substances predominantly entering perilymph via the RW membrane (Salt and Ma, 2001). Based on these combined studies it has been widely assumed that drug entry into perilymph occurs primarily into ST with subsequent distribution to the vestibular perilymph by local communication pathways. This sequence of events has been thought to be applicable to both normal and pathologic states. In either state, the oval window has not been considered a major route for entry into the inner ear (Goycoolea et al., 1980b).
In recent years, the use of high resolution MR imaging in conjunction with locally-applied Gd solution has provided a new approach to document solute entry into the inner ear. In these studies, image brightness levels provide an index of Gd concentration. The results of some studies are qualitatively consistent with entry primarily occurring through the RW membrane (Yoshioka et al, 2009). In others, brightness levels in the vestibule and semi-circular canals of rats, guinea pigs and humans have been notably high at times less than 2 hours after intratympanic injections (Zou et al., 2005, Zou et al., 2010). Various explanations of these results have been offered, including transport by calcium channels in the spiral ligament and the possibility of a portion of the Gd entering the annular ligament associated with the stapediovestibular joint. A recent study using Gd with MR imaging reported a systematic, quantitative analysis of brightness levels of ST and SV in guinea pigs (King et al., 2011). They found that in the majority of animals brightness was higher in SV than ST at both 60 min and 2.5 hr after intratympanic application. Given the substantially larger volume of the vestibule and SV compared to ST, it was calculated that 90% of the Gd entry in these experiments occurred directly into the vestibule in the region of the stapes.
The possibility that a substantial proportion of some solutes can enter the inner ear in the vicinity of the stapes following intratympanic application has led to the present investigation. We have evaluated whether similar, direct entry into the vestibule occurs for another marker ion, trimethylphenylammonium (TMPA). TMPA is a useful marker as it allows perilymph concentrations with time to be measured in vivo with TMPA-selective microelectrodes sealed into the cochlear scalae. TMPA is also readily assayed in perilymph fluid samples, allowing comparisons between time course and sample data. The goal of this study was to determine whether significant TMPA entry occurred directly into the vestibule and to quantify the entry proportion relative to that entering via the RW membrane. For brevity, we will refer to entry into the vestibule as occurring at “the stapes”, but possible entry sites will be discussed later in more detail.
2.0 Methods
This study utilized 38 pigmented NIH strain guinea pigs of both sexes from our own colony, weighing 450 – 600 gm. These animal studies were conducted in accordance with the policies and recommendations of the United States Department of Agriculture, the National Institute of Health guidelines for the handling and use of laboratory animals, and received approval from the Institutional Animal Care and Use Committee of Washington University under protocol 20070147.
All experiments were performed as non-recovery procedures on animals initially anesthetized with 100 mg/kg sodium thiobutabarbital (Inactin, Sigma, St Louis, MO) then maintained on 0.6–1.2 % isofluorane in oxygen. Animals were ventilated via a tracheal cannula with tidal volume set to maintain end-tidal CO2 near 38 mmHg (5%). Body temperature was maintained at 39 °C with a thermistor-controlled heating pad and heart rate and blood oxygen saturation were monitored with a pulse-oximeter (Surgivet. Waukesha, WI).
Entry of TMPA into the inner ear was monitored by two methods during and following irrigation of the RW niche with solution containing 2 mM or 20 mM TMPA. In one group, TMPA concentrations were measured in real time using TMPA-selective microelectrodes sealed into the basal turn of ST and SV. In separate experiments, the TMPA content of perilymph was measured by the procedure of sequential perilymph sampling from the lateral semi circular canal. This is a variation of the method of sequential sampling from the cochlear apex which has been used to quantify drug gradients along the length of scala tympani (Mynatt et al, 2006).
2.1 TMPA Applications to the Round Window Niche
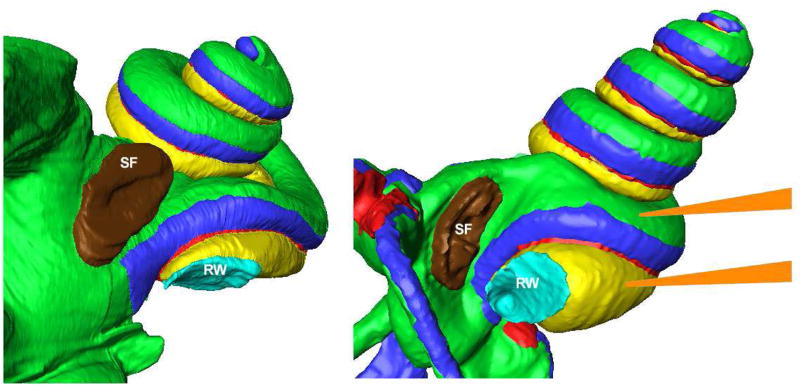
In guinea pigs and other rodents, the stapes is in close proximity to the RW membrane, which contrasts with the anatomy of the human, as shown in Figure 1. In the guinea pig, fluids injected into the RW niche typically exit the niche to the bulla by flowing over the stapes footplate. This anatomy makes it extremely difficult to apply solutions to the RW membrane without solution contacting the stapes. This is not the case for humans, where the different orientation of the RW membrane provides greater distance between the RW niche and the stapes. In the majority of experiments here, a physiologically-compatible solution (containing (mM): NaCl (127.5), KCl (3.5), NaHCO3 (25), CaCl2 (1.3), MgCl2 (1.2), NaH2PO4 (0.75) and Glucose (11)) with added 2 mM TMPA was irrigated through the RW niche at a rate of 5 μL/min. In some experiments a 20 mM TMPA solution, with NaCl reduced to maintain normal osmolarity, was used. Wicks were used to prevent solution accumulating in the middle ear. In some animals either the RW membrane or the stapes area was occluded using a two-part silicone compound (Kwik-Cast, World Precision Instruments, Sarasota, FL). In the case of the RW, any fluid on the membrane was removed by touching a tissue wick to the periphery, in the extreme hook region. Care was taken to avoid touching the membrane as this could cause it to start leaking fluid. Drops of silicone adhesive were allowed to spread across the RW membrane until the entire membrane was covered. Occluding the stapes area was more difficult as the area could not be dried with wicks and initial experiments showed that fluid readily passed underneath the silicone if a fluid layer was allowed to remain. Therefore, a brief period of suction, with the suction probe applied from the apical side of the bulla with the tip near the umbo of the malleus, was used to dry the stapes area. Silicone was then immediately applied, covering the entire stapes region and the bone between the stapes and the RW, but taking care to avoid contact with the RW membrane. For experiments where the volume of the RW niche was markedly reduced by occlusion, an irrigation rate of 2 μL/min was sufficient to maintain the fluid in the niche without excessive volume accumulation.
Figure 1.
Anatomically-correct 3D reconstructions of the human inner ear (left) and the guinea pig (right) showing the relative locations of the stapes footplate (SF: Brown) and the round window (RW: Cyan) membrane. The scaling of the two images is not the same and the guinea pig is shown with higher magnification. In the guinea pig, the RW and stapes are orientated more towards each other so that fluids applied to the RW niche also typically contact the stapes footplate. This is not the case in the human, where the RW membrane is orientated away from the stapes. The approximate locations of the TMPA measurement electrodes positioned in ST and SV of the basal turn of the guinea pig are also shown (Orange). Note that the distance from the RW membrane to the ST recording location is substantially smaller than from the stapes to the SV recording location, so the amount and time course of TMPA measured at these two locations would be expected to differ for entry at the two sites.
2.2 Perilymph Measurements with TMPA-selective Microelectrodes in vivo
Double-barreled TMPA-selective microelectrodes were made by procedures that are detailed elsewhere (Salt at al., 2006). Electrode tips were beveled to a diameter of 3–4 μm, the ion barrel was filled with 500 mM KCl, the reference barrel was filled with 500 mM NaCl, and a short column of TMPA-selective ion exchanger was drawn into the tip of the ion barrel. The electrodes were connected to a high-impedance electrometer through Ag/AgCl wires. Each electrode was calibrated before use in standards containing 0, 2, 20, 200 and 2000 μM TMPA, held at 39°C in a water circulation chamber. Calibrations were also verified after the experiment if the electrode could be recovered intact.
Electrodes were sealed into the basal turn of either ST or SV using procedures designed to prevent all fluid leakage at the insertion site. The mucosa covering the bone was removed and the bony scala wall was thinned with a flap knife. A thin layer of cyanoacrylate glue was applied to the dry bone, followed by a layer of Kwik-Cast silicone adhesive. A small (30–40 μm) fenestra was made through the adhesives and the bone. After the electrode was inserted through the fenestra, a tissue wick was used to remove the perilymph droplet at the insertion site and simultaneously a drop of cyanacrylate glue was applied to seal the electrode in place. The location of the basal turn recording sites in the guinea pig is also shown in Figure 1. It should be noted that for electrodes placed symmetrically across the endolymphatic compartment, the distance between the RW membrane and the ST recording site is considerably less than that between the stapes and the SV recording site. This is an important consideration in the interpretation of findings.
2.3 Perilymph Measurements using sequential sampling from the lateral semi-circular canal
Making a small (50 – 80 μm diameter) perforation of the bony wall of the lateral semi circular canal with a House stapes pick (0.3 mm, 30 degree, Storz N1705 80, Bausch and Lomb Inc.) results in an efflux of perilymph, driven by CSF entering the basal turn of scala tympani through the cochlear aqueduct. Perforation of the endolymphatic system with this methodology is unlikely as the pick is relatively blunt and does not enter the canal to a degree that could compress the membranous labyrinth. Samples collected from the lateral canal are first comprised of perilymph from the canal and vestibule, followed in turn by perilymph from SV and ST followed by CSF which has passed through the compartments. In order to interpret the data quantitatively, it is necessary to collect fluid samples from the canal without any loss of fluid to the middle ear. Therefore the dry bone of the canal wall was first treated with cyanoacrylate glue and the planned perforation site surrounded by Kwik-Cast silicone, forming a hydrophobic cup. After perforation, fluid leaking from the canal was collected in microcapillary tubes, each marked at a nominal volume of 1 μL. In each experiment twenty 1 μL samples were individually collected and the volume of each was determined by sample length. For analysis pairs of samples were pooled, reducing the measurements to 10 samples, each of approximately 2 μL. Samples were diluted in 25 μL of glucose-free artificial perilymph and their TMPA content measured in vitro.
TMPA measurements of fluid samples used ion-electrodes identical to those described above, except that the electrodes were calibrated at room temperature. These procedures have been detailed elsewhere (Mynatt et al., 2006). Samples from the animal and identical volumes of standard solutions were held in micro-wells of a Teflon block. The measurement procedure involved measuring 3 standards, 10 samples collected from the animal and 2 samples of the injected solution, subjected to the same dilution protocol. This entire sequence of measurements was performed twice and the standards were then measured for a third time. The small changes in the standard measurements over time were used to correct measurements for electrode drift and sample evaporation.
2.4 Data interpretation using computer simulations of the experiments
Computer simulations of the experiments utilized a new simulation model of the inner ear fluids originally made available on the internet in August 2010, with the latest version (v062) made available on our website at http://oto.wustl.edu/cochlea/ in June 2011. The model incorporates all the major fluid and tissue spaces of the cochlear and vestibular systems of the guinea pig, with anatomically-based cross sectional area and distance data of each compartment derived from 3D reconstructions of image sets of the guinea pig. The model calculates the distribution of substances in the ear resulting from diffusion and volume flow, and superimposes local, intercompartmental communications and elimination to blood. It includes algorithms representing injections of solution with associated volume flow, and includes permeability driven entry both into ST at the round window membrane and into the vestibule at the stapes. It also simulates the procedure of sequential sampling from any inner ear location (including the associated volume flows with time), specifically in this study for fluid samples collected sequentially from the lateral canal. Parameters for the model were based on the analysis of data sets from a variety of protocols for TMPA application (lateral canal injections, cochlear apex injections and basal turn injections) and different measurement methods (ion selective electrodes in vivo, samples from the cochlear apex and samples from the lateral canal). A summary of this analysis has been presented (Salt et al, 2011). The most pertinent model parameters, all of which were held constant for all the simulations in this study, are summarized in Table 1. As TMPA entry into endolymph has been shown to be negligible (Salt et al., 1991a), communications with endolymphatic compartments were excluded from the calculations. The only parameters that were varied to fit both time course (from ion electrodes) and sample data of the present study were the two values defining the permeabilities of the round window membrane and of the stapes. All model calculations assume a linear dependence on concentration, that is solute movements occur passively.
Table 1.
Computer model parameters held constant in all simulations
| SL – ST half time (min) | 8.4 |
| SL – SV half time (min) | 11.2 |
| ST – OC, ST – SG, SG – AN half times (min) | 10 |
| Elimination half time to blood from ST, SG, OC, AN (min) | 43 |
| Elimination half time to blood from SV (min) | 300 |
| Elimination half time to blood from SCC (min) | 275 |
| Tissue filled compartment (SL, SG, AN, OC) volume availability (%) | 60 |
| Elimination in apical turn relative to basal turn (%) | 60 |
| CSF entry rate into ST (μL/min) | 0.03 |
| Lateral SCC flow path (% volume flowing in the non-ampullary direction) | 35 |
Abbreviations: ST: scala tympani; SV: scala vestibuli; SL:spiral ligament; SG: spiral ganglion; AN: auditory nerve; OC: organ of Corti
3.0 Results
3.1 In vivo measurements of TMPA time courses in ST and SV
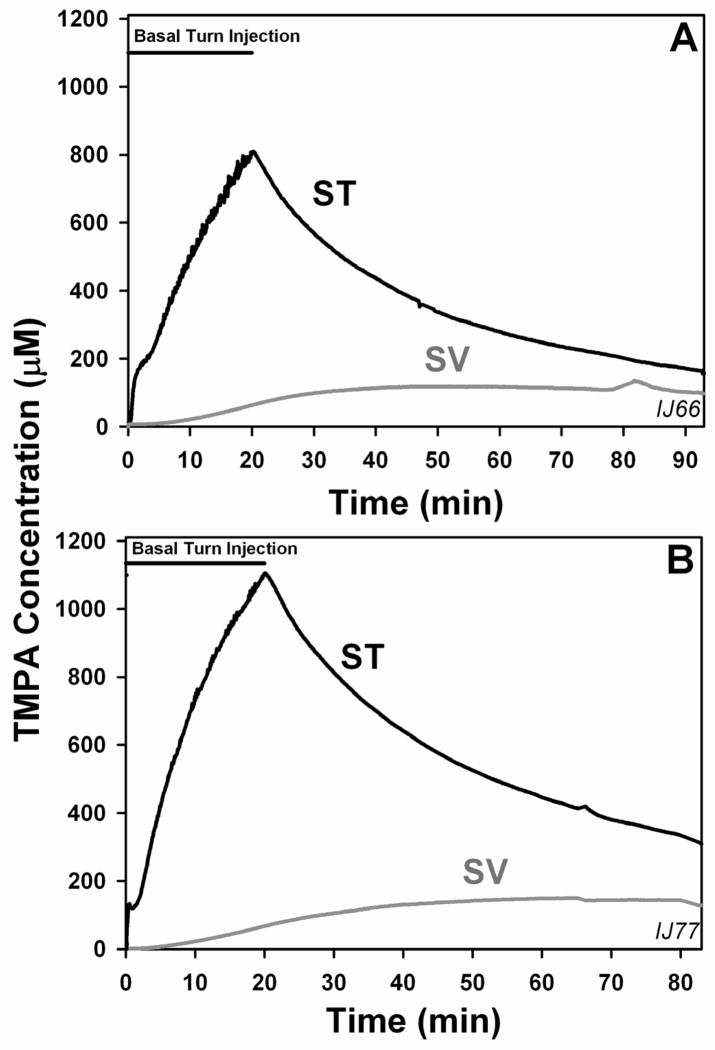
Interpreting TMPA measurements in the cochlea requires consideration of the local communication processes between ST and SV. For applications to the middle ear, the presence of TMPA in SV does not prove that TMPA entered the ear via the stapes. This is demonstrated in Figure 2, in which TMPA was applied directly into ST from an injection pipette sealed into the basal turn. In this experiment there was no TMPA solution in the middle ear so no TMPA entry occurred via the stapes. TMPA rose in ST due to the injection and the concentration in SV also increased but with a slower time course. The maximum in SV was reached well after the ST injection had ended. The increase in SV also occurred far too rapidly to be accounted for by TMPA movements along the scalae, passing through the helicotrema. Instead, the increase in SV can only be accounted for by local communication processes in the basal turn.
Figure 2.
Influence of local applications of TMPA into scala tympani (ST). In these two experiments TMPA concentration was monitored simultaneously in scala tympani (ST) and scala vestibuli (SV) of the basal cochlear turn during injection of 2 mM TMPA at a rate of 100 nl/min for 20 min from a pipette sealed into the basal turn of ST. It is apparent that within 5–7 min, concentration in SV starts rising with a slower time course than ST, showing that the TMPA marker becomes distributed to the opposite perilymphatic scala by local inter-scala communication processes. Thus, for middle ear applications, the presence of TMPA in SV does not confirm that the TMPA entered the SV directly, as it can enter indirectly, via the ST.
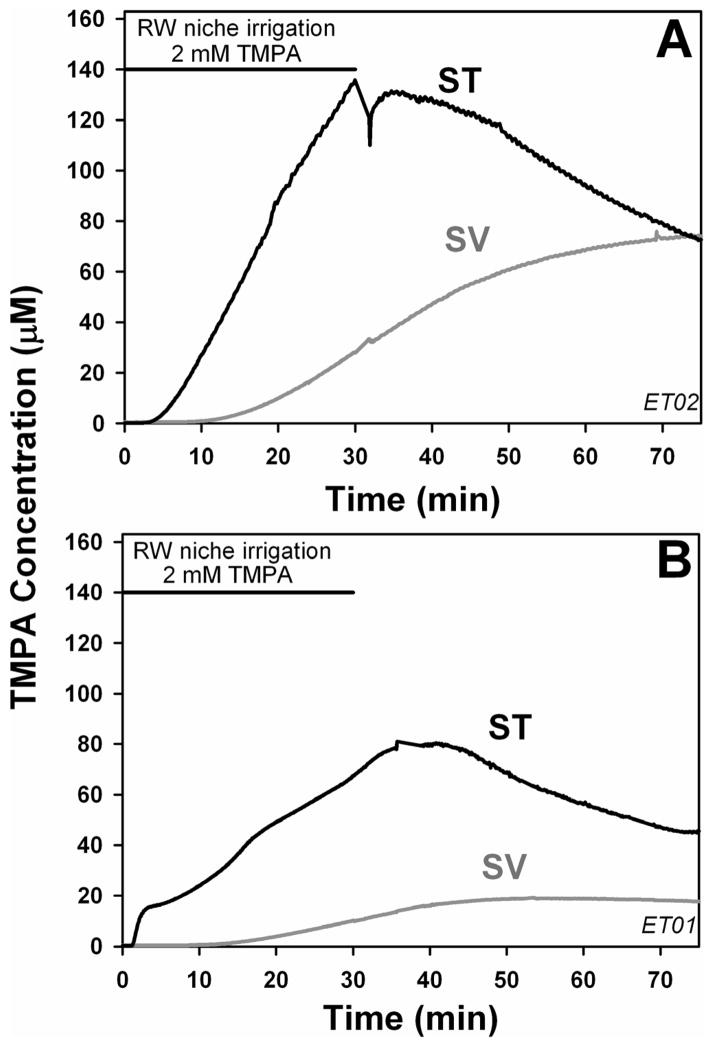
Similar simultaneous measurements of TMPA concentrations in ST and SV during irrigation of the RW niche with solution containing 2 mM TMPA are shown in Figure 3. TMPA rose more quickly and reached a higher level in ST than SV during the injections, and TMPA decreased more quickly in ST after the injections. The relative elevations of TMPA in SV were a little greater with this application protocol, but the time courses of change in ST and SV were notably similar to those with ST injection shown in Figure 2. The comparison of these two application protocols demonstrates the difficulty in interpreting perilymph concentration measurements in terms of the route(s) by which the marker reaches the measurement sites. The presence of TMPA in SV does not indicate that it entered SV directly via the stapes, because of the confounding influence of the high rate of local communication between the perilymphatic scalae. Since ST shows higher concentrations, the increase observed in SV could result from either local spread of TMPA from ST to SV across the spiral ligament or from a combination of local spread and TMPA entry into the vestibule via the stapes.
Figure 3.
TMPA entry from the middle ear. Two experiments are shown in which TMPA concentration was monitored simultaneously in scala tympani (ST) and scala vestibuli (SV) of the basal cochlear turn during irrigation of the round window niche with 2 mM TMPA. The TMPA increase in ST was greater than that of SV and the time course during and after application occurred more rapidly.
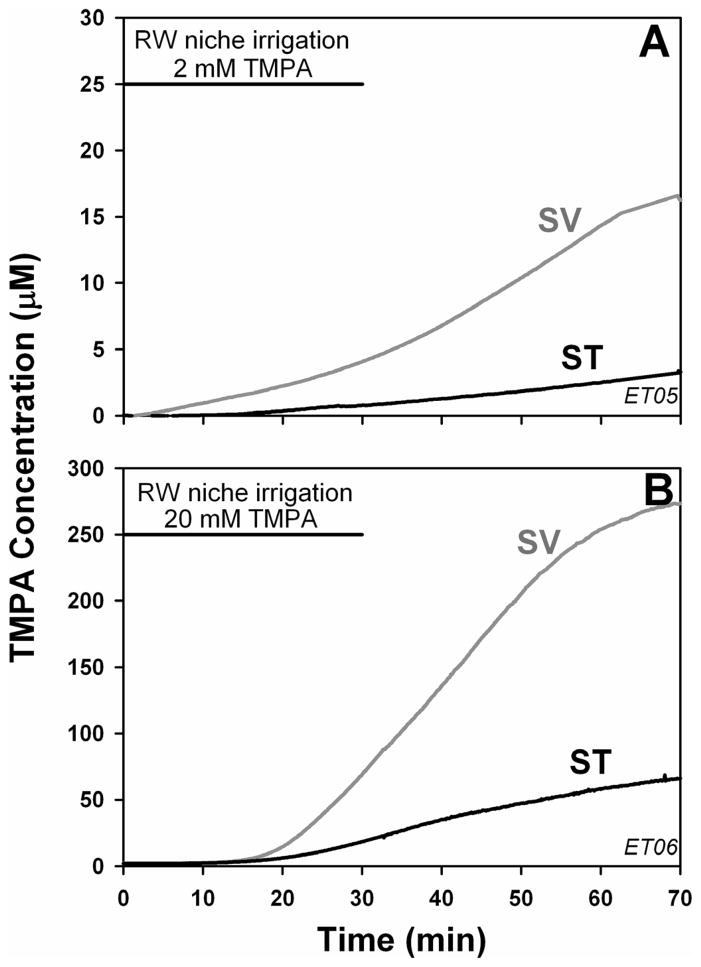
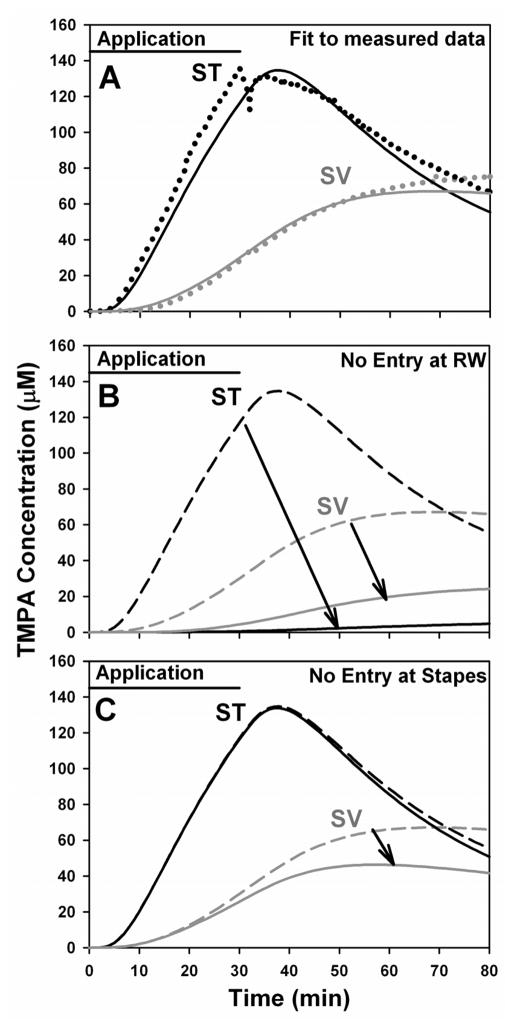
The effect of occluding the RW membrane on simultaneously-measured ST and SV concentrations is shown in Figure 4. In these experiments, TMPA increase was greater in SV than ST and the increase in both scalae occurred with relatively slow time courses. For both scalae the maximum rates of concentration increase occurred well after the application finished and a peak concentration was not reached within the observation time. These data qualitatively demonstrate that in the non-occluded condition, the greater, faster entry into ST was accounted for by entry through the RW membrane. The higher concentrations observed in SV relative to ST with the RW membrane occluded also confirm that in this condition TMPA was directly entering the vestibule. The slower time courses under this condition are accounted for by the greater distance between the recording sites and the site of TMPA entry at the stapes. Nevertheless, quantitative analyses of these experiments reveals that this experimental design has very limited capability to quantify the amount of TMPA entry occurring at the stapes. Figure 5A shows simulation of one of the experiments in which the RW membrane was not occluded (data taken from Figure 3A). In this calculation, rates of TMPA entry at the RW and at the stapes were adjusted to match the concentration time courses at locations corresponding to the two basal turn recording sites. A best fit was obtained with 1.52 nMoles entering the ear via the RW membrane and 0.99 nMoles entering in the region of the stapes, corresponding to 60.4% and 39.6 % of the total entry respectively. The quantitative accuracy of this interpretation is uncertain, however, as simulations of occluded conditions demonstrate. Figure 5B shows the calculated curves for identical model parameters, but with no entry at the RW. In agreement with the animal measurements presented above in Figures 3 and 4, the calculated concentration in ST is highly sensitive to RW occlusion, and is reduced by 96% while the SV curve is reduced to a lesser degree (by 62%). The simulations confirm that recordings from basal turn sites are highly sensitive to the alteration of the amount of drug entering ST through the RW membrane.
Figure 4.
TMPA entry with the RW membrane occluded. Two experiments are shown in which TMPA concentration was monitored simultaneously in scala tympani (ST) and scala vestibuli (SV) of the basal cochlear turn during irrigation of the RW niche with TMPA solution after the RW membrane had been occluded with silicone. For the experiment shown in panel A, measured levels were very low, so in later experiments (Panel B) a higher TMPA concentration (20 mM) was applied, accounting for higher recorded levels. In both cases, SV concentration is higher than that in ST and the time course of change is slow with the peak concentration not reached during the observation time. These curves are explained by a predominantly direct entry of TMPA into the vestibule in the vicinity of the stapes. The time course in SV is slow because the recording electrode is quite distant from the stapes (See Figure 1)
Figure 5.
A: Computer simulation of the non-occluded data from Figure 3A, shown as dotted lines. The solid lines show the curves calculated by the computer model at the two recording sites with permeability values of the RW membrane and of the stapes adjusted to fit the measured curves. The fitted curves were obtained with 60.4 % of the TMPA entering at the RW membrane and 39.6 % entering at the stapes. B: Simulated curves with identical parameters but with all entry at the RW membrane turned off, leaving only entry at the stapes. The concentration time course at the ST site is greatly reduced and occurs more slowly than in non-occluded animals. The concentration in SV is also markedly reduced. These curves compare well to those shown for the RW-occluded condition in Figure 4. C: Simulated curves with identical parameters as (A) but with all entry at the stapes turned off, leaving only entry at the RW. The concentration time course at the SV site is reduced a little but the time course at the ST site is largely unaffected. RW membrane occlusion (panel B) has a greater influence on basal turn recordings for multiple reasons including i) the majority of TMPA is entering there; ii) the ST volume is smaller than that of the vestibule (causing larger concentration changes for the same amount of solute entry) and iii) because the ST recording site is closer to the RW membrane than the SV recording site is to the stapes (as shown in Figure 1).
In contrast, Figure 5C shows the calculated time courses for identical parameters to Figure 5A, including entry at the RW membrane but excluding TMPA entry at the stapes. In this case the concentration time course in ST is almost unchanged by the “stapes occlusion”, reduced by only 0.8%, and the concentration in SV is reduced moderately by 31%. This simulation shows that when RW entry is present, the time course in SV is dominated by inter-scala communication between ST and SV, and entry at the stapes plays a relatively minor role. These major differences between the effects of RW and stapes occlusion arise partially because, for the same amount of solute entry into both scalae, concentration changes in ST will be greater than those in SV due to the smaller volume of the basal turn in ST. In addition, due to the anatomy of the basal part of the cochlea as shown in Figure 1, the basal turn electrode in SV is at greater distance from the stapes entry site than the basal turn ST electrode is from the RW membrane. This results in lower and slower time courses in SV that are difficult to distinguish from indirect entry via ST. The simulations therefore show that it would be difficult to quantify TMPA entry at the stapes accurately by basal turn measurements of this type as the measured curve in SV is dominated by inter-scala communication. With inter-animal variation superimposed, it was felt that quantification of entry at the stapes would likely not be accurate by this method. As a result of this analysis, we chose to not perform comparable measurements in animals with and without stapes occlusions. This is an example in which the computer simulations prevented us from performing animal experiments that would have been difficult to interpret.
3.2 Analysis of sequential fluid samples taken from the lateral semi-circular canal
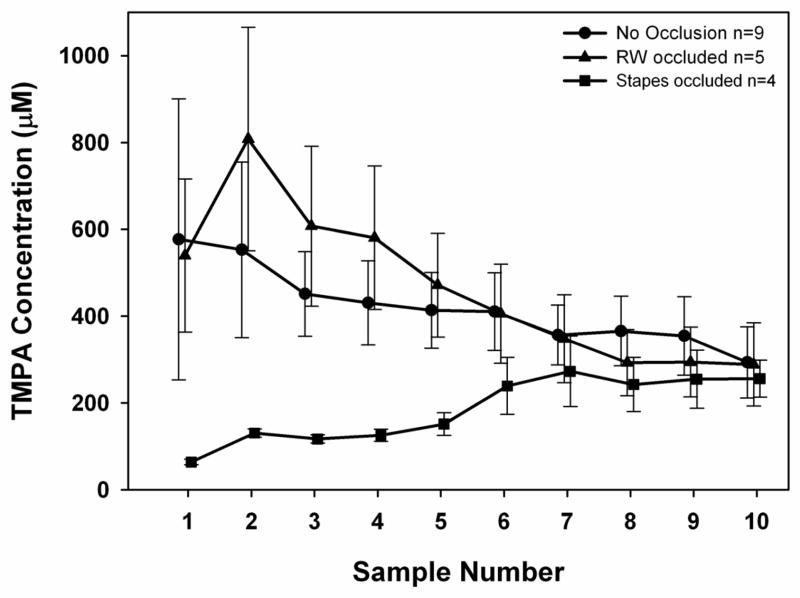
In order to quantify TMPA entry at the stapes, it was necessary to measure concentration in the perilymph of the vestibule under conditions where indirect entry via the RW membrane and ST was limited. The procedure of taking sequential samples from the lateral semi-circular canal allows reliable determination of the initial samples that originate from the perilymph of the semicircular canal and vestibule. Samples were taken after a 30 min application to the RW niche, a brief enough time to ensure that the TMPA content of perilymph in the vestibule was dominated by local entry with only limited influence of inter-scala communication. Entry was compared for the normal, non-occluded RW niche and for animals in which the RW membrane or the stapes area were occluded with silicone. The data for the three conditions are summarized in Figure 6. With no occlusion, the TMPA concentrations of sequential samples were fairly uniform with a progressive decrease in later samples. Occluding the stapes area with silicone resulted in notably lower TMPA concentrations in the initial samples (representing perilymph from the vestibule and SV), while the later samples, originating from perilymph in ST were only slightly lower than in the normal state. This finding qualitatively demonstrates a substantial entry of TMPA into the vestibule in the region of the stapes. In contrast, occluding the RW membrane had only a marginal influence on the sample curves.
Figure 6.
Summary of sequential sample data, with 10 fluid samples taken from the lateral canal after 30 mins irrigation of the RW niche, with and without occlusion of entry sites. Bars indicate SEM. With no occlusions, initial samples, primarily originating from the vestibule, are high with a downtrend towards the later samples that originate from ST. Occluding the RW membrane had little influence, except samples 2–4 tended to be higher (though not significantly so, ANOVA, comparing 2 occluded groups with control, non-occluded group) and samples 8–9 tended to be lower. In contrast, occluding the stapes area had a major influence on the initial samples originating in the vestibule (significant, p <0.001, ANOVA), and only minor influence on later samples, originating in ST.
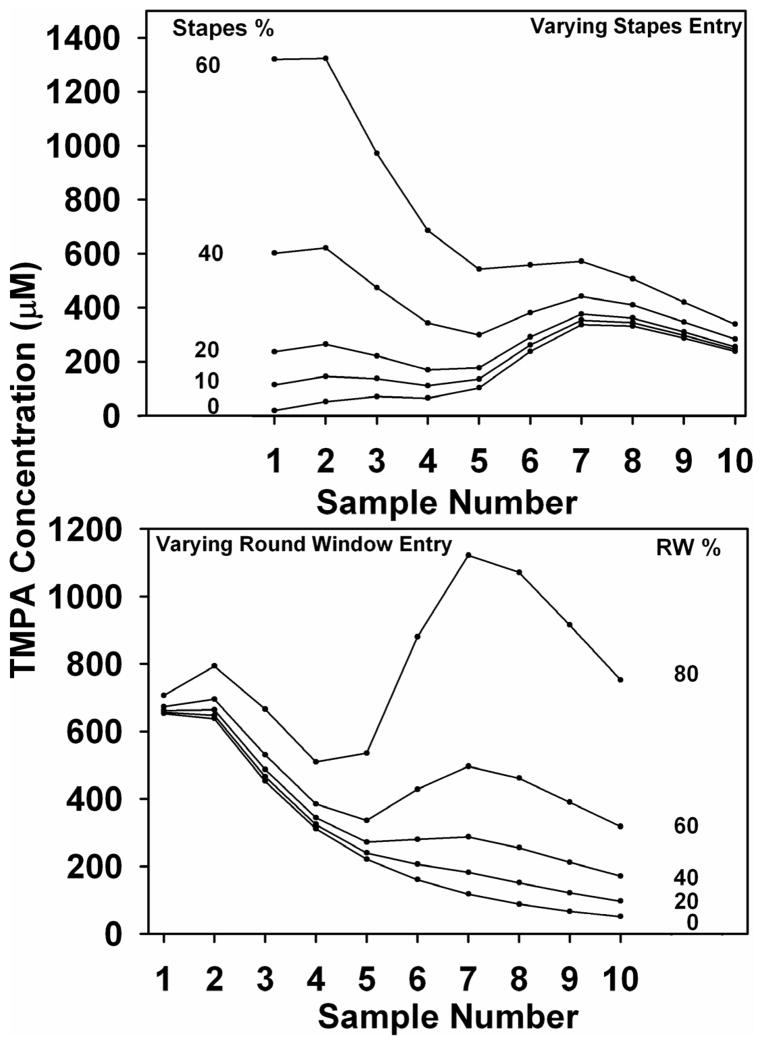
Quantitative interpretation of these data was again provided by simulations in which entry at the RW membrane and at the stapes were independently varied. In the upper panel of Figure 7, sample concentrations were calculated as entry near the stapes was varied while entry at the RW was held constant at a value representing the average non-occluded permeability. The initial samples are demonstrated to be highly sensitive to variation in the amount of entry at the stapes. Similarly, in the lower panel of Figure 7, sample concentrations were calculated as RW entry was varied and stapes permeability was held constant. By comparing these curves with the measured data it is qualitatively apparent that the proportion of TMPA entering the vestibule in the vicinity of the stapes was appreciable at approximately 30 – 40%.
Figure 7.
Computer simulations showing the effect on samples of varying permeability at one location while holding the other constant at a value based on the mean measured entry rate. In the upper panel, stapes entry is varied while keeping RW permeability constant. In the lower panel, RW entry is varied while holding stapes permeability constant. For each condition, entry at the site manipulated is shown as a percentage of the total TMPA entry at the RW and stapes combined. As stapes entry is varied, the initial samples, originating from the vestibule are markedly affected. Similarly, as RW entry is varied the later samples are most affected. This demonstrates that the canal sampling method should be sensitive to entry at both RW and stapes sites. It is also apparent that varying stapes entry has a small influence on later samples and varying RW entry has a small influence on early samples. This is due to the local communications between the perilymphatic scalae that are included in the model.
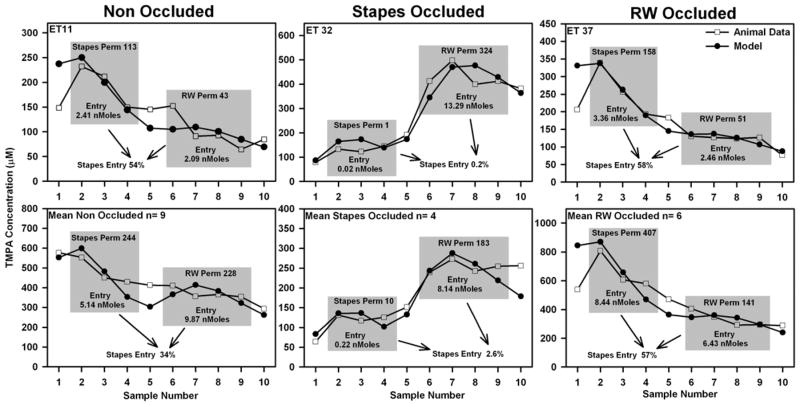
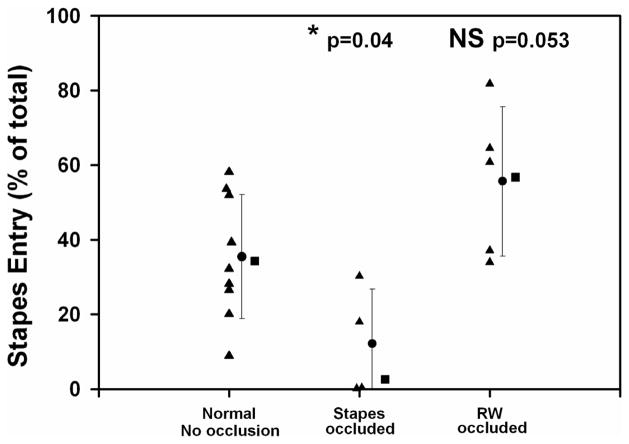
A more detailed analysis used simulations to fit the sample data for individual experiments and for the group means for each condition. Examples for each condition, and fits to the mean curve for each group as shown in Figure 8. For these calculations, the specific sample volumes and collection rates from each experiment, or the group mean rates as appropriate, were used. TMPA entry rates at the RW membrane and stapes were adjusted until the mean concentration for the calculated samples (samples 2 to 4 for stapes entry and samples 6 to 9 for RW entry, as indicated by the shaded boxes in the figure) was within 0.5 μM of the measured data. When the permeabilities were appropriately adjusted, the simulation provided the Molar entry at the RW and stapes entry sites, as shown on the figure, from which the relative entry at the stapes was calculated as a percentage of the total entry at the two sites. This analysis was performed for each experiment and the results are summarized in Figure 9. For the non-occluded experiments the average TMPA entry at the stapes averaged 35.4 % of the total, with the balance, 64.6%, entering at the RW membrane. When the stapes area was occluded with silicone it was determined that only 12.2 % entered by this route, a value that was significantly lower than the control group (ANOVA test with 3 groups, Holm-Sidak method for multiple comparisons against the control (non-occluded) group, p=0.04). With the RW membrane occluded it was estimated that 55.6 % of the TMPA entry occurred at the stapes, a value which was higher than the non-occluded state but not significantly so (p=0.053). The parameter values derived by simulating the group mean curves for each condition were quantitatively similar to the average of these simulations of individual experiments, as shown by the square symbols in Figure 9.
Figure 8.
Computer simulation of individual experiments (top row) and the group mean data (lower row) for the three experimental groups in which sequential fluid samples were taken from the lateral semi-circular canal. In each case, the RW and stapes permeabilities (shown with units of 10−9 m/s) were adjusted until differences between calculated and sample data (samples within the shaded boxes) were minimized. As part of this calculation, the model determined the Molar entry at each site (as shown on each shaded box), from which the proportion of entry occurring at the stapes (expressed as a percentage of the combined, total entry at both sites) was calculated.
Figure 9.
Proportion of TMPA entry occurring in the stapes area derived from simulations of the experiments for the three experimental groups. Triangles: Simulation results fitted to individual experiments using sample volumes and times for the specific experiment. Circles: Mean and SD of the fits to individual experiments. Squares: Entry derived by simulation of the group mean sample curves for each condition using sample volumes and times averaged for the specific group. Significance of findings was assessed by a single ANOVA test (3 groups) for multiple comparisons versus a control (non-occluded) group (Holm-Sidak method). The proportion of entry through the stapes was significantly lower when the stapes was occluded and was higher when the RW membrane was occluded, but not significantly so.
4.0 Discussion
This study confirms that for local, intratympanic applications of drugs, entry into the ear occurs both through the RW membrane and directly into the vestibule at a site near the stapes. For the TMPA marker used here we estimated that, in the normal animal, 35% entered the ear directly into the vestibule at a location near the stapes. In a prior study using MR imaging to detect Gd distribution in the ear (King et al., 2011), it was estimated that 90% of the Gd entered perilymph near the stapes. The substantial difference between these two estimates raises the possibility that the rates of entry by each route is substance-dependent. For example, Gd could be proportionately less permeable through the RW membrane or more permeable at the stapes than is TMPA. However, it is also possible that the many methodological differences between the studies could contribute to the difference. Whether the proportion entering by different routes is substance-specific therefore remains uncertain until data for more substances are collected.
For the cochlea, the influence of drug entry at the stapes may be relatively minor in the initial stages of drug loading. Inter-scala communication occurs quite readily, as shown by basal turn recordings, so concentration differences between the scalae will tend to be equalized over time. Calculations for basal turn recordings show concentrations are only affected to a minor degree by entry at the stapes (Figure 5C). Due to the geometry of the basal turn, in which the distance from the mid-basal turn of SV to the stapes is greater than from the mid-basal turn of ST to the RW membrane, concentrations for both scalae are dominated by entry through the RW membrane. The same conclusion will apply to locations apical to the measurement regions as well. Theoretically, the additional direct entry of drug into the vestibule should result in higher levels in ST as the vestibule represents less of a “sink” for drug distribution. In reality, the variability in RW permeability between animals will have a much greater influence on the actual drug level achieved in ST. In contrast, after the inner ear is loaded with drug, the subsequent decline of concentration with time will depend on whether the vestibule was also loaded. This is apparent in Figure 5C which shows the decline of concentration with time is faster for both ST and SV when there is no entry at the stapes. This is because when it is not loaded with drug the vestibule acts as a “sink”, with drug or marker diffusing into the lower concentration perilymph there. It is therefore apparent that the influence of drug entry at the stapes on cochlear pharmacokinetics is rather subtle. For substances with a higher entry proportion at the stapes than TMPA (such as Gd) these effects on cochlear fluid levels concentrations will be of greater importance.
The relevance of drug entry at the stapes is of far greater importance to the vestibular perilymph level of drug, as clearly demonstrated in the sequential sampling experiments. As a result, the concentration of drugs in perilymph of the vestibule may be considerably higher than previously recognized based on entry only through the RW membrane. This may be relevant to drugs that act on vestibular function, such as gentamicin. It was previously assumed that gentamicin primarily reached the vestibule indirectly via ST, so the levels in the vestibule would always be expected to be lower than those at the basal turn of ST. If gentamicin enters the vestibule directly, this may result in higher drug levels in the vestibule than in the cochlea, which may account for vestibulotoxic effects with application protocols that spare hearing. Few studies have compared vestibular and cochlear drug levels, or vestibular and cochlear effects of gentamicin. Imamura and Adams (2003) used an immunochemical assay of gentamicin (in fixed, decalcified tissues) and noted that usually both the cochlear and vestibular organs were stained. In some animals however, not all the vestibular organs were stained, suggesting lower gentamicin levels there. Measurements of gentamicin concentrations in vestibular perilymph of humans following intratympanic applications show low levels which averaged 0.034% of the applied concentration for samples taken at 1–2 hours after the application. (Becvarovski et al, 2002). These levels were comparable or lower to those typically found in ST perilymph in animal studies (Hoffer et al., 2001; Plontke et al., 2007), although perilymph measures depend highly on the application and perilymph sampling protocols. But at present there seems to be no strong evidence that gentamicin reaches substantially higher levels in vestibular, compared to cochlear perilymph. This possibility needs to be addressed in future studies.
The precise site of substance entry in the vicinity of the stapes also remains to be determined. Potential permeable sites include the thin bone of the stapes footplate or the cartilaginous annular ligament of the oval window (Tanaka and Motomura 1981). It remains unknown whether the entry properties at these sites are an intrinsic property of the tissues involved or whether entry is limited by the overlying membranes at the middle ear and perilymph boundaries of the structure. If the situation is comparable with the RW membrane, it is believed that permeability is restricted by the epithelial membrane at the middle ear surface of the structure. This is consistent with observations that permeability of the RW membrane is influenced by middle ear manipulations (Mikulec et al, 2008). It also remains possible that some entry could occur through the bone between the middle ear and the spiral ligament. The thin bone of the otic capsule has been shown to be permeable to intratympanically applied substances (Mikulec et al., 2009). But in the absence of data supporting this mechanism, we have presently confined our analyses to the assumption that two primary entry sites exist, specifically the RW membrane and the stapes.
The relevance of our findings to intratympanic drug delivery in humans depends specifically on how the drugs are applied. In the guinea pig, drugs applied to the RW niche also typically contact the stapes footplate, but in humans the stapes is considerably more distant from the RW niche. This allows drugs to be applied specifically to the RW membrane in humans (e.g. Becvarovski, 2002). However, the most common current approach to clinical intratympanic delivery is to fill the entire middle ear cavity with 0.5 – 1 ml of drug solution (e.g. Bird et al, 2011, Rauch et al., 2011). With this type of protocol, the possibility of entry at both the RW membrane and in the area of the stapes must be considered possible. The relative amount of entry at the two sites cannot be estimated for any species based on anatomic data presently available for the RW and stapes because, as discussed above, permeability of the drug is likely to depend on the properties of the membranes bounding these structures and not on the thickness or other dimensions of the structures themselves. The possibility of substances entering through the stapes in humans is supported by qualitative studies by Zou et al. (2005), in which the vestibule and semi-circular canals of humans were observed to be bright (indicating relatively high Gd concentration) 2 hours after intratympanic application of 0.5 ml of Gd solution. This observation would only be expected if Gd entered the human labyrinth at the stapes, as it does in guinea pigs. We must therefore conclude that the concentration of many drugs in perilymph of the vestibule of humans will be higher than we had previously assumed, based only on entry through the RW membrane. This issue can only be fully resolved by measurements of perilymph drug concentrations in humans.
The method of taking sequential samples of perilymph from the cochlear apex has proven to be valuable for documenting gradients of drugs in the inner ear (Mynatt et al, 2006, Plontke et al., 2007, Plontke et al., 2008). The sampling procedure relies on the mechanical disturbance caused by perforation of the otic capsule and release of intracochlear pressure. As a result of the decrease in perilymph pressure, CSF, driven by intracranial pressure, enters the basal turn of ST through the cochlear aqueduct and displaces perilymph towards the site of the perforation. When the cochlea is sampled from the apex, this results in the perilymph throughout the length of ST being displaced over time. For perforations at the lateral canal, perilymph from the canal, the vestibule, SV and ST are displaced from the perforation site with time. This provides a valuable tool for the study of perilymph pharmacokinetics. It is important to recognize, however, that throughout the sampling process the fluids are interacting with adjacent tissue structures. Computer simulations (such as the program we have made available) that take into account the flows and fluid/tissue interactions are valuable in the quantitative interpretation of such data.
Both in vivo measurements in the basal turn of SV and ST, and data from fluid samples taken from the lateral canal, support the view that a local entry of TMPA into the vestibule occurs in the normal animal. The fact that measured basal turn SV levels are greater than those in ST when the RW membrane was occluded is consistent with an entry path primarily into the vestibule under this condition. However, the two experimental methods presented here differ in their ability to resolve entry at different locations. Basal turn recordings with ion-selective electrodes are sensitive to changes in RW entry and insensitive to changes in entry at the stapes. In contrast, lateral canal sampling is sensitive to changes in stapes entry and less sensitive to changes in entry at the RW membrane.
The stapes and RW membrane occlusion procedures used here had a dramatic influence on entry at the specific location. Nevertheless, it cannot be assumed that all occlusions are completely effective and that a residual entry at some rate does not persist. At present, it cannot be determined whether the residual entry at the location indicated by the analysis of sample data represented incomplete occlusion or whether it represented a limitation of the measurement and/or analysis techniques. We found that it was necessary to first dry the area with suction in order to occlude the stapes adequately. It is likely that the degree of occlusion achieved in any study will depend on the exact procedures used for occlusion. In summary, drugs applied intratympanically cannot be assumed to enter the ear only via the RW membrane. In guinea pigs, a significant proportion, from 35% (TMPA) to 90% (Gadolinium), enters the vestibule directly in the region of the stapes. Based on studies that used gadolinium as a marker in humans, it has to be considered that drugs may enter the ear in the vicinity of the stapes in both experimental animals and humans.
Locally-applied drugs enter the ear through both the round and oval windows
For the marker, TMPA, applied intratympanically, 33% enters at the stapes.
Intratympanic applications give higher than expected concentrations in the vestibule.
Acknowledgments
This work was supported by research grant DC01368 from NIDCD, NIH. Dr. Salt is a member of the Scientific Advisory Board of Otonomy, Inc. and may receive income based on equity holdings. Otonomy did not financially support this study.
Abbreviations
- CSF
cerebrospinal fluid
- Gd
gadolinium
- HRP
horseradish peroxidase
- MR
magnetic resonance
- RW
round window
- SV
scala vestibule
- ST
scala tympani
- TMPA
trimethylphenylammonium
Footnotes
Publisher's Disclaimer: This is a PDF file of an unedited manuscript that has been accepted for publication. As a service to our customers we are providing this early version of the manuscript. The manuscript will undergo copyediting, typesetting, and review of the resulting proof before it is published in its final citable form. Please note that during the production process errors may be discovered which could affect the content, and all legal disclaimers that apply to the journal pertain.
6.0 References
- Becvarovski Z, Bojrab DI, Michaelides EM, Kartush JM, Zappia JJ, LaRouere MJ. Round window gentamicin absorption: an in vivo human model. Laryngoscope. 2002;112:1610–1613. doi: 10.1097/00005537-200209000-00015. [DOI] [PubMed] [Google Scholar]
- Bird PA, Murray DP, Zhang M, Begg EJ. Intratympanic versus intravenous delivery of dexamethasone and dexamethasone sodium phosphate to cochlear perilymph. Otol Neurotol. 2011;32:933–936. doi: 10.1097/MAO.0b013e3182255933. [DOI] [PubMed] [Google Scholar]
- Goycoolea MV, Lundman L Round window membrane. Structure function and permeability: a review. Microsc Res Tech. 1997;36:201–211. doi: 10.1002/(SICI)1097-0029(19970201)36:3<201::AID-JEMT8>3.0.CO;2-R. [DOI] [PubMed] [Google Scholar]
- Goycoolea MV, Paparella MM, Goldberg B, Carpenter AM. Permeability of the round window membrane in otitis media. Arch Otolaryngol. 1980a Jul;106(7):430–3. doi: 10.1001/archotol.1980.00790310054014. [DOI] [PubMed] [Google Scholar]
- Goycoolea MV, Paparella MM, Juhn SK, Carpenter AM. Oval and round window changes in otitis media. Potential pathways between middle and inner ear. Laryngoscope. 1980b;90:1387–1391. [PubMed] [Google Scholar]
- Hoffer ME, Allen K, Kopke RD, Weisskopf P, Gottshall K, Wester D. Transtympanic versus sustained-release administration of gentamicin: kinetics, morphology, and function. Laryngoscope. 2001;111:1343–1357. doi: 10.1097/00005537-200108000-00007. [DOI] [PubMed] [Google Scholar]
- Höft J. The permeability of the round window membrane and its changes by pantocaine (tetracaine) Arch Klin Exp Ohren Nasen Kehlkopfheilkd. 1969;193:128–37. [PubMed] [Google Scholar]
- Imamura S, Adams JC. Changes in cytochemistry of sensory and nonsensory cells in gentamicin-treated cochleas. J Assoc Res Otolaryngol. 2003;4:196–218. doi: 10.1007/s10162-002-2037-7. [DOI] [PMC free article] [PubMed] [Google Scholar]
- King EB, Salt AN, Eastwood HT, O’Leary SJ. Direct entry of gadolinium into the vestibule following intratympanic applications in guinea pigs and the influence of cochlear implantation. J Assoc Res Oto. 2011 June; doi: 10.1007/s10162-011-0280-5. in press. [DOI] [PMC free article] [PubMed] [Google Scholar]
- Lundman L, Bagger-Sjöbäck D, Holmquist L, Juhn S. Round window membrane permeability. An in vitro model. Acta Otolaryngol Suppl. 1987;442:41–3. doi: 10.3109/00016488709102837. [DOI] [PubMed] [Google Scholar]
- Mikulec AA, Hartsock JJ, Salt AN. Permeability of the round window membrane is influenced by the composition of applied drug solutions and by common surgical procedures. Otol Neurotol. 2008;29:1020–1026. doi: 10.1097/MAO.0b013e31818658ea. [DOI] [PMC free article] [PubMed] [Google Scholar]
- Mikulec AA, Plontke SK, Hartsock JJ, Salt AN. Entry of substances into perilymph through the bone of the otic capsule following intratympanic applications in guinea pigs: Implications for local drug delivery in humans. Otol Neurotol. 2009;30:131–138. doi: 10.1097/mao.0b013e318191bff8. [DOI] [PMC free article] [PubMed] [Google Scholar]
- Mynatt R, Hale SA, Gill RM, Plontke SKR, Salt AN. Demonstration of a longitudinal concentration gradient along scala tympani by sequential sampling of perilymph from the cochlear apex. J Assoc Res Otolaryngol. 2006;7:182–193. doi: 10.1007/s10162-006-0034-y. [DOI] [PMC free article] [PubMed] [Google Scholar]
- Plontke SKR, Wood AW, Salt AN. Analysis of gentamicin kinetics in fluids of the inner ear with round window administration. Otology and Neurotology. 2002;23:967–974. doi: 10.1097/00129492-200211000-00026. [DOI] [PubMed] [Google Scholar]
- Plontke SK, Mynatt R, Gill RM, Salt AN. Concentration gradient along scala tympani following the local application of gentamicin to the round window membrane. Laryngoscope. 2007;117:1191–1198. doi: 10.1097/MLG.0b013e318058a06b. [DOI] [PMC free article] [PubMed] [Google Scholar]
- Plontke SK, Biegner T, Kammerer B, Delabar U, Salt AN. Dexamethasone concentration gradients along scala tympani after application to the round window membrane. Otol Neurotol. 2008;29:401–406. doi: 10.1097/MAO.0b013e318161aaae. [DOI] [PMC free article] [PubMed] [Google Scholar]
- Rauch SD, Halpin CF, Antonelli PJ, Babu S, Carey JP, Gantz BJ, Goebel JA, Hammerschlag PE, Harris JP, Isaacson B, Lee D, Linstrom CJ, Parnes LS, Shi H, Slattery WH, Telian SA, Vrabec JT, Reda DJ. Oral vs intratympanic corticosteroid therapy for idiopathic sudden sensorineural hearing loss: a randomized trial. JAMA. 2011;305:2071–2079. doi: 10.1001/jama.2011.679. [DOI] [PubMed] [Google Scholar]
- Saijo S, Kimura RS. Distribution of HRP in the inner ear after injection into the middle ear cavity. Acta Otolaryngol. 1984;97:593–610. doi: 10.3109/00016488409132937. [DOI] [PubMed] [Google Scholar]
- Salt AN, Ohyama K, Thalmann R. Radial communication between the perilymphatic scalae of the cochlea. I. Estimation by tracer perfusion. Hear Res. 1991a;56:29–36. doi: 10.1016/0378-5955(91)90150-8. [DOI] [PubMed] [Google Scholar]
- Salt AN, Ohyama K, Thalmann R. Radial communication between the perilymphatic scalae of the cochlea. II. Estimation by bolus injection of tracer into the sealed cochlea. Hear Res. 1991b;56:37–43. doi: 10.1016/0378-5955(91)90151-x. [DOI] [PubMed] [Google Scholar]
- Salt AN, Ma Y. Quantification of solute entry into cochlear perilymph through the round window membrane. Hear Res. 2001;154:88–97. doi: 10.1016/s0378-5955(01)00223-4. [DOI] [PubMed] [Google Scholar]
- Salt AN, Plontke SK. Local inner-ear drug delivery and pharmacokinetics. Drug Discov Today. 2005;10:1299–1306. doi: 10.1016/S1359-6446(05)03574-9. [DOI] [PMC free article] [PubMed] [Google Scholar]
- Salt AN, Hale SA, Plontke SKR. Perilymph sampling from the cochlear apex: a reliable method to obtain higher purity perilymph samples from scala tympani. J Neurosci Methods. 2006;153:121–129. doi: 10.1016/j.jneumeth.2005.10.008. [DOI] [PMC free article] [PubMed] [Google Scholar]
- Salt AN, Gill RM, Plontke SK. Dependence of Hearing Changes on the Dose of Intratympanically-Applied Gentamicin: A Metaanalysis Using Mathematical Simulations of Clinical Drug Delivery Protocols. Laryngoscope. 2008;118:1793–1800. doi: 10.1097/MLG.0b013e31817d01cd. [DOI] [PMC free article] [PubMed] [Google Scholar]
- Salt AN, Hartsock J, Bretan M, Gill R. Evaluation of a Ten-Compartment Computer Model of the Inner Ear Fluid Spaces. 34th Midwinter Research Meeting of the ARO; Baltimore, USA. 2011. Abstract #854 ( www.aro.org) [Google Scholar]
- Smith BM, Myers MG. The penetration of gentamicin and neomycin into perilymph across the round window membrane. Otolaryngol Head Neck Surg. 1979;87:888–891. doi: 10.1177/019459987908700625. [DOI] [PubMed] [Google Scholar]
- Tanaka K, Motomura S. Permeability of the labyrinthine windows in guinea pigs. Arch Otorhinolaryngol. 1981;233:67–75. doi: 10.1007/BF00464276. [DOI] [PubMed] [Google Scholar]
- Yoshioka M, Naganawa S, Sone M, Nakata S, Teranishi M, Nakashima T. Individual differences in the permeability of the round window: evaluating the movement of intratympanic gadolinium into the inner ear. Otol Neurotol. 2009;30:645–648. doi: 10.1097/MAO.0b013e31819bda66. [DOI] [PubMed] [Google Scholar]
- Zou J, Pyykkö I, Bjelke B, Dastidar P, Toppila E. Communication between the perilymphatic scalae and spiral ligament visualized by in vivo MRI. Audiol Neurootol. 2005;10:145–152. doi: 10.1159/000084024. [DOI] [PubMed] [Google Scholar]
- Zou J, Ramadan UA, Pyykkö I. Gadolinium uptake in the rat inner ear perilymph evaluated with 4.7 T MRI: a comparison between transtympanic injection and gelatin sponge-based diffusion through the round window membrane. Otol Neurotol. 2010;31:637–641. doi: 10.1097/MAO.0b013e3181d2f095. [DOI] [PubMed] [Google Scholar]


