

Abstract
Spectral Cytopathology (SCP) is a novel approach for disease diagnosis that utilizes infrared spectroscopy to interrogate the biochemical components of cellular samples and multivariate statistical methods, such as principal component analysis, to analyze and diagnose spectra. SCP has taken vast strides in its application for disease diagnosis over the past decade; however, fixation induced changes and sample handling methods are still not systematically understood. Conversely, fixation and staining methods in conventional cytopathology, typically involving protocols to maintain the morphology of cells, have been documented and widely accepted for nearly a century. For SCP, fixation procedures must preserve the biochemical composition of samples so that spectral changes significant to disease diagnosis are not masked. We report efforts to study the effects of fixation protocols commonly used in traditional cytopathology and SCP including fixed and unfixed methods applied to exfoliated oral (buccal) mucosa cells. Data suggest that the length of time in fixative and duration of sample storage via desiccation contribute to minor spectral changes where spectra are nearly super-imposable. These findings illustrate that changes influenced by fixation are negligible in comparison to changes induced by disease.
Keywords: cytopathology, fixation, infrared spectroscopy (IR), principal component analysis (PCA), spectral cytopathology (SCP)
INTRODUCTION
The diagnosis of exfoliated cells by spectral methods holds enormous promise for the early detection and classification of tumors of the oral and nasopharyngeal cavities, cervix, lung, esophagus, pancreas and many other organs. For these organs, cells may be obtained by direct scraping, washing (lavages), or fine needle aspiration; however, classical cytology is often restricted by low sensitivity and/or specificity.1-3 During the past decade, methods have been refined in which the biochemical composition of cells is used for the detection and diagnosis of abnormalities, rather than morphological parameters, staining patterns or immunohistochemistry.4-9 The cellular composition can be determined by a number of physico-chemical means, for example, mass spectrometry or spectroscopic methods. One of the spectral methods, which we refer to as spectral cytopathology (SCP), uses mid-infrared micro-spectroscopy of individual cells to determine cellular biochemical composition, and multivariate methods for the analysis of the spectral data.10
Infrared spectroscopy is an ideal technique for diagnostics since it is a label-free method, i.e. it uses an inherent optical property, namely the infrared absorption spectrum, as a primary observable. It is a mature technique requiring minimal sample preparation and measures a global change in biochemical composition, in contrast to proteomic methods such as mass spectrometry, which yields a very detailed change of individual protein components. Since infrared spectroscopy is a non-destructive technique, cells can be stained following standard cytological protocols subsequent to infrared data acquisition; thus, spectral and classical methods of cytopathology can be compared and correlated side-by-side to establish sensitivity and specificity of the two methodologies.11
In contrast to classical cytopathology, where sample fixation and staining methods have been documented for nearly a century,12,13 effects of fixation and storage of cells for SCP are still largely unknown. Care has to be taken in SCP method development to ascertain that fixation procedures do not introduce changes in chemical composition that may mask the spectral changes due to disease. Furthermore, certain methods of fixation may be acceptable in SCP yet unacceptable in classical cytology. For example, the rapid drying of cells attached to a substrate will not allow efficient uptake of immunohistochemical stains, which destroys the ability to scrutinize a sample by means of biochemical markers or cellular morphology but will minimally affect biochemical composition. Other fixation procedures may have an opposite effect where the overall morphology appears intact, yet the biochemical composition changes in such a way that spectral measurements are perturbed.14
In this contribution, we report efforts to study the effects of fixation methods that are commonplace in cytology: fixation by buffered formalin solution or by a commercial mixture of alcohols (the SurePath® method). These two fixation methods are compared with rapid drying (desiccation) of the cellular samples followed by immediate spectral data acquisition. In this study, we used exfoliated oral mucosa (buccal) cells, harvested from the inside of the cheek, in order to establish which fixation method is best to maintain biochemical composition of the samples. Another goal of this study was to establish changes in spectral patterns between fixed and dried cells, as a function of fixation time and at several time points after fixation. Furthermore, we aimed to dispel the notion that fixation (or the lack of it) causes large spectral changes.15 Spectroscopic changes reported in the past were most likely due to morphological differences in cells that can lead to scattering effects and changes in band shapes and frequency positions (see the second topic in ‘Discussion’).16 We demonstrate that the three methods of sample preparation (buffered formalin solution, SurePath® alcohol mixture and rapid desiccation) do produce minor spectral changes, and that cells left for prolonged times in fixative solutions exhibit slight spectral changes. This knowledge will define the best procedures for future applications of SCP.
MATERIALS AND METHODS
Sample collection
Oral mucosa cells were exfoliated from the inside of the cheek from laboratory volunteers using cytobrushes. These cytobrushes were then immersed immediately into the appropriate solution: SurePath® [TriPath, Burlington, NC USA], phosphate-buffered formalin (10 % buffered solution) [Sigma-Aldrich, St. Louis, MO USA], or phosphate buffered saline (PBS) [ATCC, Manassas, VA USA] to wash the cells to be rapidly dried and desiccated. After appropriate exposure to these solutions (see Table 1), cells were vortexed off the brushes into the surrounding solution, centrifuged, washed with Hank’s Balanced Salt Solution (BSS) [ATCC, Manassas, VA USA] and spin-deposited onto CaF2 [Sigma-Aldrich, St. Louis, MO USA] substrates.□ The exact protocols for fixation are presented below, see Sample preparation protocols.
Table 1.
Experimental design including fixatives and exposure times for exfoliated cellular specimens
| Oral(buccal)mucosa cells, exfoliated |
||||
|---|---|---|---|---|
| Exposure Time Fixative |
24 hours |
1 week |
2 weeks |
4 weeks |
| Superpath® | A | B | C | D |
| Formalin | E | F | G | H |
| Unfixed | *I | -- | -- | -- |
Fixed Samples:
Oral mucosa cells exfoliated from the inside of the cheek were stored in individual vials containing the appropriate fixative for their allowed exposure time.
At the end of each exposure time, exfoliated cells were washed with BSS, spin deposited on to CaF2 windows, air-dried under a clean, dry air stream and then desiccated for 24 hours before data acquisition.
Unfixed Sample:
Sample immersed in PBS, washed twice with BSS and spin deposited onto a CaF2 window, airdried then desiccated.
Windows exposed to fixative for 24 hours (A and E), including the unfixed sample (I), were desiccated after the first data collection (24 hours) and data were re-collected for each time point thereafter.
Fixative composition
The fixatives used for this study were selected due to their common application in conventional cytopathology and SCP efforts.4-5, 17 The SurePath® methodology is used by our medical collaborators at Tufts Medical Center, Boston, MA; thus it has been routinely used in our laboratory as well. The SurePath® solution is composed of aqueous ethanol (24%), methanol and isopropanol (both 1%). The Surepath process removes some lipids and phospholipids, which are alcohol-soluble, and renders proteins insoluble via dehydration.
Phosphate-buffered formalin solution contains 4% aqueous formaldehyde, 1.5% methanol, and less than 1% of both disodium hydrogen orthophosphate and sodium dihydrogen orthophosphate monohydrate. Formalin cross-links primary amino groups using a nearby nitrogen atom.18 Thus, all procedures used here slightly alter the native protein’s structure, to a precipitated, dehydrated and/or cross-linked state. Although complete dehydration seems advantageous for composition-based diagnostic methods, such as SCP, it may produce significant changes in cell morphology and, therefore, aggravates correlation between SCP and traditional cytopathology.
Sample preparation protocols
Samples referred to in this paper as “unfixed” (desiccated), were left in PBS for 20 minutes, washed twice with BSS prior to spin deposition onto the CaF2 slides, then quickly air-dried under a clean, dry air stream and immediately stored in a desiccator for 24 hours until the first data acquisition. This procedure ensures that samples were sufficiently dry and that contributions from internally bound water were removed from the spectra. Subsequent to data acquisition, the CaF2 slides (A, E and I, see Table 1) were returned to the desiccator for 1 and 4 weeks, and rescanned at each time interval. These results will indicate spectral changes in the unfixed and fixed cells as a result of sample degradation over time.
For “fixed” cell experiments, the exfoliated cells (still on the cytobrushes) were left in their respective fixative solution for 24 hours, 1 week, or 4 weeks. After this fixation period, cells were centrifuged and washed with BSS prior to spin deposition onto CaF2 disks. The samples were air-dried under a clean, dry air stream and kept in a desiccator for 24 hours until the first data acquisition. These results will indicate spectral changes due to prolonged exposure to the fixative solutions. It is important to point out that cells fixed in phosphate-buffered formalin need to be washed at least six times with BSS (in comparison to two washings required for cells fixed with the Surepath® solution) to remove deposits of calcium phosphate or calcium hydrogen phosphate. These deposits form because the Ca+2 concentration resulting from the finite solubility of CaF2, in combination with the phosphate / hydrogen phosphate ion concentration of the buffer, lead to precipitation of calcium salts that contaminated the cellular spectra.
Spectral data acquisition and data analysis
All spectral data were acquired in transmission mode using three Perkin Elmer [Shelton, CT USA] Spotlight 400 Imaging infrared spectrometers in the authors’ laboratory. Data collected from different instruments were interchangeable and reproducible regardless of the specific instrument employed. A 1 mm μ 1 mm area of each window was mapped at 4 cm−1 resolution and 6.25 μm μ 6.25 μm pixel size (~ 40 μm2); 16 interferograms were co-added per pixel. Details of the instrumentation, instrumental conditions and data analysis have been reported in previous publications.11 Central to this approach is the PapMap algorithm19 that allows reconstruction of an individual cellular spectrum from between 9 and 100 individual pixel spectra depending on the cell’s size, which can range from about 4000 μm2 for a mature squamous cell to as low as 1000 μm2 for an immature squamous cell.
Data pre-treatment included noise adjusted principal component reconstruction (NA-PC)20,21 that increases the signal-to-noise (S/N) ratio of spectral data significantly. In NA-PC, noise and spectral matrices are calculated separately, and spectra are reconstructed from a reduced number of noise-adjusted principal components (30 PCs used for this study).22 Following NA-PC, data were min/max normalized to the amide I band, 1650 cm−1, and computation of 2nd derivatives using a 9 point Savitzky-Golay smoothing window23 was performed. Principal component analysis (PCA)24 on mean centered data was utilized to analyze the datasets with respect to fixation and storage procedures discussed above.
RESULTS
In this section, we present mean spectra, mean 2nd derivative spectra and PCA scores plots of exfoliated oral mucosa cells using different fixatives, exposure times to those fixatives, and time points after cellular deposition. In order to correlate with other analyses performed in the lab, the C-H stretching region was eliminated and all analyses were performed using the spectral region 1800-1000 cm−1; however, spectra including the C-H stretching region still resulted in similar conclusions. The PCA scores plots depict individual, rather than averaged cell spectra to allow an assessment of the variability of spectra and the magnitude of spectral changes in each of the experiments. To remain consistent, the following color scheme was used to demonstrate results: red spectra and symbols denote cells at 24 hours, green at 1 week, and blue at 4 weeks (for definition of the time points, see Sample preparation protocols in ‘Method and Materials’).
Time evolution of unfixed cell spectra
We first turn to the results of the time course study for unfixed (desiccated) cells. Figure 1A displays a superposition of the mean absorbance spectra for the unfixed samples recorded at 24 hours, 1 week and 4 weeks after sample preparation. The number of individual cellular spectra averaged at each of the 3 different time points was 47 ± 2. At times in-between data acquisition, the sample was stored in a desiccator.
Figure 1.

(A) Stacked mean absorbance spectra (overlay shown in insert), (B) overlay mean 2nd derivative spectra (9 Point Savitzky-Golay smoothing window) and (C) stacked 2nd derivative spectra of unfixed (dried) cells at 24 hours (red), 1 week (green), and 4 weeks (blue) after sample preparation.
A cursory inspection of the mean spectra in Figure 1A shows no noticeable spectral differences between the three time points, with the spectra nearly super-imposable, indicating that there are no gross biochemical changes within 4 weeks of preparing an unfixed cell sample. Figure 1B shows an overlay of the mean 2nd derivative spectra of the data shown in Figure 1A. In general, 2nd derivative spectra are more sensitive toward the detection of small spectral changes since unresolved shoulders in the original absorbance spectra may show up as individual bands in 2nd derivatives. In particular, very slight broadening of bands, or band shifts, often lead to more noticeable changes in 2nd derivative spectra.
However, the increased spectral discrimination of 2nd derivative spectra is accompanied by a decrease in S/N of the data; thus, 2nd derivative methods should be used only if the original S/N of the absorbance spectra is high, preferably above 100:1. The mean spectra in Figure 1B are nearly super-imposable as well, and a stack plot of the three individual mean 2nd derivative spectra is shown in Figure 1C. Since these spectra are nearly identical, one may conclude that the average biochemical composition of dried cell samples is invariant over a period of one month, if the cells are stored in a dry, clean environment. In order to ascertain whether or not individual cells exhibit systematic spectral changes that are too small to be perceived by visual inspection of the spectra, all individual 2nd derivative spectra in the entire dataset of unfixed cells were subject to PCA. The results of this analysis are presented in Figure 2.
Figure 2.

(A) PCA scores plot of unfixed (dried) cells at 24 hours (red), 1 week (green), and 4 weeks (blue) after sample preparation. Representative loading vectors (B) PC1 and (C) PC2.
Figure 2A demonstrates a PCA scores plot of all 2nd derivative spectra of the unfixed cells shown in Figure 1 using the 1800 - 1000 cm−1 spectral region. The largest variance in this scores plot is along PC1; an inspection of the corresponding loading vector, PC1, reveals some atmospheric water contributions (Figure 2B), indicated by the sharp rotational-vibrational spectral contributions between ca. 1400 and 1600 cm−1. A similar, water-vapor based separation of spectra will occur in subsequent scores plots. It is not clear, at this point, whether this variation in water vapor content, which is observed for all three time points, is due to fluctuations in the purge air quality, or due to loss of residual water vapor from the cells (“out-gassing”).
The variations in water vapor contributions are too small to be detected visually in the absorption or the 2nd derivative spectra, but are detectable by PCA. Thus, the separation of the spectra along PC1 is most likely not significant. However, this plot also demonstrates that cells stored for longer than 1 week after exfoliation started to show small spectral changes along PC2 between the red and green clusters on one hand, and the blue cluster on the other. The corresponding loading vector is shown in Figure 2C, and indicates a small change in the amide I envelope. It is important to note that the scores plot in Figure 2A is scaled by 10−3; thus, these variations are exceedingly small.
In classical cytopathology, dried unfixed cells are rarely used, since cell morphology is believed to change over a period of 1 month and the uptake of immunohistochemical stains is poor. However, the photomicrographs of representative unstained cells revealed virtually no morphological changes at 24 hrs, 1 week and 4 weeks after fixation, see Figure 3. These images are for unstained cells, and may not reveal all the details a cytologist is expected to discern for stained and cover-slipped cells. However, these images dispel the notion that there are major cellular morphological and spectral changes with time for unfixed cells.
Figure 3.
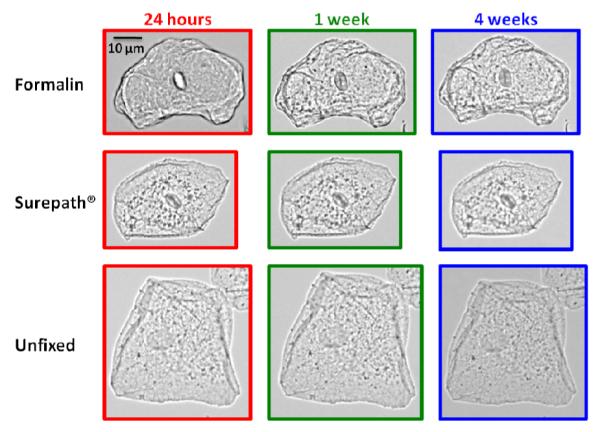
Photomicrographs of (bottom) unfixed (dried) cells and (middle) Surepath® and (top) formalin fixed cells at 24 hours (red), 1 week (green), and 4 weeks (blue) after sample preparation.
Comparison of fixed and dried cells (24 hour fixation)
In this section, we present spectral results for unfixed cells and cells that were subject to the fixation protocols described in Sample preparation protocols of the ‘Materials and Methods’ section above. In particular, we compare spectra of unfixed (dried) cells at 24 hours, and cells that were fixed for 24 hours in Surepath® (29 cellular spectra for each time point) or phosphate-buffered formalin solutions (36 ±1 cellular spectra), and dried subsequently (samples A, E and I in Table 1). Figure 4 shows a stack plot of the mean 2nd derivative spectra for cells subject to the three different protocols. These mean 2nd derivative spectra for all fixation protocols are very similar, and dispel the notion that fixation methods cause strong changes in spectral patterns, as reported previously.15 The similarity of the spectra may come as a surprise given the fact that the different sample treatments do change the chemical composition somewhat. In the past, we have shown that fixation in pure ethanol changes the phospholipid spectral features of cultured cells25; however, these previous experiments were carried out using 100 percent ethanol and cultured cells (fibroblasts) that showed relatively large phospholipid features at ca. 1740 cm−1. These spectral features are very weak or absent in exfoliated oral mucosa cells. In addition, one could expect to see the effects of protein cross-linking in proteins due to formaldehyde, but given the low number of cross links formed, it is plausible that the spectral changes are beyond the detection limit, when inspecting the mean spectra by eye. A slight spectral change, not apparent in the absorbance spectra data, is a small shoulder on the low frequency side of the amide I band (see arrow in Figure 4) that is most pronounced in the Surepath® fixed samples at all time points. This indicates a small, fixation-induced spectral change that occurs immediately upon Surepath® fixation, but is not observed in the formalin fixed or unfixed samples.
Figure 4.

Mean 2nd derivative spectra (9 Point Savitzky-Golay smoothing window) of cells fixed and unfixed for 24 hours at 24 hours (red), 1 week (green), and 4 weeks (blue) after sample preparation.
However, as previously observed for the unfixed cells, PCA is able to distinguish very small spectral changes. This is shown by the PCA scores plot in Figure 5A that displays cells fixed by different methods after 24 hours (with subsequent drying for 4 weeks), which form tight clusters separated from each other. The loading vector for PC1 shown in Figure 5B, responsible for the separation of the formalin-fixed cells from the Surepath® fixed and unfixed (dried) cells indicates that this variance is due to slight shifts in the amide I and amide II bands, and a broad band at ca. 1400 cm−1, generally attributed to the symmetric carboxylate stretching vibration in fatty acids and protein side chains. Furthermore, the loading vector for PC2 shown in Figure 5C, which accounts for the separation of the Surepath® fixed cells from the other two fixation methods, illustrates similar shifts in the protein region as PC1, in addition to changes in the lower wavenumber region mostly indicative of shifts in the phospholipid region. This correlates with the partial function of the Surepath® fixative where lipids are removed. These changes are indicative of different chemical actions produced by the fixatives, but again, these changes are very small. Furthermore, all data collected from the entire study (each collection time point for all three fixatives) were analyzed by PCA (not shown) and the results displayed identical results to the scores plot in Figure 5A. This indicates that spectral changes within one mode of fixation are minimal and that by adopting one method for sample preparation, influences due to fixation can be eliminated.
Figure 5.

(A) PCA Scores plot of cells fixed by three different methods: unfixed (dried), Surepath® and formalin, 24 hours post deposition. (B) and (C): corresponding loading vectors PC1 and PC2 respecitvely.
Once fixed, samples remain stable over the same time course. For these results, the samples fixed for 24 hours, discussed in the last paragraphs, were stored in a desiccator for 1 to 4 weeks, after which the same 1 mm μ 1 mm area of dried or fixed cells on a window were rescanned. The results of these experiments are shown in the scores plot depicted in Figure 6 for Surepath® fixed cells. Nearly identical results were obtained for the formalin fixed cells (not shown). This figure demonstrates that no spectral changes are observed within the first week after fixation. After 4 weeks, very minor spectral changes start to appear in the amide I and II bands in PC2, most likely due to protein degradation with extending storage in the desiccator; nevertheless, morphological changes are not present in either Surepath® or formalin fixed cells (Figure 3).
Figure 6.

(A) PCA scores plot of exfoliated oral (buccal) mucosa cells fixed for 24 hours in Surepath® and desiccated between each time-point (24 hours, 1 week and 4 weeks). (B) and (C): corresponding loading vectors PC1 and PC2. (D) Photomicrographs of one cell monitored at each time-point chronologically from top to bottom.
Time evolution of cells treated with varying fixation exposure times
In this section, we compare cells that were exposed to fixative solution (Surepath® and phosphate-buffered formalin) for 24 hours, 1 week or 4 weeks. The numbers of individual cellular spectra averaged at each time point were 34 ±5 and 36 ±5, respectively, and these results are shown in Figures 7 and 8. In both of these figures, there is a broad change in the envelope of the symmetric - PO2 - stretching vibration of the phosphodiester moiety, c.a. 1090 cm−1. Since this broad band disappears in the 2nd derivative spectra, we interpreted this change to be due to a slight background variation of the window material due to interaction with the fixative. This interpretation was also based on the fact that the broad background appeared in the 24-hour spectra of the formalin-fixed cells and the 4 week spectra of the Surepath® fixed cells, and thus, does not seem to correlate with solvent exposure time. This is not to be confused with the calcium phosphate bands observed for prolonged exposure of the CaF2 windows to phosphate buffer (see below).
Figure 7.
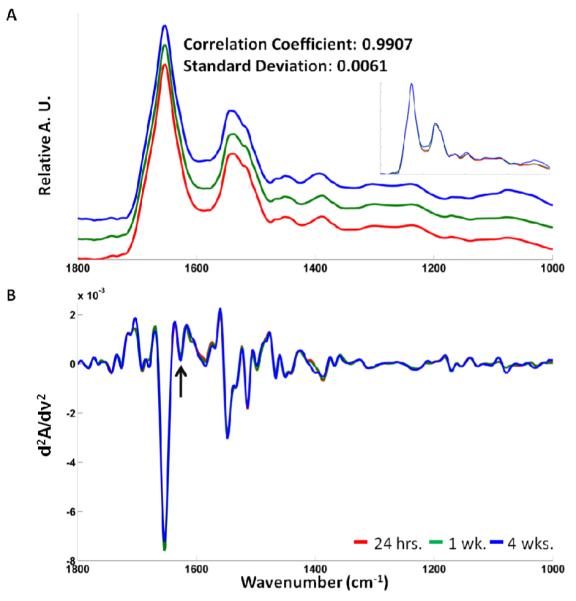
Mean (A) absorbance (overlay shown in insert) and (B) 2nd derivative spectra of exfoliated oral mucosa cells fixed in Surepath® for 24 hours (red), 1 week (green), or 4 weeks (blue).
Figure 8.
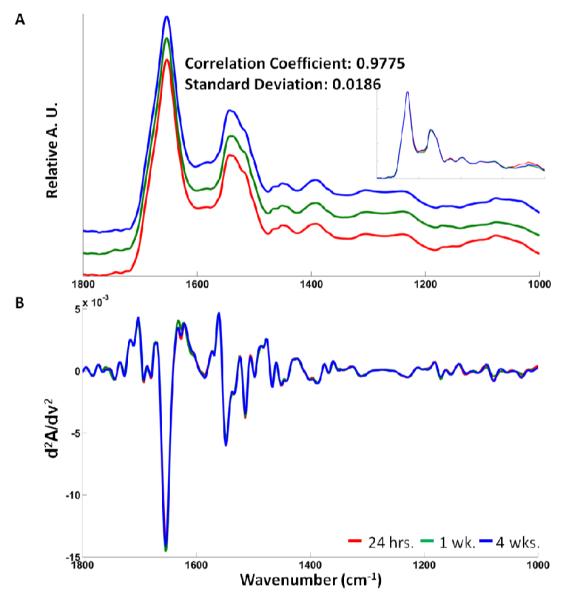
Mean (A) absorbance (overlay shown in insert) and (B) 2nd derivative spectra of exfoliated oral mucosa cells fixed in buffered formalin for 24 hours (red), 1 week (green), or 4 weeks (blue).
Aside from the changes in the symmetric - PO2 - stretching region, the largest differences between the two fixatives can be seen in the amide I shoulder at 1635 cm−1 (arrow), where the band intensity changed slightly, paralleling the results displayed in Figure 4 for the 24 hour data, and a change in the intensities at 1600 cm−1. For each fixation method, the time evolution of spectral changes is very small: The Surepath® fixed cells show a small increase of the broad band at just below 1400 cm−1, which has been associated with the symmetric carboxylate stretching vibration. Such a change could be pH or hydration dependent. The concomitant change in the dip between the amide I and amide II bands (around 1600 cm−1) is, in all likelihood, also due to water content of the sample.
As shown before in Figure 1 for dried (unfixed) cells, the absorbance and mean 2nd derivative spectra are nearly indistinguishable after 24 hours, 1 week and 4 weeks. These mean spectra are nearly identical; thus, we concluded that the average biochemical composition of fixed cell samples, whether fixation is induced via buffered formalin or Surepath® solutions, is relatively stable over a period of one month, regardless whether cells are stored in the fixative or in a dry, clean environment after fixation.
DISCUSSION
Effects of calcium phosphate contamination
As indicated in Sample preparation protocols of the ‘Materials and Methods’ section above, prolonged exposure to cells on CaF2 windows in phosphate-buffer leads to a precipitation of calcium phosphate (or hydrogen phosphate) on the windows and cells. These precipitates are indicated spectrally by sharp bands in the phosphate stretching region (1156 and 1076 cm−1); such bands can be easily distinguished from bands due to biochemical materials by their sharpness. Aside from this change, even prolonged exposure of cells in fixative solutions causes spectral changes that are very small, and may not be detectable by visual inspection of the spectra, but are detectable by methods such as PCA.
Discussion of previous fixation results of tissues
These results are in stark contrast with reports for tissue sections15,26,27 for which significant spectral changes have been reported. Some of these changes may have been due to effects other than fixation, such as paraffin embedding and paraffin removal, destruction of the cells (see below), changes in cell morphology, or simply, the removal of some cellular components that may change the overall intensities of the observed infrared spectra. For example, tissue biopsies are washed numerous times in water, alcohol-water mixtures and organic solvents (xylene) before being embedded in paraffin.27 Subsequently, they are sectioned via a microtome, which ultimately affects the cellular integrity, before being deparaffinized. The deparaffinization protocols involve a reversal of the washing procedures alluded to above. This methodology may affect each tissue section differently based on the biochemical components within each section. Conversely, cellular samples are simply swabbed from the desired area and placed in a vial containing fixative solution. Spectral changes may differ based on these different sample-handling techniques alone.
All spectra reported here were normalized, and thus, will not display overall intensity changes, whereas some reported spectral changes, upon fixation, seem to depend on the overall absorbance. Some of the previous data on fixation effects were performed before widespread use of micro-spectroscopic methods; thus, macroscopic changes in the composition of the sample may also have contributed to spectral changes.
Spectral changes due to disease vs. fixation-induced changes
In the authors’ laboratory, methods to use spectral diagnoses of disease are being explored. Thus, the question arises of how spectral changes due to fixation compare in magnitude with spectral changes due to disease. This aspect is addressed in Figure 9, which depicts a PCA scores plot (Figure 9A) of the normal cells discussed so far with clinical samples of oral disease, namely hyperplasia and mild dysplasia. We have shown before4 that the spectra from abnormal, but not cancerous cells occupy a region in PCA space in-between the normal and cancerous cell spectra. Figure 9 demonstrates that the variations influenced by fixation are much smaller than those caused by hyperplasic and “atypical” diagnoses. The loading vectors, PC1 (Figure 9B) and PC2 (Figure 9C), show changes in the amide I and amide II bands where variance attributed to disease is most often observed. These results mirror other recent results which indicate that SCP detects a number of small spectral changes which seem to follow the following trend: normal cells, regardless of fixation procedures, exhibit very homogeneous spectra. Changes due to variation of anatomical regions (tongue vs. cheek vs. floor of the mouth) produce small, but reproducible changes, which have been verified in a study involving about 100 subjects. Metabolites of ibuprofen and tobacco seem to induce slightly larger spectral changes. Disease, in particular cancer, produces much larger changes, with dysplastic cells exhibiting spectral features approaching those of cancer.
Figure 9.

(A) PCA scores plot and its representative loading vectors (B) PC1 and (C) PC2 of fixative data presented thus far (red, green, and blue) and diseased, yet morphologically normal looking, oral mucosa (buccal) cells (black)
CONCLUSIONS
This study has shown that when developing a fixation protocol for SCP analyses, one method should be implemented and maintained throughout an entire project. These results have indicated that very small spectral changes do exist between different modes of fixation and by altering the length of time in fixation or a desiccator. However, these changes are smaller than those due to biochemical changes associated with disease such as hyperplasia, cancer or viral contributions.
ACKOWLEDGEMENTS
Support of this research by grants CA 090346 and CA 153148 is gratefully acknowledged.
Footnotes
Although all routine SCP is carried out in the authors’ laboratory using MirrIR [Kevley, Chesterland, OH] slides, CaF2 substrates were used in this study because we wished to utilize these samples for Raman spectral studies in the future, and ‘low-e’ slides are not useful for thispurpose. However, CaF2 windows proved difficult when samples were fixed with phosphate-buffered formalin, see Sample preparation protocols below.
REFERENCES
- 1.Stoler MH, Schiffman M. Jama-J. Am. Med. Assoc. 2001;285(22):2855–2856. [Google Scholar]
- 2.Clark BD, Vezza PR, Copeland C, Wilder A-M, Abati A. Mod. Pathol. 2002;15(12):1259–1265. doi: 10.1097/01.MP.0000036456.45865.A0. [DOI] [PubMed] [Google Scholar]
- 3.Sturgis CD, Nassar DL, D’Antonio JA, Raab SS. J. Clin. Pathol. 2000;114:197–202. doi: 10.1309/8MQG-6XEK-3X9L-A9XU. [DOI] [PubMed] [Google Scholar]
- 4.Papamarkakis K, Bird B, Schubert JM, Miljkovic M, Wein R, Bedrossian K, Laver N, Diem M. Lab. Invest. 2010;90(4):589–598. doi: 10.1038/labinvest.2010.1. [DOI] [PMC free article] [PubMed] [Google Scholar]
- 5.Schubert JM, Bird B, Papamarkakis K, Miljkovic M, Bedrossian K, Laver N, Diem M. Lab. Invest. 2010;90(7):1068–1077. doi: 10.1038/labinvest.2010.72. [DOI] [PMC free article] [PubMed] [Google Scholar]
- 6.Romeo M, Boydston-White S, Matthäus C, Miljković M, Bird B, Chernenko T, Diem M. In: Modern Concepts in Biomedical Vibrational Spectroscopy. Lasch P, Kneipp J, editors. John Wiley & Sons, Inc.; 2008. pp. 121–152. [Google Scholar]
- 7.Diem M, Griffiths PR, Chalmers JM. Vibrational Spectroscopy for Medical Diagnosis. John Wiley & Sons Ltd.; West Sussex: 2008. [Google Scholar]
- 8.Miller LM, Dumas P, Jamin N, Teillaud J-L, Miklossy J, Forro L. Rev. Sci. Instrum. 2002;73(3):1357–1360. [Google Scholar]
- 9.Levin IW, Bhargava R. Annu. Re. Phys. Chem. 2005;56:429–474. doi: 10.1146/annurev.physchem.56.092503.141205. [DOI] [PubMed] [Google Scholar]
- 10.Romeo M, Mohlenhoff B, Jennings M, Diem M. Biochim. Biophys. Acta. 2006;1758(7):915–922. doi: 10.1016/j.bbamem.2006.05.010. [DOI] [PMC free article] [PubMed] [Google Scholar]
- 11.Schubert JM, Mazur AI, Bird B, Miljkovic M, Diem M. J. Biophotonics. 2010;3(8-9):588–596. doi: 10.1002/jbio.201000023. [DOI] [PMC free article] [PubMed] [Google Scholar]
- 12.Demay RM. The Pap Test. ASCP Press; Chicago: 2005. [Google Scholar]
- 13.Ludlow EB, Ashfaq R, Hoda RS, Kaminsky DB, Lightfoot SA, Linder J, McKee GT, Pereira TC, Pisharodi L, Silverman JF, Smith RA, Wang HH, Weir MM. ThinPrep® Non-Gyn Morphology Reference Atlas. Cytyc Corporation; Marlborough: 2005. [Google Scholar]
- 14.Hastings G, Wang R, Krug P, Katz D, Hilliard J. Biopolymers. 2006;89(11):921–930. doi: 10.1002/bip.21036. [DOI] [PubMed] [Google Scholar]
- 15.Mantsch H, Jackson M. J. Mol. Struct. 1995;347:187–206. [Google Scholar]
- 16.Bassan P, Byrne HJ, Bonnier F, Lee J, Dumas P, Gardner P. Analyst. 2009;134(8):1586–1593. doi: 10.1039/b904808a. [DOI] [PubMed] [Google Scholar]
- 17.Romeo M, Mohlenhoff B, Diem M. Vib. Spectrosc. 2006;42(1):9–14. doi: 10.1016/j.vibspec.2006.04.009. [DOI] [PMC free article] [PubMed] [Google Scholar]
- 18.Faolain EO, Hunter MB, Byrne JM, Kelehan P, McNamara M, Byrne HJ, Lyng FM. Vib. Spectrosc. 2005;38:121–127. [Google Scholar]
- 19.Diem M, Miljkovic M, Romeo M, Bird B, Schubert JM. Method of Reconstituting Cellular Spectra from Spectral Mapping Data. U.S. Patent 20110142324. 2009 May 29;
- 20.Reddy RK, Bhargava R. Analyst. 2010;135:2818–2825. doi: 10.1039/c0an00350f. [DOI] [PubMed] [Google Scholar]
- 21.Green AA, Berman M, Switzer P, Craig MD. IEEE Trans. Geosci. Remote Sens. 1988;26(1):65–74. [Google Scholar]
- 22.Marcsisin EJ, Uttero CM, Mazur AI, Miljkovic M, Bird B, Diem M. Analyst. 2011 doi: 10.1039/c2an15868j. submitted. [DOI] [PubMed] [Google Scholar]
- 23.Savitzky A, Golay MJE. Anal. Chem. 1964;36(8):1627–1639. [Google Scholar]
- 24.Adams MJ. Chemometrics in Analytical Spectroscopy. 2nd ed. Royal Society of Chemistry; Cambridge: 2004. [Google Scholar]
- 25.Pacifico A, Chiriboga LA, Lasch P, Diem M. Vib. Spectrosc. 2003;32:107–115. [Google Scholar]
- 26.Hackett MJ, McQuillan JA, El-Assaad F, Aitken JB, Levina A, Cohen DD, Siegele R, Carter EA, Grau GE, Hunt NH, Lay PA. Analyst. 2011;136:2941–2952. doi: 10.1039/c0an00269k. [DOI] [PubMed] [Google Scholar]
- 27.Gazi E, Gardner P. In: Vibrational Spectroscopic Imaging for Biomedical Applications. Srinivasan G, editor. McGraw-Hill; China: 2010. [Google Scholar]