

Abstract
Recent advances in chronic lymphocytic leukaemia (CLL) treatment, more particularly through upfront use of anti-CD20 monoclonal antibodies, have prolonged patient progression-free survival. Nonetheless, apart from allogeneic stem cell transplantation, no curative treatment is available. One possible explanation for the lack of cure in CLL could be a defective immune anti-tumour response. As the result of abnormal HLA class I molecule expression, CLL cells escape from specific T-lymphocyte immunity but should be the target for the innate natural killer (NK) cell-mediated immune response. Defective NK cytotoxicity as the result of decreased expression of the natural cytotoxicity receptors (NCRs) NKp30/NCR3, NKp44/NCR2 and NKp46/NCR1 has been described in haematological malignancies such as acute myeloid leukaemia. This prompted us to focus our attention on NCR expression on NK cells from patients with CLL. Although we failed to detect any difference between CLL patients and healthy age-matched controls, a precise analysis of clinical data showed a correlation between decreased NCR expression and poor prognosis factors such as low haemoglobin level, high (> 30 × 109 per litre) lymphocyte count or elevated C-reactive protein. Together, these observations support the rationale for restoration of normal NK cell functions in patients with CLL, putatively through the use of immune therapy protocols that already have demonstrated some benefit in acute myeloid leukaemia such as interleukin-2 plus histamine dihydrochloride.
Keywords: chronic lymphocytic leukaemia, immunotherapy, natural cytotoxicity receptors, natural killer cells
Introduction
Prognosis of haematological malignancies is often impaired by a high risk of relapse, which might decreased by adequate immunotherapy. Specific immunotherapy is mainly challenged by the HLA class I molecule expression defects that are frequently observed in cancer cells. In contrast to tumour-specific T lymphocytes, natural killer (NK) lymphocytes kill target cells in an HLA-independent way. The NK cells ‘sense’ the absence or the abnormal expression of HLA class I molecules to express their cytolytic capacities. Two studies have shown a decrease in HLA class I molecule expression on chronic lymphocytic leukaemia (CLL) lymphocytes in 65–85% of patients,1,2 suggesting that tumour cells could be eliminated by NK cytotoxicity. Unfortunately, defective cytolytic function of NK cells has been described in CLL.3–7 Lotz et al.8 have shown that transforming growth factor-β (TGF-β) is secreted by B cells from patients with CLL. Also, TGF-β is a strong inhibitor of NKp30/NCR39 expression, and the expression of natural cytotoxicity receptors (NCRs), which are pivotal molecules in the anti-tumour response, is down-regulated in other haematological malignancies10,11 (and for review, see ref. 12). For these reasons we focused our attention on the expression of the three NCRs: NKp46/NCR1, NKp44/NCR2 and NKp30/NCR3.
Materials and methods
Patients
After informed consent, blood samples were obtained from 46 patients with CLL (Matutes score 4 or 5) and from 15 healthy age-matched blood donors (ages 66·8 ± 14·6 years for healthy donors versus 69·5 ± 10·2 years for CLL patients). Among the CLL patients, 41 had never been treated and five had discontinued treatment for more than 6 months at the time of the study. Data on patients are summarized in Table 1.
Table 1.
Characteristics of patients
| Age at diagnosis | |
| < 60 years | 8 patients |
| 60–70 years | 15 patients |
| > 70 years | 23 patients |
| Sex | |
| Male/Female | 26 patients/20 patients |
| Stage | |
| Binet A | 42 patients |
| Binet B | 0 patients |
| Binet C | 4 patients |
| Rai 0 | 35 patients |
| Rai I/Rai II | 5 patients/2 patients |
| Rai III/Rai IV | 2 patients/2 patients |
| Lymphocyte | |
| Mean number (× 109/l) | 22·2 ± 22·7 |
| Doubling time | |
| > 6 months | 41 patients |
| < 6 months | 5 patients |
| ZAP 70 | |
| Negative (< 20%) | 28 patients |
| Positive (> 20%) | 17 patients |
| Unknown | 1 patient |
| CD38 | |
| Negative (> 30%) | 36 patients |
| Positive (> 30%) | 7 patients |
| Unknown | 3 patients |
| Karyotype/FISH | |
| Normal | 16 patients |
| 13q14 deletion | 12 patients |
| Trisomy 12 | 1 patients |
| 11q deletion | 0 patients |
| 17p deletion | 3 patients |
| Unknown | 14 patients |
| C-reactive protein | |
| Normal (< 5 mg/l) | 20 patients |
| Elevated (> 5 mg/l) | 8 patients |
| Unknown | 18 patients |
| β2-microglobulin | |
| Normal (< 2·5 mg/l) | 11 patients |
| Elevated (> 2·5 mg/l) | 13 patients |
| Unknown | 22 patients |
| Lactate dehydrogenase | |
| Normal (< 520 UI/l) | 21 patients |
| Elevated (> 520 UI/l) | 8 patients |
| Unknown | 17 patients |
| Total immunoglobulin | |
| Normal (< 15 g/l/> 8 g/l) | 19 patients |
| Decreased (< 8 g/l) | 13 patients |
| Normal profile | 24 patients |
| Oligoclonal profile | 5 patients |
| Monoclonal profile | 3 patients |
| Unknown | 14 patients |
FISH, fluorescent in situ hybridization.
Blood samples and cell separation
The analysis of peripheral blood mononucleated cells was performed < 4 hr after blood sampling, on whole blood samples maintained at room temperature. Red blood cell lysis was performed using the Q-Prep® lysing kit (Beckman Coulter; Marseille, France).
Phenotypic analyses
The NK cell population was defined as CD3− CD56+. The following monoclonal antibodies were all obtained from Beckman-Coulter: anti-CD3-FITC (UCHT1), anti-CD56-phycoerythrin-cyanine5 (PC5) (N901-NKH1), anti-NKp46/NCR1-phycoerythrin (PE), anti-NKp44/NCR2-PE and anti-NKp30/NCR3-PE. Triple staining was performed using CD3-FITC/CD56-PC5 in addition with anti-NKp46/NCR1-PE, anti-NKp44/NCR2-PE and anti-NKp30/NCR3-PE. For cell surface staining, cells (5 × 10⁵) were incubated for 20 min at 4° with 10 μl of the corresponding antibodies for 100 μl of whole blood. Flow cytometry was performed on an Epics XL® flow cytometer (Beckman Coulter).
Statistical analysis
Statistical analysis was performed using the SPSS software (SPSS Inc, Redmond, WA). The Kolmogorov–Smirnov test was used to determine if the data fitted a normal distribution. As this test rejected the assumption of normality for all variables, comparisons were made using the non-parametric Wilcoxon matched-pairs signed-rank test.
Results
Absolute number of NK cells and analysis of CD56dim or CD56bright NK cell subsets
A dot-plot and histograms corresponding to one representative patient are shown in Fig. 1(a) with the dot-plot representing the NK cell gate, i.e. CD3− CD56+ cells; a histogram showing the IgG isotypic control for NCR-specific antibodies; a histogram showing CD56 expression in the CD3− cells; and expression of the three NCRs, i.e. NKp30/NCR3, NKp44/NCR2 and NKp46/NCR1.
Figure 1.

(a) From left to right and up to down; a dot-plot representing the natural killer (NK) cell gate, i.e. CD3− CD56+ cells; a histogram showing the IgG isotypic control for natural cytotoxicity receptor (NCR) -specific antibodies; histogram showing CD56 expression in the CD3− cells and defining CD56dim versus CD56bright NK cells; NKp30/NCR3, NKp44/NCR2 and NKp46/NCR1 expression. (b) Comparison of the absolute number of total NK cells (first two columns), CD56dim subset (third and fourth columns) and CD56bright subset (two last columns) in patients (black bars) and healthy donors (white bars). ***Statistically significant difference (P < 0.05), NS, no statistically significant difference.
The absolute number of NK cells was checked (Fig. 1b) and there was a significant increase in CLL patients: 0·36 × 109 ± 0·37 × 109/l versus 0·16 × 109± 0·07 × 109/l in healthy age-matched donors (P < 0·05). In line with the predominance of the CD56dim subset in peripheral blood, this subset accounted for the increase of absolute NK cell numbers: 0·327 × 109 ± 0·3 × 109/l in patients with CLL versus 0·12 × 109 ± 0·06 × 109/l in healthy controls. In contrast, the absolute number of CD56bright NK cells was not different between CLL patients and healthy donors (0·026 × 109± 0·03 × 109/l versus 0·022 × 109 ± 0·02 × 109/l).
Then, we checked if we could determine some difference in CD56bright or CD56dim subsets depending on recognized prognostic factors of CLL. We failed to detect any difference when subpopulations were analysed regarding the absolute number of lymphocytes, the Binet or Rai stages, the haemoglobin (Hb), the C-reactive protein (CRP) level, the lactate dehydrogenase (LDH) level, the immunoglobulin level, karyotype/fluorescent in situ (FISH) analysis, and ZAP70 or CD38 expression (data not shown). We showed a significant difference regarding the percentage of CD56bright NK cells (Fig. 2) between patients with β2-microglobulin level ≤ 2·5 mg/l and patients with > 2·5 mg/l: 5 ± 2% versus 15·5 ± 2%, P < 0·05, respectively. No statistical difference was detected regarding the CD56dim subset.
Figure 2.

Comparison of the percentage of CD56bright natural killer (NK) cells in patients with β2-microglobulin (β2m) ≤ 2.5 mg/l (black bars), in patients with β2-microglobulin > 2.5 mg/l (white bars) and in healthy donors (grey bars). ***Statistically significant difference (P < 0.05), NS, no statistically significant difference.
Expression of the NKp30/NCR3, NKp44/NCR2 and NKp46/NCR1
Regarding the percentage of cells expressing each receptor (Fig. 3a), we failed to detect any significant difference in NKp30/NCR3 (patients 54·7 ± 20% versus healthy donors 61·2 ± 22%), NKp44/NCR2 (patients 10 ± 13% versus healthy donors 10·3 ± 6%) and NKp46/NCR1 (patients 76·4 ± 17·5% versus healthy donors 76·4 ± 18%). Regarding the mean fluorescence intensity (MFI) of each receptor (Fig. 3b), we failed to detect any significant difference in NKp30/NCR3 (patients 8·1 ± 5 versus healthy donors 10 ± 6), NKp44/NCR2 (patients 1·6 ± 1 versus healthy donors 1·6 ± 0·4) and NKp46/NCR1 (patients 19·2 ± 12 versus healthy donors 21·6 ± 13).
Figure 3.

Comparison of the percentage (a) and mean fluorescence intensity (MFI; b) of the natural cytotoxicity receptors (NCRs) NKp30/NCR3, NKp44/NCR2 and NKp46/NCR1 in patients (black bars) and healthy donors (white bars). ***Statistically significant difference (P < 0.05), NS, no statistically significant difference.
We then checked the expression of these receptors in different prognostic subsets of CLL patients. We failed to detect any difference when subpopulations were analysed regarding the Binet or Rai stages, the LDH level, the immunoglobulin level, karyotype/FISH analysis, ZAP70 or CD38 expression (data not shown). In contrast (Fig. 4a), the percentage of NK cells expressing NKp30/NCR3 was significantly lower in patients with > 30 × 109 lymphocytes/l versus < 30 × 109 lymphocytes/l (42·5 ± 10% versus 58 ± 8%, P < 0·05). The same observation was made for NKp44/NCR2 (3·2 ± 0·2% versus 11·3 ± 6, P < 0·05) whereas no difference was observed for NKp46/NCR1 (71·8 ± 11% versus 77·8 ± 6%). The level of expression of each molecule, evaluated by its MFI (Fig. 4b), displayed the same differences: 6 ± 2 in patients with > 30 × 109 lymphocytes/l versus 8·7 ± 2 in patients with < 30 × 109 lymphocytes/l regarding NKp30/NCR3 (P < 0·05), and 1·1 ± 0·01 versus 1·7 ± 0·2 (P < 0·05) for NKp44/NCR2, whereas no significant difference was observed for NKp46/NCR1 MFI (18·4 ± 7 versus 19·4 ± 8).
Figure 4.
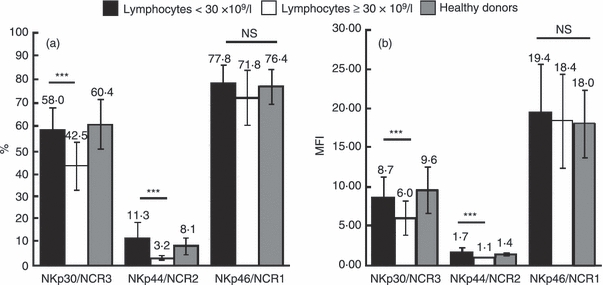
Comparison of the percentage (a) and mean fluorescence intensity (MFI; b) of natural cytotoxicity receptors (NCRs) NKp30/NCR3, NKp44/NCR2 and NKp46/NCR1 in patients with < 30 × 109 lymphocytes/l (black bars), in patients with > 30 × 109 lymphocytes/l (white bars) and in healthy donors (grey bars). ***Statistically significant difference (P < 0.05), NS, no statistically significant difference.
Differences were also detected in NCR expression depending on CRP level (Fig. 5). The percentage of NK cells (Fig. 5a) expressing NKp30/NCR3 was significantly lower in patients with CRP ≥ 5 mg/l (i.e. elevated) compared with CRP < 5 mg/l (35·6 ± 10% versus 65·6 ± 5%, P < 0·05). The same observation was made for NKp46/NCR1 (59·4 ± 11% versus 83·6 ± 7%, P < 0·05), whereas no statistically significant difference was observed for NKp44/NCR2 (6·8 ± 1% versus 11·6 ± 9%, P < 0·1, not significant). The level of expression of each molecule, evaluated by MFI (Fig. 5b), displayed the same pattern: 4·6 ± 2 in patients with CRP ≥ 5 mg/l versus 10·4 ± 3 in patients with CRP < 5 mg/l for NKp30/NCR3 (P < 0·05), 1·3 ± 0·01 versus 1·8 ± 0·3 (P < 0·1, not significant) for NKp44/NCR2, and 10·1 ± 4 versus 24·7 ± 6 for NKp46/NCR1 (P < 0·05).
Figure 5.

Comparison of the percentage (a) and mean fluorescence intensity (MFI; b) of natural cytotoxicity receptors (NCRs) NKp30/NCR3, NKp44/NCR2 and NKp46/NCR1 in patients with C-reactive protein (CRP) < 5 mg/l (black bars), in patients with CRP ≥ 5 mg/l (white bars) and in healthy donors (grey bars). ***Statistically significant difference (P < 0.05), NS, no statistically significant difference.
Finally, although we failed to detect significant differences in NCR expression based on Binet or Rai clinical stages, Hb level was correlated with NKp30/NCR3 and NKp46/NCR1 both regarding the percentage of expression (Fig. 6a: ρ = 0·431 and P = 0·004 for NKp30/NCR3 and Fig. 6c: ρ = 0·425 and P = 0·038 for NKp46/NCR1) and the MFI (Fig. 6d: ρ = 0·468 and P = 0·002 for NKp30/NCR3 and Fig. 6f: ρ = 0·392 and P = 0·011 for NKp46/NCR1). No correlation was found regarding NKp44/NCR2 and Hb levels either regarding percentage of positive cells (Fig. 6b) or MFI (Fig. 6e).
Figure 6.

Correlation between the percentage (a–c) or mean fluorescence intensity (MFI; d–f) of the natural cytotoxicity receptors (NCRs) NKp30/NCR3 (a, d) NKp44/NCR2 (b, e) and NKp46/NCR1 (c, f) and the haemoglobin (Hb) level in patients. r, correlation factor; NS, no statistically significant difference.
Discussion
Immunotherapy is a promising therapeutic approach to eradicate residual leukaemic cells after chemotherapy. In CLL, results with passive immunotherapy, i.e. anti-CD20 monoclonal antibodies, have been interesting both in the induction chemotherapy and in maintenance. Nonetheless, this treatment strategy is not curative, and, more particularly in the younger patients, life expectancy still remains significantly reduced (for review, see ref. 13). Although allogeneic stem cell transplantation may achieve complete eradication of residual disease, this procedure is impaired by important morbidity and mortality, and is rarely proposed to patients who are over 65 years old. Recently, there has been great interest in innate immunity in haematological malignancies, because killer immunoglobulin-like receptor mismatch has a positive effect on relapse-free survival in patients with acute lyeloid leukaemia who benefit from allogeneic stem cell transplantation. In CLL, deficient HLA class I expression indicates that leukaemic cells could be targeted by NK cells and, unfortunately, most studies (except for that by Veuillen et al.14) have described decreased NK cytotoxic activity.3–7,15 Moreover, recent treatments aimed at restoring normal NK function [interleukin-2 (IL-2) plus histamine dihydrochloride16,17] have demonstrated some success in preventing relapse in acute lyeloid leukaemia, suggesting that this approach could be extended to other leukaemia types. We therefore wanted to more precisely define quantitative and qualitative abnormalities in NK cells from patients with CLL and correlate these results to clinical data.
Interestingly, we first noticed that absolute numbers of NK cells were higher in patients with CLL than in age-paired healthy donors, in line with the data of Tötterman et al.18 Our analysis identified the CD56dim NK cells, i.e. the cytotoxic subset, as being responsible for absolute number increase. Interestingly, we observed that patients with high β2-microglobulin (an indicator of poor prognosis) had a higher percentage of CD56bright NK cells than patients with normal β2-microglobulin. This NK cell subset is considered to be responsible for cytokine secretion; interferon-γ, tumour necrosis factor-β, granulocyte–macrophage colony-stimulating factor, IL-10 or IL-13. Serum levels of IL-10 are elevated and correlate to clinical stage in CLL19 and IL-13 protects CLL cells from apoptosis.20 These data could suggest that this cytokine-producing expanded subset may contribute to CLL cell survival and proliferation. Nonetheless, recent data21 indicate that cytokine production by NK cells depends on the set of engaged activating molecules and is not restricted to the CD56bright subset, which adds to the complexity of the system.
Deficient NCR expression has been observed in some haematological malignancies so we focused our attention on these molecules. In contrast with Veuillen et al.,14 we failed to detect a difference in NCR expression between patients and age-matched healthy donors. Nonetheless, a comparison of NCR expression based on CLL lymphocyte level demonstrated that patients with > 30 × 109/l, a poor prognosis factor,22 had decreased expression of NKp30/NCR3 and NKp44/NCR2, with normal expression of NKp46/NCR1. One possible explanation is the secretion of TGF-β by CLL cells,23 because this cytokine down-regulates NKp30/NCR3 expression in NK cells.9 Nonetheless, we cannot exclude direct inhibition by cell-to-cell contact of NCR expression at the NK cell surface by CLL lymphocytes. We also correlated down-regulation of NKp30/NCR3 expression with increased CRP levels. As CRP levels correlate with IL-6 levels, and because this cytokine down-regulates NK cell cytotoxicity,24,25 we can speculate that elevated CRP levels may correlate with down-regulated NKp30/NCR3 through an IL-6-induced regulation. Finally, we analysed NCR expression in comparison with Hb level. Although we failed to observe any correlation with Rai or Binet stages, in accordance with Veuillen et al.,14 we detected a negative correlation between Hb level and both NKp30/NCR3 or NKp46/NCR1. We conclude from this study that a very precise analysis of NCR expression and clinical data allows correlation of negative CLL prognostic factors (elevated CRP, high lymphocyte count and low Hb level) with decreased NCR expression. These molecules are pivotal for NK cell activation and anti-tumour cytotoxic response, restoration of their normal expression could contribute to direct or antibody-driven anti-tumour cytotoxicity and so to eradication of residual leukaemia cells.
Acknowledgments
This work was funded in part by the Association pour le Développement de la Recherche Médicale (A.DE.RE.M) and benefited of a grant from Laboratoires Roche, Jansenn-Cilag and Novartis. Special acknowledgements go to K. Baumgartner for statistical analysis of the data.
Disclosures
The author declares no competing financial interests.
References
- 1.Demanet C, Mulder A, Deneys V, Worsham MJ, Maes P, Claas FH, Ferrone S. Down-regulation of HLA-A and HLA-Bw6, but not HLA-Bw4, allospecificities in leukemic cells: an escape mechanism from CTL and NK attack? Blood. 2004;103:3122–30. doi: 10.1182/blood-2003-07-2500. [DOI] [PubMed] [Google Scholar]
- 2.Verheyden S, Ferrone S, Mulder A, Claas FH, Schots R, De Moerloose B, Benoit Y, Demanet C. Role of the inhibitory KIR ligand HLA-Bw4 and HLA-C expression levels in the recognition of leukemic cells by natural killer cells. Cancer Immunol Immunother. 2009;58:855–65. doi: 10.1007/s00262-008-0601-7. [DOI] [PMC free article] [PubMed] [Google Scholar]
- 3.Ziegler HW, Kay NE, Zarling JM. Deficiency of natural killer cell activity in patients with chronic lymphocytic leukemia. Int J Cancer. 1981;27:321–7. doi: 10.1002/ijc.2910270310. [DOI] [PubMed] [Google Scholar]
- 4.Katrinakis G, Kyriakou D, Papadaki H, Kalokyri I, Markidou F, Eliopoulos GD. Defective natural killer cell activity in B-cell chronic lymphocytic leukaemia is associated with impaired release of natural killer cytotoxic factor(s) but not of tumour necrosis factor-α. Acta Haematol. 1996;96:16–23. doi: 10.1159/000203709. [DOI] [PubMed] [Google Scholar]
- 5.Kay NE, Zarling JM. Impaired natural killer activity in patients with chronic lymphocytic leukemia is associated with a deficiency of azurophilic cytoplasmic granules in putative NK cells. Blood. 1984;63:305–9. [PubMed] [Google Scholar]
- 6.Kay NE, Zarling J. Restoration of impaired natural killer cell activity of B-chronic lymphocytic leukemia patients by recombinant interleukin-2. Am J Hematol. 1987;24:161–7. doi: 10.1002/ajh.2830240207. [DOI] [PubMed] [Google Scholar]
- 7.Alvarez-Mon M, Casas J, Laguna R, Jorda J, Durantez A. Clinical signification of natural killer activity in B-cell chronic lymphocytic leukemia. Eur J Haematol. 1987;38:268–73. doi: 10.1111/j.1600-0609.1987.tb01175.x. [DOI] [PubMed] [Google Scholar]
- 8.Lotz M, Ranheim E, Kipps TJ. Transforming growth factor β as endogenous growth inhibitor of chronic lymphocytic leukemia B cells. J Exp Med. 1994;179:999–1004. doi: 10.1084/jem.179.3.999. [DOI] [PMC free article] [PubMed] [Google Scholar]
- 9.Castriconi R, Cantoni C, Della CM, et al. Transforming growth factor β1 inhibits expression of NKp30 and NKG2D receptors: consequences for the NK-mediated killing of dendritic cells. Proc Natl Acad Sci U S A. 2003;100:4120–5. doi: 10.1073/pnas.0730640100. [DOI] [PMC free article] [PubMed] [Google Scholar]
- 10.Costello RT, Sivori S, Marcenaro E, et al. Defective expression and function of natural killer cell-triggering receptors in patients with acute myeloid leukemia. Blood. 2002;99:3661–7. doi: 10.1182/blood.v99.10.3661. [DOI] [PubMed] [Google Scholar]
- 11.Fauriat C, Just-Landi S, Mallet F, Arnoulet C, Sainty D, Olive D, Costello RT. Deficient expression of NCR in NK cells from acute myeloid leukemia: evolution during leukemia treatment and impact of leukemia cells in NCRdull phenotype induction. Blood. 2007;109:323–30. doi: 10.1182/blood-2005-08-027979. [DOI] [PubMed] [Google Scholar]
- 12.Sanchez CJ, Le Treut T, Boehrer A, Knoblauch B, Imbert J, Olive D, Costello RT. Natural killer cells and malignant haemopathies: a model for the interaction of cancer with innate immunity. Cancer Immunol Immunother. 2011;60:1–13. doi: 10.1007/s00262-010-0898-x. [DOI] [PMC free article] [PubMed] [Google Scholar]
- 13.Ferrajoli A. Treatment of younger patients with chronic lymphocytic leukemia. Hematol Am Soc Hematol Educ Program. 2010;2010:82–9. doi: 10.1182/asheducation-2010.1.82. [DOI] [PubMed] [Google Scholar]
- 14.Veuillen C, Aurran T, Rey J, et al. Monitoring of natural killer (NK) cells phenotype and antitumoral activity in patients with chronic lymphocytic leukemia. Haematologica. 2010;95(Suppl. 2):515. [Google Scholar]
- 15.Kimby E, Mellstedt H, Nilsson B, Bjorkholm M, Holm G. Differences in blood T and NK cell populations between chronic lymphocytic leukemia of B cell type (B-CLL) and monoclonal B-lymphocytosis of undetermined significance (B-MLUS) Leukemia. 1989;3:501–4. [PubMed] [Google Scholar]
- 16.Martner A, Thoren FB, Aurelius J, Soderholm J, Brune M, Hellstrand K. Immunotherapy with histamine dihydrochloride for the prevention of relapse in acute myeloid leukemia. Expert Rev Hematol. 2010;3:381–91. doi: 10.1586/ehm.10.30. [DOI] [PubMed] [Google Scholar]
- 17.Romero AI, Thoren FB, Aurelius J, Askarieh G, Brune M, Hellstrand K. Post-consolidation immunotherapy with histamine dihydrochloride and interleukin-2 in AML. Scand J Immunol. 2009;70:194–205. doi: 10.1111/j.1365-3083.2009.02303.x. [DOI] [PubMed] [Google Scholar]
- 18.Tötterman TH, Carlsson M, Simonsson B, Bengtsson M, Nilsson K. T-cell activation and subset patterns are altered in B-CLL and correlate with the stage of the disease. Blood. 1989;74:786–92. [PubMed] [Google Scholar]
- 19.Fayad L, Keating MJ, Reuben JM, O'Brien S, Lee BN, Lerner S, Kurzrock R. Interleukin-6 and interleukin-10 levels in chronic lymphocytic leukemia: correlation with phenotypic characteristics and outcome. Blood. 2001;97:256–63. doi: 10.1182/blood.v97.1.256. [DOI] [PubMed] [Google Scholar]
- 20.Chaouchi N, Wallon C, Goujard C, et al. Interleukin-13 inhibits interleukin-2-induced proliferation and protects chronic lymphocytic leukemia B cells from in vitro apoptosis. Blood. 1996;87:1022–9. [PubMed] [Google Scholar]
- 21.Fauriat C, Long EO, Ljunggren HG, Bryceson YT. Regulation of human NK-cell cytokine and chemokine production by target cell recognition. Blood. 2010;115:2167–76. doi: 10.1182/blood-2009-08-238469. [DOI] [PMC free article] [PubMed] [Google Scholar]
- 22.Montserrat E, Vinolas N, Reverter JC, Rozman C. Natural history of chronic lymphocytic leukemia: on the progression and progression and prognosis of early clinical stages. Nouv Rev Fr Hematol. 1988;30:359–61. [PubMed] [Google Scholar]
- 23.Schuler M, Tretter T, Schneller F, Huber C, Peschel C. Autocrine transforming growth factor-β from chronic lymphocytic leukemia-B cells interferes with proliferative T cell signals. Immunobiology. 1999;200:128–39. doi: 10.1016/s0171-2985(99)80038-2. [DOI] [PubMed] [Google Scholar]
- 24.Vredevoe DL, Widawski M, Fonarow GC, Hamilton M, Martinez-Maza O, Gage JR. Interleukin-6 (IL-6) expression and natural killer (NK) cell dysfunction and anergy in heart failure. Am J Cardiol. 2004;93:1007–11. doi: 10.1016/j.amjcard.2003.12.054. [DOI] [PubMed] [Google Scholar]
- 25.Scheid C, Young R, McDermott R, Fitzsimmons L, Scarffe JH, Stern PL. Immune function of patients receiving recombinant human interleukin-6 (IL-6) in a phase I clinical study: induction of C-reactive protein and IgE and inhibition of natural killer and lymphokine-activated killer cell activity. Cancer Immunol Immunother. 1994;38:119–26. doi: 10.1007/BF01526207. [DOI] [PMC free article] [PubMed] [Google Scholar]