Abstract
The comparative proteomic study of cell surfaces of native and drug-treated cancer cells was performed. To this end, cell proteomic footprinting, which reflects the mass spectrometry profiling of cell surface proteins, was applied to breast adenocarcinoma cells (MCF-7), which were untreated or treated with doxorubicin, tamoxifen, or etoposide. The footprints of drug-treated cells were compared with the footprints of untreated cells and the footprint of a randomly selected control cancer cell culture. It was found that drug-treated cells have reproducible, pronounced, and drug-specific changes in cell surface protein expression. Cytotoxicity assays, which are an in vitro model of human antitumor vaccination, revealed that the degree of these changes correlates directly with the ability of the cancer cells to escape cell death induced by a cytotoxic T-cell-mediated immune response. Moreover, cancer cells escape from the immune response was linearly approximated (R2 equal to 0.99) with the degree by which their proteomic footprints diverged from the footprint of the targeted (native) cancer cells. From these findings, it was concluded that the design of anticancer vaccines intended to prevent cancer recurrence after primary treatment should consider the drug-specific changes in cancer cell-surface antigens. Such changes can be easily identified by cell proteomic footprinting, renewing hopes for development of efficient cellular cancer vaccines.
Despite tremendous progress in basic and epidemiological research, effective prevention of most types of cancer is still lacking (1). Cancer recurrence after primary treatment contributes to the low five-year survival rate of 63% (2). Therefore, development of effective preventive therapies may profoundly reduce cancer-related death rates, and a vaccine that specifically prevents cancer recurrence is a promising prospect. Cancer vaccines contain cancer cell-specific antigens, and, thereby, may induce the immune response against cancer cells that may appear or are already in the body. Among cancer vaccines, vaccines that use cancer cells as a source of antigens have shown great potential for prevention of different types of cancers (3). Such cell-based vaccines are thought to have an advantage over other immunotherapies that target only specific epitopes because cell-based vaccines can induce an immune response against multiple tumor associated antigens (TAA)1, most of which have not been isolated or characterized (4). However, immunization with cancer cell-based vaccines has not resulted in significant long-term therapeutic benefits, so this aspect of cell-based vaccinations requires further development (5).
One of the main causes of cancer recurrence is the development of drug resistance by the cancer cells. Exposure to chemotherapy drugs kills cells that are sensitive to the effects of the drug, but drug-resistant cancer cells will survive and multiply (6). Therefore, cancer cells in a patient's body undergo strict selective pressure, and drug-treatment may induce changes in the cellular antigens expressed by a subset of cancer cells, allowing these drug-resistant cells to escape a vaccine-induced immune response, as well. These changes can be evaluated with proteomic studies comparing the cellular antigens expressed by cancer cells before and after drug-treatment. Obtained results can be compared with the ability of untreated and treated cells to escape from the immune response to determine whether drug-induced changes in cell-surface antigens prevent immune-mediated recognition and destruction of the cells.
It is known that the meaningful targets for immune responses are mainly domains of cell surface-expressed proteins and glycoproteins that are accessible to antibodies and cytotoxic immune cells (7–9). These targets are also accessible to proteases and, therefore, can be isolated in vitro by proteolytic cleavage. Recently, it was shown that these proteolytically separated cell-surface antigens can be analyzed easily using mass spectrometry, a technique related to cell proteomic footprinting (10). By comparing the proteomic footprint of drug-treated cancer cells with the proteomic footprint of the native cancer cells, the degree of drug-induced changes in cell-surface antigen expression can be measured. Therefore, this study compared the proteomic footprints of MCF-7 cancer cells before and after drug-treatment. The effect of the footprint change on the ability to escape from the immune response was determined with cytotoxicity assays, as an in vitro model of immune response following cell-based anticancer vaccination.
EXPERIMENTAL PROCEDURES
Determination of IC96 and IC50 Doses
Sensitivities of cell lines to various anticancer drugs were examined using the Cell-Counting Kit technique as detailed previously (11). Briefly, MCF-7 cells (human breast adenocarcinoma cell line; ATCC, Manassas, VA) were plated at a density of 1000–5000 cells per well in 96-well plates containing 100 μl of culture medium. After 24 h incubation at 37 °C, drugs (doxorubicin hydrochloride, tamoxifen, etoposide; Sigma-Aldrich) were added into wells to a final volume of 200 μl per well and incubated for an additional 72 h. Cell-Counting Kit reagent was then added into each well and incubated for 4 h before reading at a wavelength of 450 nm (Multiskan JX, Labsystems, Waltham, MA). Sublethal doses (submaximal inhibitory concentration (IC96); ∼96% of cells killed) and half maximal inhibitory concentration (IC50) were calculated from dose-response curves obtained from three independent experiments.
Cell Selection Protocol
Drug-selected MCF-7 cell cultures were established by employing a single-step selection with sublethal doses of doxorubicin, tamoxifen, or etoposide treatment for 3 days, followed by culture in drug-free medium. Briefly, 10,000 cells were seeded in a 100 × 20 mm tissue culture dish with drug. Medium with drug was changed three times during the selection and, subsequently, the cells were maintained in medium without drug until cells were 75% confluent. Additionally, MCF-7 cells were treated with an IC50 dose of etoposide, and MCF-7 cells treated with 2 separate IC50 or IC96 doses of etoposide.
Preparation of Tumor Associated Antigens from MCF-7 and HepG2 Cells
TAA were prepared as described previously (12). Untreated MCF-7 cells, drug-treated MCF-7 cells, and HepG2 cells (human hepatocellular carcinoma cell line, ATCC), were grown to 75% confluence in Dulbecco's modified Eagle's medium (Invitrogen, Carlsbad, CA) supplemented with 10% fetal bovine serum (Invitrogen). The cells were washed five times with Hank's Balanced Salt Solution and trypsin (0.2 μg/ml, 15,000 U/mg; Promega, Madison, WI) solution prepared on Hank's Balanced Salt Solution was added to the cells (40 μl/cm2). Cells were incubated at 37 °C in saturated humidity for 20 min before the trypsin solution was collected and centrifuged (600 × g for 5 min). The resulting supernatant contained cell-surface protein fragments, which naturally include TAA (12–14). TAA were obtained from the following cells: untreated MCF-7 cells (TAAuntr), untreated HepG2 cells (TAAHepG2), MCF-7 cells treated with doxorubicin (IC96) (TAADox), MCF-7 cells treated with tamoxifen (IC96) (TAATmx), MCF-7 cells treated with a single IC96 dose of etoposide (TAAEtop I), MCF-7 cells treated with two separate IC96 doses of etoposide (TAAEtop II), MCF-7 cells treated with a single IC50 dose of etoposide (TAAEtop I*), and MCF-7 cells treated with two separate IC50 doses of etoposide (TAAEtop II*). Cell viability after treatment with trypsin was confirmed by in situ trypan blue staining (12, 15).
Cell Proteomic Footprinting
The obtained antigen solutions were desalted by using ZipTipC18 (Millipore Corp., Billerica, MA) according to the manufacturer's protocol. Matrix-assisted laser desorption ionization (MALDI) samples were prepared using a standard “dried droplet” method with 2,5-dihydroxybenzoic acid as the matrix. All mass spectra were acquired on an AutoFLEX MALDI-time-of-flight (TOF) mass spectrometer (Bruker Daltonik, Germany) in linear positive ion mode. The mass spectrometer was set up for priority detection of ions with the m/z range from 600 to 3500 at a mass accuracy of 80–100 ppm. Mass peak lists were created manually. All peaks above noise level were selected to generate peak lists that represent the cell proteomic footprints (10).
Footprint Processing
Resultant lists of peak intensities from each cell culture (proteomic footprints) were pooled using Matlab software (Mathworks, USA). Two peaks were considered to be related to the same ion if their mass difference did not exceed 0.2 Da. Pooled intensities were processed by principal component analysis (PCA) using the princomp function of the Matlab program. Projections of peak intensities on the first two principal components were used for visualization of the similarity/divergence among footprints.
Preparation of TAA-loaded Dendritic Cells
The donor blood was kindly provided by Dr. Kira F. Kim (National Medico-Surgical Center, Moscow, Russia). The blood usage for the study was approved by relevant ethical review committee, and donor (healthy women, 39 years old) gave written informed consent. Dendritic cells (DC) were generated as described previously (16). Briefly, fresh peripheral blood mononuclear cells (PBMC) were isolated from donor blood by Ficoll-Hypaque gradient centrifugation and then allowed to adhere to culture flasks for 2 h. The nonadherent cell fraction was collected and centrifuged. Cell pellets were mixed with autologous serum containing 10% dimethyl sulfoxide and stored in liquid nitrogen. Cryopreserved nonadherent PBMC were used later as a source of effector cells (cytotoxic T lymphocytes, CTL) for cytotoxicity assays. The adherent cell fraction was harvested and cultured in RPMI 1640 (Invitrogen) supplemented with 10% fetal bovine serum in the presence of 1000 U/ml granulocyte macrophage colony-stimulating factor and 1000 U/ml interleukin-4 (Sigma-Aldrich) to produce immature DC. Immature DC were cultured for 6 days, then TAA solutions were added to equal volumes of immature DC. After 3 h of incubation, DC maturation was induced by treatment with 1000 U/ml of tumor necrosis factor-α (Sigma-Aldrich) for 48 h. For successive cycles of CTL stimulation, aliquots of TAA-loaded DC were cryopreserved and thawed as needed. The freezing method used was described previously (17).
Stimulation of CTL
TAA-loaded DC (4.5 × 10⁴) were combined with 9 × 10⁵ autologous nonadherent PBMC (1:20) in 4 ml of RPMI 1640 medium supplemented with 30 U/ml of clinical grade human interleukin-2 (Ronkoleukin, Russia) and 10% fetal bovine serum. The culture medium supplemented with interleukin-2 was replaced every third day. Additional antigen-loaded DC were added to PBMC 7 days after stimulation. After incubation for 5 days, the nonadherent PBMC containing stimulated CTL were washed by centrifugation and used as effector CTL in cytotoxicity assays.
Cytotoxicity Assays with CTL
MCF-7 cells were seeded at 5 × 10³ cells/well in 48-well culture plates. After 48 h of incubation, cultures expanded to 5 × 10⁴ cells/well. At this point, effector CTL were added to MCF-7 cells at a ratio of 8:1. After 24 h of incubation, wells were washed to remove CTL, and the remaining attached cancer cells were trypsinized and measured for viability by trypan blue exclusion (18). Cell counts from three separate measurements were averaged, and the number of surviving cancer cells was plotted against correlation coefficients calculated pairwise for the proteomic footprints of target (native) MCF-7 cells and the drug-treated cells used to obtain the TAA. Additionally, the cancer cells remaining in the wells after the cytotoxicity assay were photographed using an inverted microscope (Olympus CKX41).
RESULTS
Drug Selection of MCF-7 Cells
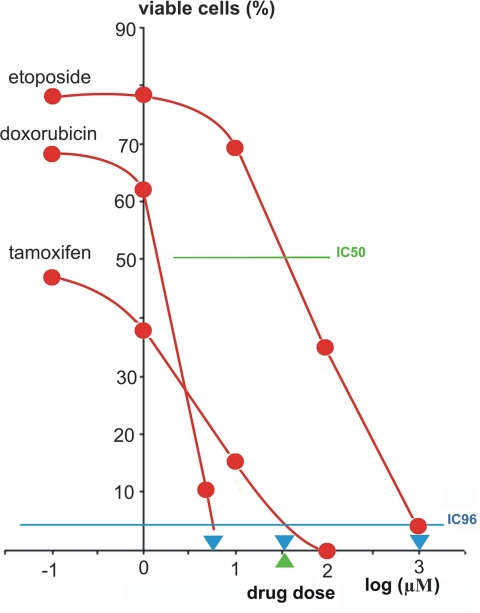
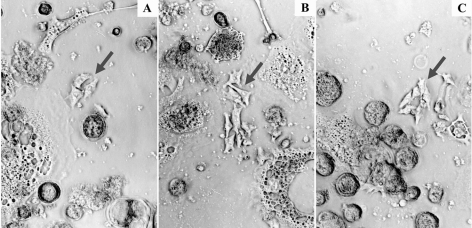
In MCF-7 cells, the IC96 were determined to be 5.5 μm for doxorubicin, 32 μm for tamoxifen, and 1000 μm for etoposide. The IC50 dose of etoposide was 5.5 μm (Fig. 1). Therefore, these doses were used for the selection of drug-resistant cells. Treatment of MCF-7 cells with the selected doses resulted in survival of separate cells, which formed cell islands during cultivation (Fig. 2). When these cells were 75% confluent, they were used for preparing TAA solutions.
Fig. 1.
Dose-response curves of MCF-7 cells following treatment with anti-cancer drugs. Sublethal doses (blue triangles) were defined as the points at which the blue line, representing IC96, crosses the dose-response curves. The green triangle shows the IC50 dose for etoposide.
Fig. 2.
Islands of drug-selected MCF-7 cells. Islands of MCF-7 cells grew from single cells that survived after cell treatment with doxorubicin (A), tamoxifen (B), and etoposide (C) at sublethal doses. Debris of lysed cells is observed around islands of viable cells. Cell islands are marked by arrows.
Cell Proteomic Footprinting
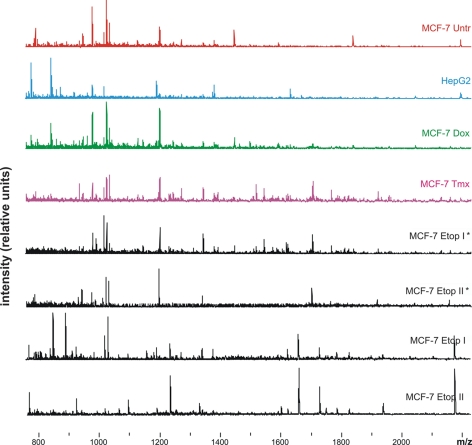
MALDI-TOF mass spectrometry analysis of TAA resulted in detection of 180 ± 27 (mean ± standard deviation) positively charged ions of (glyco)peptides per sample. No significant changes in the number of detected ions were found between cell cultures. Typical mass spectra are shown in Fig. 3.
Fig. 3.
Mass spectra used to generate proteomic footprints. Representative spectra obtained for untreated MCF-7 cells (MCF-7 Untr) and MCF-7 cells treated with: IC96 doses of doxorubicin (MCF-7 Dox) or tamoxifen (MCF-7 Tmx); a single dose of IC96 etoposide (MCF-7 Etop I) or IC50 etoposide (MCF-7 Etop I*); and two separate doses of IC96 etoposide (MCF-7 Etop II) or IC50 etoposide (MCF-7 Etop II*).
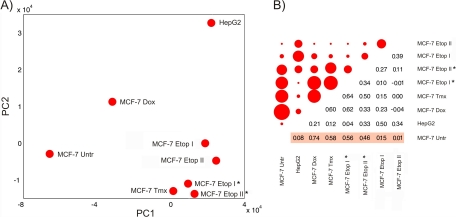
PCA analysis revealed that the data in the proteomic footprints may be projected in the space of the two principal components (Fig. 4A), which covered ∼75% (61.3% and 13.9% for PC1 and PC2, respectively; values returned by the princomp function) of all variability presented in footprints. The PCA plot showed that spots related to footprints of drug-treated cells were located far from the spot for untreated MCF-7 cells. When the distances between the untreated MCF-7 cell spot and all other spots were measured, the closest spot was related to cells treated with doxorubicin. In the PC1 space, spots related to MCF-7 cells treated with etoposide and tamoxifen were close together, and the distance between these spots and the untreated MCF-7 cells spot was almost equal to the distance between the spot for HepG2 cells and untreated MCF-7 cells. Spots related to cells treated with single and double doses of etoposide are located in the same area of the PC space.
Fig. 4.
PCA and correlation analysis of cancer cell proteomic footprints. Proteomic footprints were projected in the space of the first two principal components (A). Matrix of calculated pairwise correlation coefficients for the proteomic footprints (B). The upper, left part of the matrix shows the pairwise correlation of footprints as circles, with the diameters reflecting the correlation coefficient value. The lower, right part of the matrix shows the actual correlation coefficient values. Autocorrelation values (diagonal values) were all equal to 1 and are not presented in diagram. “MCF-7 Untr” - MCF-7 cells untreated with drug; “MCF-7 Dox” - MCF-7 cells treated with doxorubicin; “MCF-7 Tmx” - MCF-7 cells treated with tamoxifen; “MCF-7 Etop” - MCF-7 cells treated with etoposide (I & II relates to single and double-treated with drug cells, “*” - MCF-7 cells treated with etoposide IC50). Correlation coefficients used for superimpositions with the results of cytotoxicity assays are highlighted in pink.
Footprint correlation analysis confirmed that cell treatment with doxorubicin does not cause a pronounced change in the identity of cell-surface antigens (Fig. 4B). However, cell surfaces are affected substantially by cell treatment with etoposide or tamoxifen. Moreover, footprints of cells double-treated with IC96 doses of etoposide diverged substantially from footprints of untreated cells, and the degree of divergence was similar to the degree of divergence between footprints of control HepG2 cells and untreated MCF-7 cells.
Cytotoxicity Assays
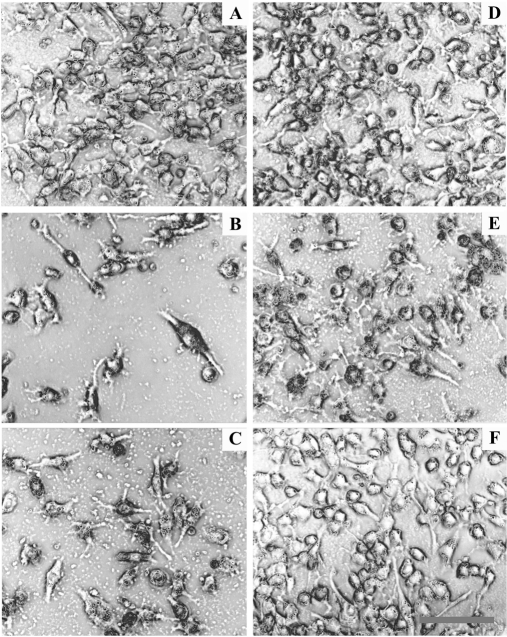
Microscopic inspection of target cells during the cytotoxicity assays revealed that the growth of target cells was not affected by incubation with CTL stimulated with unloaded DC (Fig. 5A). In contrast, CTL stimulated with TAAuntr-loaded DC or TAADox-loaded DC killed ∼90% of target MCF-7 cells (Figs. 5B,5C), whereas CTL stimulated with TAATmx-loaded DC killed only 40–50% of target cells (Fig. 5E). Cytotoxic activity was not observed when MCF-7 cells were incubated with CTL stimulated with TAAEtop II-loadedor TAAHepG2-loaded DC (Fig. 5D, 5F).
Fig. 5.
CTL-mediated lysis of MCF-7 cells during cytotoxicity assays. A, MCF-7 cells incubated with CTL stimulated with unloaded DC. B, MCF-7 cells incubated with CTL stimulated with TAAuntr-loaded DC. C, MCF-7 cells incubated with CTL stimulated with TAADox-loaded DC. D, MCF-7 cells incubated with CTL stimulated with TAAHepG2-loaded DC. E, MCF-7 cells incubated with CTL stimulated with TAATmx-loaded DC. F, MCF-7 cells incubated with CTL stimulated with TAAEtop II -loaded DC. (scale bar: 50 μm).
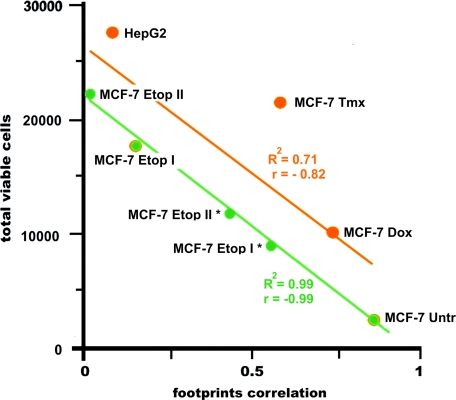
Counts of viable cells measured in cytotoxicity assays were negatively correlated (r = –0.82) and linearly approximated (R2 = 0.71) with the values of the footprint correlations calculated pairwise for target MCF-7 cells and drug-treated cells from which TAA were obtained. For untreated and etoposide-treated MCF-7 cells, r and R2 were equal to –0.99 and 0.99, respectively (Fig. 6).
Fig. 6.
Cytotoxicity of effector CTL against MCF-7 cells versus footprint correlation. Linear approximations for MCF-7 Untr and MCF-7 Etop I, II, I*, II* (green line) and MCF-7 Untr, MCF-7 Dox, MCF-7 Tmx, MCF-7 Etop I, and HepG2 (orange line) are presented. An average number of viable cells in three wells are presented. The standard deviations for the numbers of viable cells were in range of 1400–3200 cells. R2, accuracy of approximation; r, correlation coefficient for approximated points.
DISCUSSION
To perform a comparative proteomic study of cancer cells before and after drug treatment, we employed rapid, single-step cell selection with sublethal drug doses to imitate almost total elimination of cancer cells by chemotherapy. In this case, surviving cancer cells are a good model of drug-selected cancer cells, which are the primary cause of cancer recurrence. Therefore, the antigen profiles of these cells were determined as an in vitro model designed to investigate the means by which these cells escape the immune response induced by cellular antigens.
The relevant targets for vaccine-induced immune responses are mainly domains of surface-expressed proteins and glycoproteins because they are accessible to antibodies and cytotoxic immune cells (7–9, 19). These targets are also accessible to proteases and, therefore, can be isolated from the viable cells by proteolytic cleavage at noncytolytic conditions. At these conditions, contamination of obtained surface antigens with undesired intracellular content is avoided (12–14), and the antigens can be profiled directly using mass spectrometry. This technique is related to ‘proteomic footprinting’ (10). Therefore, proteomic footprinting was applied to the drug-selected MCF-7 cells, and obtained footprints were compared with the footprints of native (i.e. untreated with drug) MCF-7 cells.
Visualization of the relationships between proteomic footprints was a first step in the footprint analysis. Footprints represent multivariable (multidimensional) characteristics of cells and consist of hundreds of peak intensities (variables). Therefore, the data reduction to two dimensions was essential. For this purpose, proteomic footprints were replaced by their projections in the space of the two principal components, which covered almost all variability presented in the footprints. Thus, dimensionality reduction was performed without essential loss of data, and the PCA plot demonstrates true relationships existing between footprints. From this plot, it may be realized that drug selection leads to pronounced and drug-specific changes on the surface of cancer cells. The spots relating to double etoposide IC96-treated MCF-7 cells were as far from the spot for native MCF-7 cells as the spot for unspecific control (HepG2 cells). This means that the profile of surface antigens on etoposide-treated cells lost specificity completely in relation to native cells. However, it may be concluded that tamoxifen induces fewer changes in cell-surface antigen expression. Changes induced by doxorubicin can be considered almost insignificant. Therefore, changes in cell-surface antigen expression induced by drug treatment can be considered drug-specific and ranged from relatively insignificant to pronounced.
To reveal any correlation between the observed changes in cell surface profiles of the cancer cells and their escape from immune response, a pairwise comparison of each footprint with the footprint of native MCF-7 cells was performed by correlation analysis. Obtained data were plotted against the results of cytotoxicity assays, where native MCF-7 cells were used as target cells. Results clearly showed that if drug selection was performed with the same drug, but at different doses and number of treatments, the cell escape from immune response depends strictly on cell-surface changes induced by this drug, which may lead to total escape from the immune response. Moreover, cancer cell escape from immune response can be exactly predicted by proteomic footprint data because they are linearly approximated, with R2 almost equal to 1.
When different drugs were used for cell selection, induced changes in cell surface protein expression correlated less strictly with the ability of cells to escape from the CTL-mediated immune response. This phenomenon may be explained. Besides the fact that treatment of cells with different drugs resulted in selection of cell populations with different antigen profiles, these profiles include antigens with different antigenic properties. Therefore, cancer cell escape from CTL-mediated immune response is likely to be a combined result of altered cell surface antigen profile, which was directly reflected in proteomic footprints, and antigenic properties of each particular antigen profile. The relatively high accuracy of linear approximation observed in this study shows that cell escape can be predicted from the footprinting data, as well, and it can be done for cancer cells treated with unidentified drug or drug composition.
CONCLUSION
We have demonstrated that the specific antigens expressed on the cell-surface of cancer cells are substantially modified under selective pressure of chemotherapeutic drugs. Induced changes are drug-specific, reproducible, and may be pronounced. The cancer cells escape from the immune response correlates directly with the degree of these changes in antigen expression. Therefore, cellular cancer vaccines developed for administration after chemotherapy treatments must be designed with the differential expression of cell-surface antigens induced by the chemotherapy in mind. Cell proteomic footprinting, which is a reproducible and informative method for profiling cell surface targets, may be a valuable method for identifying the changes in cell-surface protein expression.
Acknowledgments
We would like to thank Dr. Kira F. Kim (National Medico-Surgical Center, Moscow, Russia) for kindly provided donor blood.
Footnotes
* This work was funded by ZAO BioBohemia (Moscow, Russia).
1 The abbreviations used are:
- TAA
- tumor associated antigens
- DC
- dendritic cells
- PBMC
- peripheral blood mononuclear cells
- CTL
- cytotoxic T lymphocytes
- IC50
- half maximal inhibitory concentration
- IC96
- submaximal inhibitory concentration
- PCA
- principal component analysis.
REFERENCES
- 1. Lollini P. L., Cavallo F., Nanni P., Forni G. (2006) Vaccines for tumour prevention. Nat. Rev. Cancer 6, 204–216 [DOI] [PubMed] [Google Scholar]
- 2. Brenner H. (2002) Long-term survival rates of cancer patients achieved by the end of the 20th century: a period analysis. Lancet 360, 1131–1135 [DOI] [PubMed] [Google Scholar]
- 3.[No_authors_listed] (2008) Trial watch : Progress for Phase III cancer vaccines. Nat. Rev. Drug Discov. 7, 966–967 [DOI] [PubMed] [Google Scholar]
- 4. Copier J., Dalgleish A. (2006) Overview of tumor cell-based vaccines. Int. Rev. Immunol. 25, 297–319 [DOI] [PubMed] [Google Scholar]
- 5. D'Elios M. M., Del Prete G., Amedei A. (2009) New frontiers in cell-based immunotherapy of cancer. Expert. Opin. Ther. Pat. 19, 623–641 [DOI] [PubMed] [Google Scholar]
- 6. Gottesman M. M. (2002) Mechanisms of cancer drug resistance. Annu. Rev. Med. 53, 615–627 [DOI] [PubMed] [Google Scholar]
- 7. Fukuda M. (1996) Possible roles of tumor-associated carbohydrate antigens. Cancer Res. 56, 2237–2244 [PubMed] [Google Scholar]
- 8. Hakomori S. (2001) Tumor-associated carbohydrate antigens defining tumor malignancy: basis for development of anti-cancer vaccines. Adv. Exp. Med. Biol. 491, 369–402 [DOI] [PubMed] [Google Scholar]
- 9. Dalgleish A., Pandha H. (2007) Tumor antigens as surrogate markers and targets for therapy and vaccines. Adv. Cancer Res. 96, 175–190 [DOI] [PubMed] [Google Scholar]
- 10. Lokhov P., Balashova E., Dashtiev M. (2009) Cell proteomic footprint. Rapid Commun. Mass Spectrom 23, 680–682 [DOI] [PubMed] [Google Scholar]
- 11. Ishiyama M., Tominaga H., Shiga M., Sasamoto K., Ohkura Y., Ueno K. (1996) A combined assay of cell viability and in vitro cytotoxicity with a highly water-soluble tetrazolium salt, neutral red and crystal violet. Biol. Pharm. Bull. 19, 1518–1520 [DOI] [PubMed] [Google Scholar]
- 12. Balashova E. E., Lokhov P. G. (2010) Proteolytically-cleaved fragments of cell surface proteins stimulate a cytotoxic immune response against tumor-activated endothelial cells in vitro. J. Cancer Sci. Ther. 2, 126–131 [Google Scholar]
- 13. Lokhov P. G., Balashova E. E. (2010) Cellular cancer vaccines: an update on the development of vaccines generated from cell surface antigens. J. Cancer 1, 230–241 [DOI] [PMC free article] [PubMed] [Google Scholar]
- 14. Balashova E. E., Lokhov P. G. (2010) Proteolytically-cleaved fragments of cell-surface proteins from live tumor cells stimulate anti-tumor immune response in vitro. J. Carcinogenesis Mutagenesis 1, 1–3 [Google Scholar]
- 15. Hudson L., Hay F. C., eds. (1980) Practical Immunology., Blackwell Scientific Publications, Oxford [Google Scholar]
- 16. Romani N., Gruner S., Brang D., Kämpgen E., Lenz A., Trockenbacher B., Konwalinka G., Fritsch P. O., Steinman R. M., Schuler G. (1994) Proliferating dendritic cell progenitors in human blood. J. Exp. Med. 180, 83–93 [DOI] [PMC free article] [PubMed] [Google Scholar]
- 17. John J., Dalgleish A., Melcher A., Pandha H. (2005) Cryopreserved dendritic cells for intratumoral immunotherapy do not require re-culture prior to human vaccination. J. Immunol. Methods 299, 37–46 [DOI] [PubMed] [Google Scholar]
- 18. Yun C. O., Nolan K. F., Beecham E. J., Reisfeld R. A., Junghans R. P. (2000) Targeting of T lymphocytes to melanoma cells through chimeric anti-GD3 immunoglobulin T-cell receptors. Neoplasia 2, 449–459 [DOI] [PMC free article] [PubMed] [Google Scholar]
- 19. Hakomori S. (1984) Tumor-associated carbohydrate antigens. Annu. Rev. Immunol. 2, 103–126 [DOI] [PubMed] [Google Scholar]


