Abstract
Smooth muscle contains multiple muscarinic receptor subtypes, including M2 and M3. M2 receptors outnumber M3 receptors. Based on the potency of subtype selective anticholinergics, contraction is mediated by the M3 subtype. However, results from knockout (KO) mice show that the M2 receptor mediates approximately 45% of the contractile response produced by the M3 receptor. The traditional theory of one receptor mediating a response does not allow assessment of interactions between receptors when more than one receptor participates in a response. Our study was performed using a novel analysis method based on dual receptor occupancy to determine how M2 and M3 receptor subtypes interact to mediate contraction in mouse stomach. Cumulative carbachol concentration contractile responses were determined for wild-type, M2-KO, and M3-KO stomach body smooth muscle. Using affinity constants for carbachol at M2 and M3 cholinergic receptors, the concentration values were converted to fractional receptor occupation. The resulting occupation-effect relations showed maximum effects for the M2 and M3 subtypes, respectively. These occupation-effect relations allow determination of the additive (expected) isobole based on this dual occupancy, thereby providing a curve (mathematically derived) for comparison against the experimentally derived value in wild type. The actual values determined experimentally in the wild type were not statistically significantly different from that predicted by the isobole. This confirms that the interaction between these mutually occupied receptors is additive. The new method of analysis also expands the traditional Schild theory that was based on a single receptor type to which the agonist and antagonist bind.
Cholinergic contractions of gastrointestinal smooth muscle are primarily mediated through the M3 receptor subtype. However, the majority of muscarinic receptors in the gastro-intestinal tract as well as other smooth muscles are the M2 receptor subtype (Gerthoffer, 2005). Five muscarinic receptor subtypes, designated M1 to M5, exist. The M1, M3, and M5 subtypes predominantly couple to Gq, whereas the M2 and M4 subtypes predominantly couple to Gi (Caulfield, 1993; Caulfield and Birdsall, 1998). It has been proposed that the M2 receptor aids in contraction by inhibiting the increased cAMP generated in response to β-adrenergic receptor-stimulated smooth muscle relaxation (Ehlert and Thomas, 1995; Ehlert et al., 2007).
In the urinary bladder, although cholinergic contractions are predominantly M3 receptor mediated, the M2 subtype contributes to contraction in rats (Braverman and Ruggieri, 2003; Gevaert et al., 2006) and humans (Pontari et al., 2004; Braverman et al., 2007). In addition, the M2 receptor mediates esophageal muscle contraction and contributes to lower esophageal sphincter contraction after induction of esophagitis (Biancani et al., 1992). Based on the potency of subtype selective muscarinic receptor antagonists, no contractile role for the M2 receptor has been described in the mouse bladder (Choppin and Eglen, 2001). Even when the majority of M3 receptors are inactivated using 4-diphenlacetoxy-N-methylpiperidine methiodide mustard in an environment of β-adrenergic receptor activation, the M2 receptor in the mouse urinary bladder does not appear to have a contractile function (Choppin, 2002). This is in contrast to findings in the rat (Braverman and Ruggieri, 1999) or pig (Yamanishi et al., 2002) urinary bladder and guinea pig ileum or trachea (Ostrom and Ehlert, 1999), in which the M2 receptor does play a role in contraction after M3 receptor inactivation with 4-diphenlacetoxy-N-methylpiperidine methiodide mustard and augmentation of intracellular cAMP.
Results using M2, M3, and combined M2/M3 knockout (KO) mice demonstrate that although the M2 receptor is capable of producing only a minor contraction in the urinary bladder (approximately 5% of wild type), the M2 receptor in the stomach body can mediate a contraction that is approximately 35% of wild type (Matsui et al., 2000; Stengel et al., 2000; Bymaster et al., 2001). A major limitation of previously used mathematical models lies in the underlying assumption that a single receptor mediates a given response. It is becoming increasing clear that many responses to a given agonist, including smooth muscle contraction, are mediated by more than one receptor subtype. This requires new data analysis methods.
Isobolar analysis, historically important in pharmacological investigations that began with Loewe (1953) and greatly expanded and applied by Tallarida (2000, 2006, 2007), is based on the concept of dose equivalence of two compounds, i.e., doses of the individual compounds that give the same effect. Briefly stated, dose a of drug A has its equivalent of drug B, which we may denote beq. Thus, an actual dose pair (a + b) is taken as beq + b. This added quantity is then used in drug B’s dose-effect equation to yield the predicted effect (E), thereby providing E as a function of combination dose pairs (a, b). A useful visual is the isobole, a graph derived from the above function that plots a, b combinations that give a constant level of effect. Because this derived graph uses the numerical addition (b + beq) of the occupancies derived from each receptor subtype for the same agent (carbachol), the graph is an occupancy isobole. Whether derived for two drugs or two different receptors with the same drug, the isobole allows a determination of the additive combination and, thus, provides a basis for comparing an experimental combination for departures from additivity. If the experimental combination (point) is below the isobole, the combination is synergistic, whereas a point above the isobole means subadditivity.
Until recently, major attention has not been directed toward the analysis of dual receptor-mediated effects, especially in circumstances in which no completely selective agonists or antagonists are available, as is the case for muscarinic receptors. The aims of the present study were to use a novel approach, a method based on isobolar analysis, to determine whether there is an interaction between M2- and M3-mediated contractile signal transduction mechanisms in the mouse stomach.
Materials and Methods
Materials
Carbachol, atropine, and all other reagents were obtained from Sigma-Aldrich (St. Louis, MO). M2-KO and M3-KO mice and their wild-type background strains were kindly provided by Dr. Jurgan Wess, Chief, Molecular Signaling Section (Laboratory of Bioorganic Chemistry, National Institutes of Health-National Institute of Diabetes and Digestive and Kidney Diseases, Bethesda, MD). Generation of the M2 and M3 receptor knockout mice has been described previously (Gomeza et al., 1999; Yamada et al., 2001; Struckmann et al., 2003). The genetic background of these mice was 129J1 (50%) × CF1 (50%) for the M2-KO and their corresponding WT mice and 129 vEv (50%) × CF1 (50%) for the M3-KO and their corresponding WT mice.
Muscle Strips
Stomachs were removed from mice euthanized by N2 asphyxiation after isoflurane anesthesia. Both the fundus and the antrum were removed, the stomach body was opened along the long axis, and muscle strips were cut aligned with the circular muscle fibers (approximately 2 × 5 mm). The muscle strips were then suspended with 0.5 g of tension in tissue baths containing 10 ml of modified Tyrode’s solution (125 mM NaCl, 2.7 mM KCl, 0.4 mM NaH2PO4, 1.8 mM CaCl2, 0.5 mM MgCl2, 23.8 mM NaHCO3, and 5.6 mM glucose) and equilibrated with 95/5% O2/CO2 at 37°C.
Carbachol Concentration Response
After equilibration to the bath solution for 30 min, the contractile response induced by 120 mM potassium in isotonic Tyrode’s solution was recorded. The strips were incubated for 30 min either in the absence or presence of atropine (30, 100, and 300 nM), then concentration response curves were derived from the peak tension developed after cumulative addition of carbachol (10 nM to 300 μM final bath concentration) and normalized to the initial 120 mM KCl response. In this experimental paradigm, each muscle strip was exposed to either atropine or vehicle, followed by graded doses of carbachol to yield the concentration-effect data.
Theory and Data Analysis
Concentration-effect data for carbachol, obtained using stomach body from M2-KO, M3-KO, and wild-type (containing both M2 and M3 receptors) mice were collected, and the concentrations were subsequently transformed to fractional receptor occupation-effect values. This transformation uses each muscarinic receptor’s dissociation constant (K) for carbachol and the concentration [C] in the equilibrium mass-action formula, [C]/([C] + K}), where the appropriate Ks for the M2 and M3 receptor are inserted. The K values for carbachol, obtained from the National Institute of Mental Health’s Psychoactive Drug Screening Program (PDSP; Contract NO1MH32004), are as follows: 2.75 μM for M2 and 62 μM for M3 occupancy. The value used for the K of carbachol at the M2 receptor, which is known to be influenced by GTP, was based on determinations made in the absence of GTP. This K value is similar to the affinity we have previously determined in the absence of GTP for carbachol displacement of [3H]N-methyl scopolamine binding in rat urinary bladder membranes (Wang et al., 1995). The resulting occupancy-effect data for the M2 and the M3 muscarinic receptor are fitted to equations of the usual form given below and accomplished with standard nonlinear regression (for example, see Tallarida, 2000).
Occupation fraction at M2, denoted by x, gives effect E as follows: E = (EAxq)/(xq + CAq) (x≤ 1), where the constants, EA, CA, and q (Hill coefficient) are determined by standard nonlinear regression. Occupation fraction at M3, denoted by y, gives effect E as follows: E = (EByp)/(yp + CBp) (y≤ 1), with parameters EB, CB, and p also determined by nonlinear regression. The two occupation-effect relations are then used in an isobolar analysis as previously described (Tallarida, 2006, 2007) and further elaborated here using a graph (Fig. 1) to illustrate the genesis of the occupation isobole.
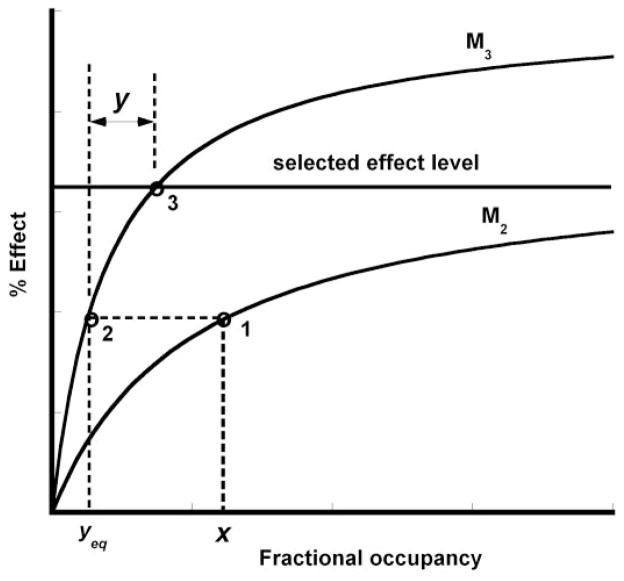
Fig. 1.
Two occupation-effect curves used to illustrate the construction of the occupation isobole. For details, see text.
Figure 1 illustrates the process by starting with the occupation-effect curve for each receptor. A level of effect (developed tension in this case) is selected. We used 40% of the KCl maximum tension. The figure shows an arbitrary fractional occupancy x of receptor on the M2 curve (point 1). As seen, this x value does not give the selected effect. We now illustrate how much occupation y of receptor M3 is needed to get to that desired effect level. Toward that end, it is seen that x has an M3 equivalent, yeq (point 2). However, that quantity, x, transformed to its y-equivalent, gets us only to the same height (point 2) on the effect scale. To attain the selected effect, (i.e., to get to point 3), one needs to have an actual occupation of M3 in amount y indicated by the arrow length labeled y to get to point 3; that is, this needed quantity y is the difference between the fractional occupations at points 3 and 2. This is shown mathematically below. With that y determined, the set of occupation pairs (x, y) defined in this way are predicted to yield the selected effect if these receptor occupations are additive, i.e., the set of pairs (x, y) defines the isobole for the designated effect. This is identical to the dose addition reasoning used in the two-drug isobole construction and accounts for the term “additive.” As we show mathematically below, the isobole is generally curvilinear. Its equation, in terms of fractional occupancies x and y, is the same as that derived for the usual two-drug isobole that was given by Grabovsky and Tallarida (2004) and further detailed by Tallarida (2006, 2007). The mathematical detail is given below.
The above occupation-effect equations allow a determination of the equieffective occupations by equating their right-hand sides, an operation that yields y in terms of x and, thus, the y-equivalent of occupation x, as given below after algebraic manipulation:
| (1) |
The sum, yeq + y, must add to the fractional y-occupancy that gives the desired effect (point 3 in Fig. 1) and that y is denoted here by Y3; thus, y + yeq = Y3 or
| (2) |
Equation 2 is the additive isobole. It is called additive because it is based on the addition of occupancies, y + yeq, which is equivalent to the dose addition concept that underlies the usual two-drug isobole. In this application, the isobole defines the fractional occupation pairs (x, y) that are expected to give this effect level. In other words, if the desired effect is experimentally achieved by an occupation pair on this curve, there is no interaction between the occupied receptors. The isobole, generally, is a curvilinear relation (Grabovsky and Tallarida, 2004) (for the parameter values, the value of Y3, and the consequent isobole equation in the current application, see Results). Thus, the isobole is a curve of constant effect for all combinations of M2 and M3 fractional occupancy. The isobole so derived allows a determination of the expected occupancy pair in the wild type that contains both receptor types. The experiment in the wild-type preparation gives the value of the agonist concentration and, thus, the occupation pair for that concentration that is actually needed to attain the specified effect. That experimentally derived occupation pair is then plotted as a single point on the graph containing the isobole, and that point’s location in relation to the isobole allows the determination of any interaction between occupied receptors as described under Results.
In experiments with the competitive inhibitor atropine in fixed concentration [B], the fractional agonist occupation of either receptor at equilibrium is no longer [C]/([C] + K); instead, it is given by the well known equation for competitive block (Gaddum, 1937): {[C]/([C] + K (1 + [B]/KB)}, where K and KB are the dissociation constants for carbachol (National Institute of Mental Health PDSP database) and atropine (Caulfield, 1993; Caulfield and Birdsall, 1998), respectively, at the receptor of interest. At the M2 muscarinic receptor, these are K = 2.75 μM and KB = 1.26 nM, whereas at the M3 receptor, these are K = 62 μM and KB = 0.316 nM.
The complexity of the isobole equation precludes an exact calculation of its variance. As a result, variance estimates were made by the delta method, a well known technique of statistical analysis that is based on a truncated Taylor series expansion (Oehlert, 1992).
Results
To determine whether the muscle strips from each animal strain are able to generate the same force, the contraction generated by 120 mM KCl was determined for each muscle strip. There were no statistically significant differences between the 120 mM KCl-induced tension in muscle strips from WT, M2-KO, and M3-KO strains (Fig. 2). Graded dose-effect data for carbachol in the M2 knockout and the M3 knockout strains were obtained and are plotted in Fig. 3. In this, and in all subsequent cases, the effect is a percentage of the maximum KCl-induced tension. Also shown are the concentration-effect data and the fitted curve for the wild type. As seen in Fig. 3, the greatest response elicited by carbachol was significantly lower (p < 0.01) in M3-KO stomach strips (34.5% of KCl response, n = 21) compared with stomach strips from either the WT (80.5% of KCl response, n = 38) or the M2-KO (78.4% of the KCl response, n = 13) strains at the largest concentration tested. There was no significant difference in the maximal carbachol-stimulated contraction between WT and M2-KO animals. The data and, thus, the curves of concentration-effect were transformed to occupation effect for each of the knockout preparations.
Fig. 2.
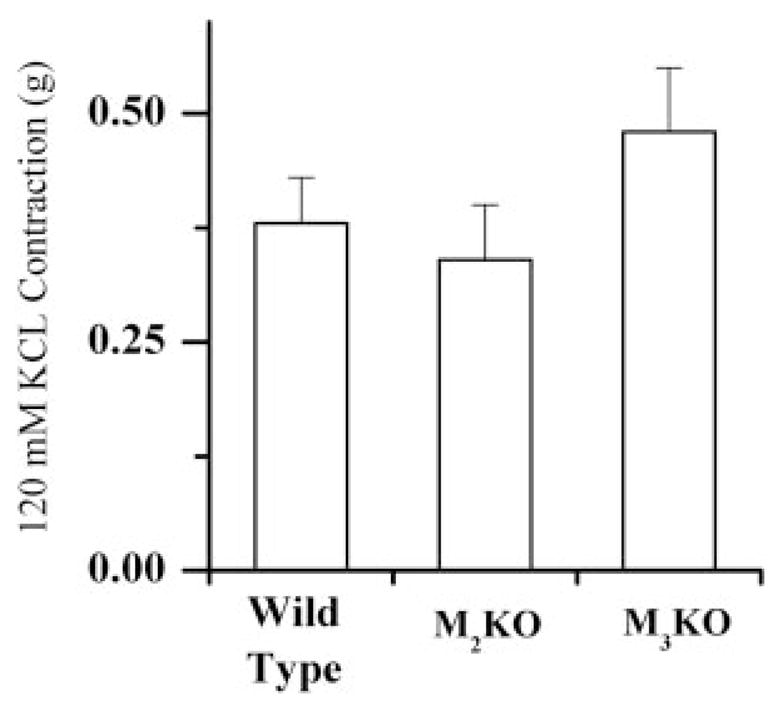
Tension developed (±S.E.M.) in stomach body muscle strips in response to 120 mM KCl isotonic Tyrode’s solution. WT, n = 19; M2-KO, n = 12; M3-KO, n = 19.
Fig. 3.
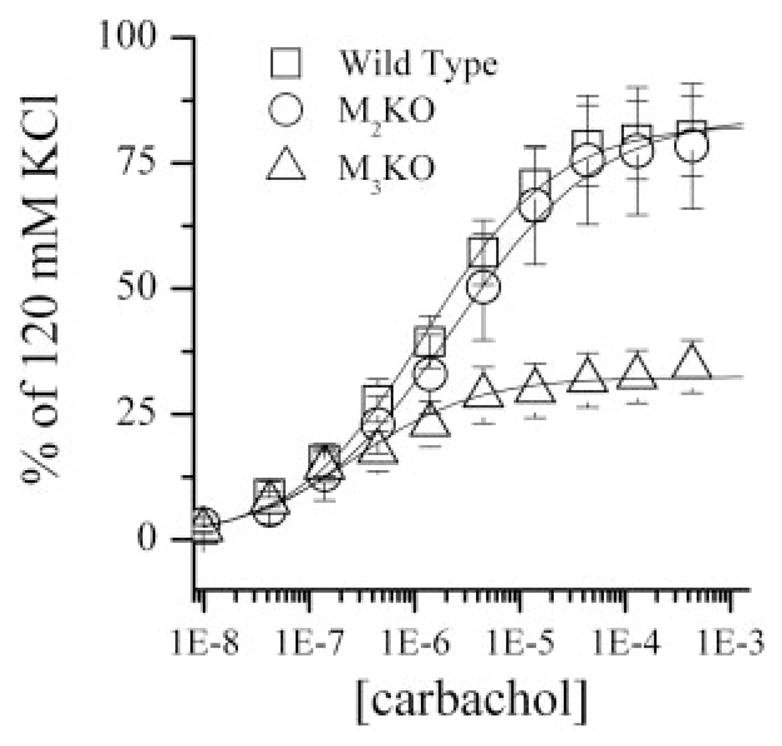
Cumulative carbachol concentration effect curves (±S.E.M.) normalized to each individual muscle strip’s contractile response to 120 mM KCl. WT, n = 19; M2-KO, n = 12; M3-KO, n = 19.
The fractional occupation for each used the carbachol K values and the mass action binding given under Materials and Methods, with K = 2.75 μM for M2 and K = 62 μM for M3. The resulting occupation-effect relations resulted in curves of the form described under Materials and Methods, with parameter values from nonlinear regression as follows: for the M2 receptor, EA = 48.66, CA = 0.334, and q = 0.544; and for the M3 receptor, EB = 89.44, CB = 0.0403, and p = 0.642. These relations are displayed as curves in Fig. 4 and, like the concentration-effect curves, show the effect as a percentage of the KCl maximum tension. The legend to this figure also provides these relations as equations resulting from substituting the above parameters in the equation described under Materials and Methods. The fitted curve for the M2-KO group allowed the calculation of the M3 fractional occupation that alone gives any level of effect. For our analysis, which is based on our selection of effect = 40%, the M3 fractional occupation = 0.0289, and this is the value Y3 needed for the selected effect that was described under Materials and Methods. Substitution of the value of Y3 and the above curve-fitting parameters in eq. 2 led to the following:
| (3) |
Fig. 4.
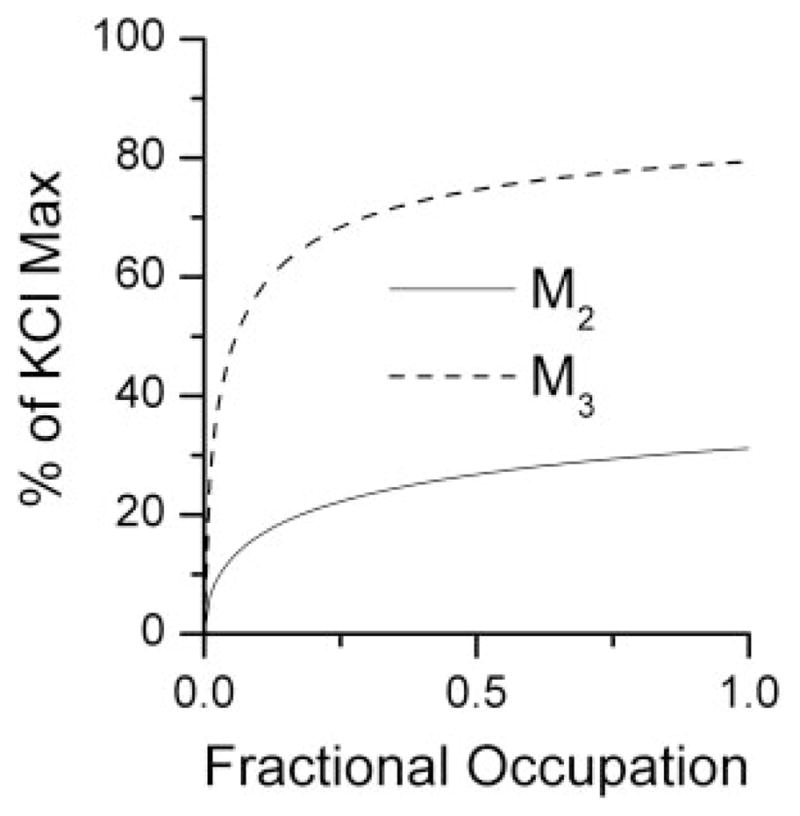
Effect against M2 fractional receptor occupation obtained from the M3 knockout experiment is shown as a smooth curve given by E = (48.65x0.544)/(x0.544 + 0.3440.544) as described under Materials and Methods. The fitted curve from M2 knockouts for M3 fractional occupation is given by E = (89.44y0.642)/(y0.642+ 0.04030.642).
Re-arranging and simplifying the above gives:
| (4) |
In these equations, y is the M3 fractional occupancy, and x is the M2 fractional occupancy. This relation defines the M2-M3 carbachol occupation isobole, which is shown as the solid curve in Fig. 5, and it represents all possible occupancy pairs (x, y) that are additive in producing the 40% effect level we selected.
Fig. 5.
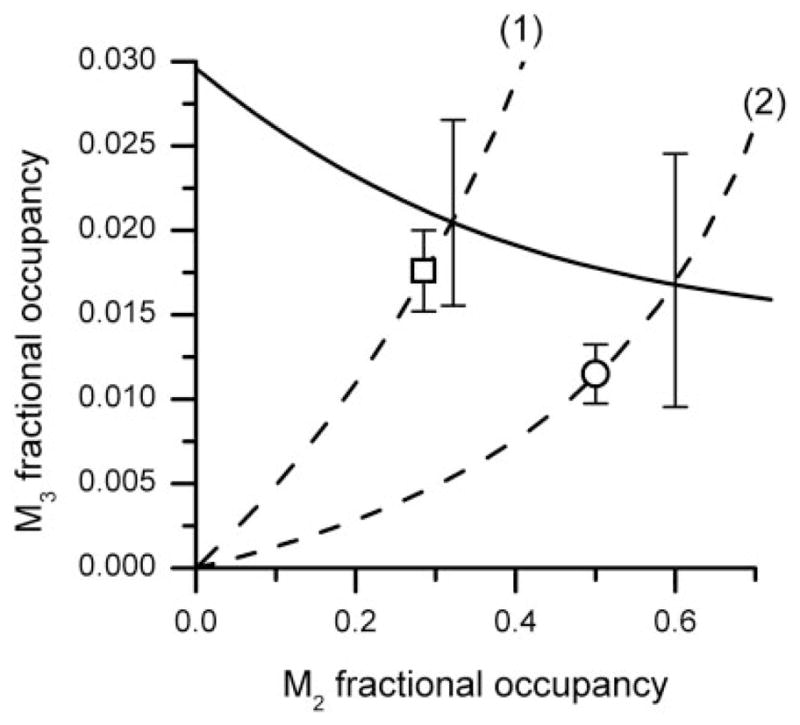
The isobole of additivity (solid curve) for effect = 40% KCl maximum is shown along with path (1) representing M2-M3 occupation pairs for carbachol and path (2) representing carbachol M2-M3 occupation in presence of 30 nM atropine. The intersection of each path with the isobole gives the expected M2-M3 combination (shown with S.E. bar). The experimentally derived values are shown as □ and ○ and are not statistically significantly different from their respective intersection points, thereby indicating a simply additive interaction between the M2 and M3 receptors occupied by carbachol.
To assess the experimental values of (x, y) that gave this effect level, we administered carbachol to the wild-type preparation, thereby occupying both receptors. Its fitted concentration-effect relation was determined to be E = 79.39 [C]/{[C] + 1.11}; thus, the 40% effect required a concentration of 1.127 ± 0.17 μM. This concentration corresponds to occupation values of 0.291 for the M2 receptor and 0.0179 for the M3 receptor. It is seen to be below the isobole, but, due to large variances, its location does not differ significantly. Effectively, this means that the interaction between M2- and M3-occupied receptors is simply additive for this agonist and tissue preparation. In contrast to this experimental point, the expected (additive) point is also located by following the broken curve (1) of the isobologram, which shows the path of M2-M3 occupation as the agonist concentration changes. The intersection of this path with the isobole is the position on the isobole that is the additive point.
The Effect of Atropine
Dissociation constants (Ks) for carbachol (PDSP database) and for atropine (Caulfield, 1993; Caulfield and Birdsall, 1998) at both receptors used published values. As can been seen in Fig. 6, increasing concentrations of atropine caused increasing parallel dextral shifts in the carbachol concentration-response curves, with no diminution of the maximal contraction, results were consistent with a competitive inhibitor (for the competing antagonist atropine, KB for M2, 1.26 nM; and KB for M3, 0.316 nM). When the reversible competitive antagonist atropine is present in a fixed concentration, mass action binding allows a calculation of the agonist bound at each receptor as a function of its concentration [C] as given by the Gaddum equation under Materials and Methods. The occupation path is therefore different from the situation that has only the agonist. That path is shown as the broken curve (2) that is to the right of path (1). Restoration of the selected effect (40%) is expected to be at the intersection of curve (2) and the isobole if the interaction is additive because all occupation pairs for 40%, by definition, are on this isobole. However, in our experiment in the wild-type preparation, restoration of the 40% effect was attained at the occupancy point shown as an open circle in Fig. 5. That figure shows the occupancy path for a fixed atropine concentration of 30 nM (dashed line 2) and the point (occupancy pair) on it that was determined in the experiment. The coordinates of that point are calculated from the needed carbachol concentration for the restoration of effect, and that concentration was 70 μM as shown in Fig. 6. Use of [C] = 70 in the competitive equation gives (70)/(70 + 2.75) (1 + (30)/(1.26)) = 0.506 at M2 because the atropine K is 1.26 at this receptor and (70)/(70 + 62) (1 + (30)/(0.316)) = 0.0116 at M3 because atropine’s K is 0.316 at this receptor. These values are shown as open circles in Fig. 5, whose coordinates are 0.506 and 0.012, a point somewhat below the isobole intersection, i.e., not at the intersection point. Again, the variance of this estimate suggests that the experimental point is not significantly different from the point on the isobole. We further examined two other fixed quantities of atropine (results not shown on the graph). These results are displayed in Table 1, again showing a simple additive interaction between these occupied receptors. Variance estimates, whose detailed calculations are not shown, follow from a standard statistical procedure known as the “delta method” (e.g., see Cassela and Burger, 2002).
Fig. 6.
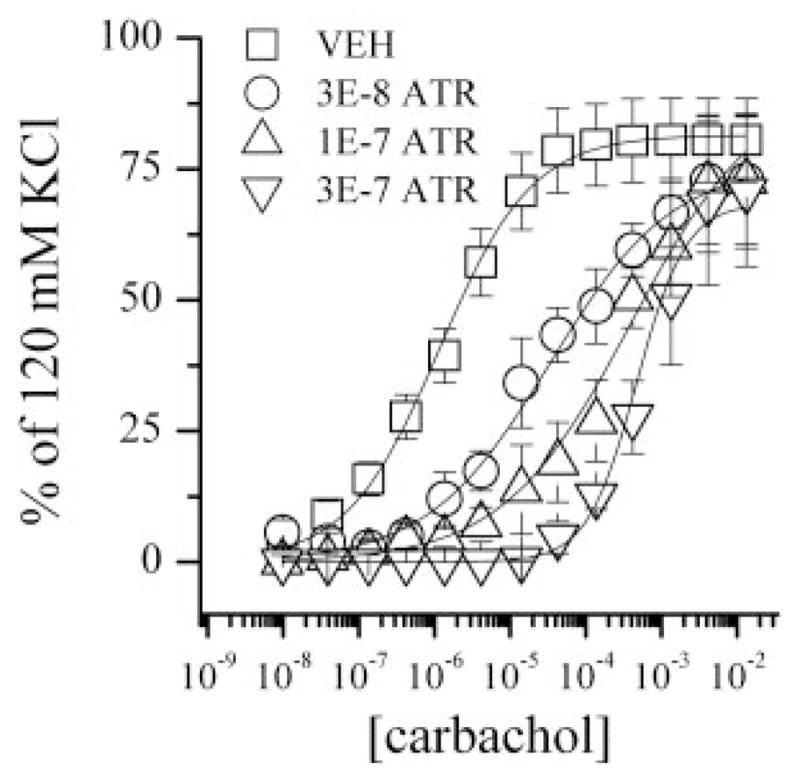
Cumulative carbachol concentration effect curves normalized to each individual muscle strip’s contractile response to 120 mM KCl. VEH, n = 38; 3E-8 M ATR, n = 7; 1E-7 M ATR, n = 5; 3E-7 M ATR, n = 5.
TABLE 1.
Fractional M3 occupation (and S.E.M.) by carbachol experimentally determined and expected for a simply additive interaction between M2 and M3 muscarinic receptors in mouse stomach contracted to an effect = 40% of KCl maximum
| Atropine | [M3] Additive | [M3] Experimental |
|---|---|---|
| 0 nM | 0.0204 (0.006) | 0.0179 (0.0023) |
| 30 nM | 0.0169 (0.0071) | 0.0116 (0.0015) |
| 100 nM | 0.0168 (0.0072) | 0.0125 (0.0016) |
| 300 nM | 0.0168 (0.0073) | 0.0134 (0.0018) |
In the classic one-receptor theory (and its use in Schild analysis), determining equal effects in the presence and absence of a competitive antagonist means equal receptor occupation by the agonist in both cases. However, in the two-receptor case considered here, equal effects means something a bit different, namely that the receptor occupation pairs lie on the same isobole for the selected effect level.
The occupancy isoboles shown in Fig. 5 were based on values of carbachol affinity determined in the absence of GTP in which the affinity for carbachol is much higher for M2 receptors than M3 receptors. The analysis with occupational isoboles used here is robust in the sense that possible uncertainties in the values of dissociation constants do not appreciably alter the results of the analysis. To illustrate this point, we show in Fig. 7 the results of calculating under the assumption that both M2 and M3 receptors have the same affinity for carbachol (62 μM), a phenomenon that occurs in the presence of 100 μM GTP (Wang et al., 1995), a concentration that approximates intracellular GTP concentrations (Hatakeyama et al., 1992). Additivity is still the outcome due to the fact that both the isobole and the occupation path are moved by this change in K values and, thus, the distance between the additive intersection and the experimental point remains small (a nonsignificant difference) as in the main analysis where different K values (2.75 and 62 μM) from the database were used.
Fig. 7.
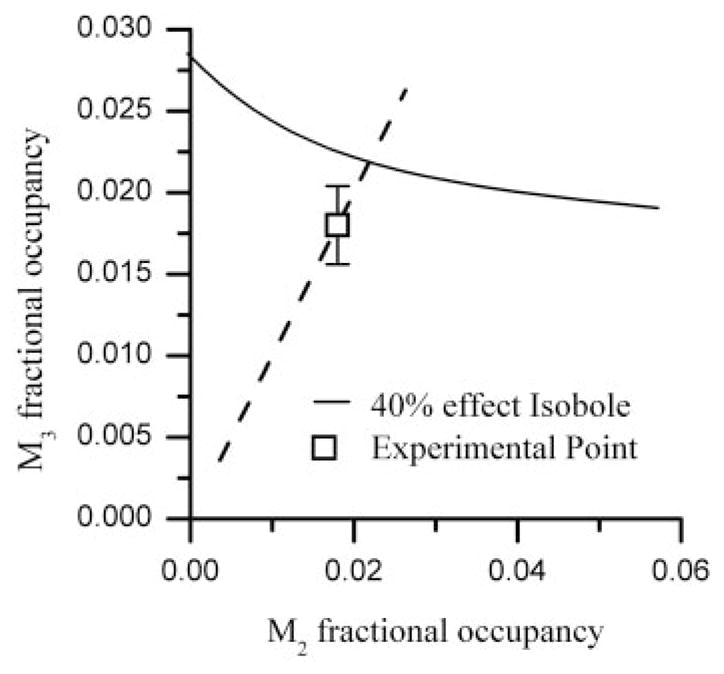
The isobole of additivity (solid curve) for effect = 40% KCl maximum is shown along with a straight line (dashed) representing M2-M3 occupation pairs for carbachol when equal carbachol affinities for M2 and M3 are used. The experimentally derived value is shown as □ and does not differ significantly from the intersection, thereby indicating a simply additive interaction.
Discussion
In agreement with previous studies (Matsui et al., 2000; Stengel et al., 2000; Bymaster et al., 2001), the experiments described here clearly demonstrate that the main component of contraction mediated by carbachol in the mouse stomach is due to occupation of M3 receptors by the agonist carbachol. To our knowledge, the present study is the first to address quantitative analysis of muscarinic receptor-induced contraction based on dual receptor occupancy. By transforming the agonist concentration-effect relationship in the knockouts to M2 and M3 fractional occupation, the concentration-effect data become occupation-effect data that can be described by the nonlinear equations that produce their smoothed curves.
The occupation effect curves (Fig. 4) show that the receptor occupancy ratio for equivalent effect is variable; thus, the isobole of additivity derived from them (Fig. 5) is a nonlinear curve containing points (occupation pairs) that give a constant effect level, in this case 40% of the KCl maximum. The isobole is a relationship between occupied receptors that follows from their individual potencies (as determined in the knockouts). The experimentally derived occupation values (points) in the wild-type preparation are not statistically significantly different from the points on the isobole, thereby confirming the theory and further showing that the interaction between these two muscarinic receptors is simply additive, a result not previously shown quantitatively. Thus, this study is the first to document that the interaction between the contractile signal transmitted by the M2 and the M3 receptor subtypes is additive in the mouse stomach body. This study also demonstrates the needed expansion of receptor theory for cases in which an effect is mediated by two different receptor subtypes. This is especially notable in the analysis of competitive inhibition experiments. In the classic one-receptor theory and its use in Schild analysis, determining equal effects in the presence and absence of a competitive antagonist means equal receptor occupation by the agonist in both cases, which is the cornerstone of Schild analysis. However, in the two-receptor case (exemplified here), equal effects mean something different, namely that the receptor occupation pairs lie on the same isobole for the selected effect level.
M2 and M3 receptor signal transduction mechanisms also interact in an additive manner in the normal rat bladder. However, this is not the case in the denervated rat bladder, where the interaction becomes synergistic. There is also a synergistic interaction in the normal rat bladder when intracellular calcium signaling is perturbed following inhibition of the sarcoplasmic reticulum calcium ATPase (Braverman et al., 2002).
Although the M2 receptors seem to have a minor role in mediating contraction of the wild-type mouse stomach body, M2 receptors are capable of mediating a moderate contraction in the absence of M3 receptors as seen in the M3-KO animals. However, their main function may be to serve as a redundant or back up contractile source if M3 receptors or some component of the M3 contractile signal transduction cascade become dysfunctional.
Occupation of 3% of M3 receptors results in a contraction equal to 40% of the KCl-induced maximum. This assessment is based on the concentration effect data and the binding affinity of carbachol for the M2 and M3 muscarinic receptor subtypes. The low receptor occupancy at half-maximal effect suggests a relatively large M3 receptor reserve for contraction in the mouse stomach body. The maximal contraction elicited by the M2 receptor is less than half (44%) the maximal contraction elicited by the M3 receptor. The density of M2 receptors is greater than M3 receptors in most smooth muscles, including the stomach (Eglen, 2001). Thus, one third the number of M3 receptors mediates an effect of a magnitude that is approximately twice as great as M2 receptors. Because each M3 receptor mediates a greater contractile effect than each M2 receptor, the M3 subtype is more efficient in mediating contraction than the M2 receptor subtype.
Although the isobolar analysis demonstrates the additive nature of the interaction, it provides no mechanistic interpretation. Toward this end, previous studies from this laboratory using knockout mice, published in preliminary form (Braverman et al., 2006), have shown that M2 and M3 receptor-mediated stomach contractions are dependent on different intracellular signaling mechanisms. M2-mediated contractions are inhibited by the selective rho kinase inhibitor Y-27632, whereas M3-mediated contractions are not. In addition, the selective protein kinase C inhibitor, chelerythrine, only attenuates M3-mediated contractions. Thus, the difference in coupling efficiency is probably explained by the different intracellular signaling cascades mediated by the M2 and the M3 subtypes in this preparation.
The isobole is especially useful in the analysis of data with a competitive antagonist. With a single receptor type, equal effects in the absence and presence of a competitive inhibitor imply equal receptor occupation by the agonist. In contrast, in the dual receptor situation, applicable here and probably applicable in most instances, equal effects indicate that the fractional occupation pairs lie on the same isobole. Thus, experiments were performed using the nonselective, competitive muscarinic receptor antagonist atropine. The use of atropine confirms the additive interaction by M2 and M3 receptors in that the experimental value is not different from that of the additive isobole curve. This not only further confirms that the interaction is additive but also provides additional support for the validity of this new method of analysis. The lack of availability of completely selective muscarinic receptor subtype agents required the use of KO mice for these studies. However, this analysis method is also useful when pharmacological occlusion of one subtype of receptors is possible with agonists or antagonists that are extremely selective.
Acknowledgments
We acknowledge the expert technical assistance of Michael R. Ruggieri, Jr. in carrying out the contractility studies.
ABBREVIATIONS
- KO
knockout
- PDSP
Psychoactive Drug Screening Program
- Y-27632
(R)-(+)-trans-4-(1-aminoethyl)-N-(4-pyridyl)cyclohex-anecarboxamide dihydrochloride
References
- Biancani P, Billett G, Hillemeier C, Nissensohn M, Rhim BY, Szewczak S, Behar J. Acute experimental esophagitis impairs signal transduction in cat lower esophageal sphincter circular muscle. Gastroenterology. 1992;103:1199–1206. doi: 10.1016/0016-5085(92)91504-w. [DOI] [PubMed] [Google Scholar]
- Braverman AS, Lebed B, Linder M, Ruggieri MR. M(2) mediated contractions of human bladder from organ donors is associated with an increase in urothelial muscarinic receptors. Neurourol Urodyn. 2007;26:63–70. doi: 10.1002/nau.20378. [DOI] [PMC free article] [PubMed] [Google Scholar]
- Braverman AS, Parkman HP, Wess J, Ruggieri MR. Cholinergic contractile responses and signal transduction mechanisms of gastric smooth muscle in M2 and M3 muscarinic receptor subtype knockout mice. Gastroenterology. 2006;130:A4–A5. [Google Scholar]
- Braverman AS, Ruggieri MR. Selective alkylation of rat urinary bladder muscarinic receptors with 4-DAMP mustard reveals a contractile function for the M2 muscarinic receptor. J Recept Signal Transduct Res. 1999;19:819–833. doi: 10.3109/10799899909042875. [DOI] [PMC free article] [PubMed] [Google Scholar]
- Braverman AS, Ruggieri MR., Sr Hypertrophy changes the muscarinic receptor subtype mediating bladder contraction from M3 toward M2. Am J Physiol Regul Integr Comp Physiol. 2003;285:R701–R708. doi: 10.1152/ajpregu.00009.2003. [DOI] [PMC free article] [PubMed] [Google Scholar]
- Braverman AS, Tallarida RJ, Ruggieri MR., Sr Interaction between muscarinic receptor subtype signal transduction pathways mediating bladder contraction. Am J Physiol Regul Integr Comp Physiol. 2002;283:R663–R668. doi: 10.1152/ajpregu.00116.2002. [DOI] [PMC free article] [PubMed] [Google Scholar]
- Bymaster FP, Carter PA, Zhang L, Falcone JF, Stengel PW, Cohen ML, Shannon HE, Gomeza J, Wess J, Felder CC. Investigations into the physiological role of muscarinic M2 and M4 muscarinic and M4 receptor subtypes using receptor knockout mice. Life Sci. 2001;68:2473–2479. doi: 10.1016/s0024-3205(01)01041-4. [DOI] [PubMed] [Google Scholar]
- Cassela G, Burger RL. Statistical Inference. Duxbury; Pacific Grove, CA: 2002. p. 243. [Google Scholar]
- Caulfield MP. Muscarinic receptors: characterization, coupling and function. Pharmacol Ther. 1993;58:319–379. doi: 10.1016/0163-7258(93)90027-b. [DOI] [PubMed] [Google Scholar]
- Caulfield MP, Birdsall NJ. International Union of Pharmacology: XVII. Classification of muscarinic acetylcholine receptors. Pharmacol Rev. 1998;50:279–290. [PubMed] [Google Scholar]
- Choppin A. Muscarinic receptors in isolated urinary bladder smooth muscle from different mouse strains. Br J Pharmacol. 2002;137:522–528. doi: 10.1038/sj.bjp.0704897. [DOI] [PMC free article] [PubMed] [Google Scholar]
- Choppin A, Eglen RM. Pharmacological characterization of muscarinic receptors in mouse isolated urinary bladder smooth muscle. Br J Pharmacol. 2001;133:1035–1040. doi: 10.1038/sj.bjp.0704165. [DOI] [PMC free article] [PubMed] [Google Scholar]
- Eglen RM. Muscarinic receptors and gastrointestinal tract smooth muscle function. Life Sci. 2001;68:2573–2578. doi: 10.1016/s0024-3205(01)01054-2. [DOI] [PubMed] [Google Scholar]
- Ehlert FJ, Ahn S, Pak KJ, Park GJ, Sangnil MS, Tran JA, Matsui M. Neuronally released acetylcholine acts on the M2 muscarinic receptor to oppose the relaxant effect of isoproterenol on cholinergic contractions in mouse urinary bladder. J Pharmacol Exp Ther. 2007;322:631–637. doi: 10.1124/jpet.107.121756. [DOI] [PubMed] [Google Scholar]
- Ehlert FJ, Thomas EA. Functional role of M2 muscarinic receptors in the guinea pig ileum. Life Sci. 1995;56:965–971. doi: 10.1016/0024-3205(94)00035-q. [DOI] [PubMed] [Google Scholar]
- Gaddum J. The quantitative effects of antagonistic drugs. J Physiol (London) 1937;89:7P–9P. [Google Scholar]
- Gerthoffer WT. Signal-transduction pathways that regulate visceral smooth muscle function: III. Coupling of muscarinic receptors to signaling kinases and effector proteins in gastrointestinal smooth muscles. Am J Physiol Gastrointest Liver Physiol. 2005;288:G849–G853. doi: 10.1152/ajpgi.00530.2004. [DOI] [PubMed] [Google Scholar]
- Gevaert T, Ost D, De Ridder D. Comparison study of autonomous activity in bladders from normal and paraplegic rats. Neurourol Urodyn. 2006;25:368–378. doi: 10.1002/nau.20206. [DOI] [PubMed] [Google Scholar]
- Gomeza J, Shannon H, Kostenis E, Felder C, Zhang L, Brodkin J, Grinberg A, Sheng H, Wess J. Pronounced pharmacologic deficits in M2 muscarinic acetylcholine receptor knockout mice. Proc Natl Acad Sci U S A. 1999;96:1692–1697. doi: 10.1073/pnas.96.4.1692. [DOI] [PMC free article] [PubMed] [Google Scholar]
- Grabovsky Y, Tallarida RJ. Isobolographic analysis for combinations of a full and partial agonist: curved isoboles. J Pharmacol Exp Ther. 2004;310:981–986. doi: 10.1124/jpet.104.067264. [DOI] [PubMed] [Google Scholar]
- Hatakeyama K, Harada T, Kagamiyama H. IMP dehydrogenase inhibitors reduce intracellular tetrahydrobiopterin levels through reduction of intracellular GTP levels: indications of the regulation of GTP cyclohydrolase I activity by restriction of GTP availability in the cells. J Biol Chem. 1992;267:20734–20739. [PubMed] [Google Scholar]
- Loewe S. The problem of synergism and antagonism of combined drugs. Arzneimittelforschung. 1953;3:285–290. [PubMed] [Google Scholar]
- Matsui M, Motomura D, Karasawa H, Fujikawa T, Jiang J, Komiya Y, Takahashi S, Taketo MM. Multiple functional defects in peripheral autonomic organs in mice lacking muscarinic acetylcholine receptor gene for the M3 subtype. Proc Natl Acad Sci U S A. 2000;97:9579–9584. doi: 10.1073/pnas.97.17.9579. [DOI] [PMC free article] [PubMed] [Google Scholar]
- Oehlert GW. A note on the delta method. Am Stat. 1992;46:27–29. [Google Scholar]
- Ostrom RS, Ehlert FJ. Comparison of functional antagonism between isoproterenol and M2 muscarinic receptors in guinea pig ileum and trachea. J Pharmacol Exp Ther. 1999;288:969–976. [PubMed] [Google Scholar]
- Pontari MA, Braverman AS, Ruggieri MR., Sr The M2 muscarinic receptor mediates in vitro bladder contractions from patients with neurogenic bladder dysfunction. Am J Physiol Regul Integr Comp Physiol. 2004;286:R874–R880. doi: 10.1152/ajpregu.00391.2003. [DOI] [PMC free article] [PubMed] [Google Scholar]
- Stengel PW, Gomeza J, Wess J, Cohen ML. M(2) and M(4) receptor knockout mice: muscarinic receptor function in cardiac and smooth muscle in vitro. J Pharmacol Exp Ther. 2000;292:877–885. [PubMed] [Google Scholar]
- Struckmann N, Schwering S, Wiegand S, Gschnell A, Yamada M, Kummer W, Wess J, Haberberger RV. Role of muscarinic receptor subtypes in the constriction of peripheral airways: studies on receptor-deficient mice. Mol Pharmacol. 2003;64:1444–1451. doi: 10.1124/mol.64.6.1444. [DOI] [PubMed] [Google Scholar]
- Tallarida RJ. Drug Synergism and Dose-Effect Data Analysis. Chapman Hall/CRC; Boca Raton, FL: 2000. [Google Scholar]
- Tallarida RJ. An overview of drug combination analysis with isobolograms. J Pharmacol Exp Ther. 2006;319:1–7. doi: 10.1124/jpet.106.104117. [DOI] [PubMed] [Google Scholar]
- Tallarida RJ. Interactions between drugs and occupied receptors. Pharmacol Ther. 2007;113:197–209. doi: 10.1016/j.pharmthera.2006.08.002. [DOI] [PMC free article] [PubMed] [Google Scholar]
- Wang P, Luthin GR, Ruggieri MR. Muscarinic acetylcholine receptor subtypes mediating urinary bladder contractility and coupling to GTP binding proteins. J Pharmacol Exp Ther. 1995;273:959–966. [PMC free article] [PubMed] [Google Scholar]
- Yamada M, Miyakawa T, Duttaroy A, Yamanaka A, Moriguchi T, Makita R, Ogawa M, Chou CJ, Xia B, Crawley JN, et al. Mice lacking the M3 muscarinic acetylcholine receptor are hypophagic and lean. Nature. 2001;410:207–212. doi: 10.1038/35065604. [DOI] [PubMed] [Google Scholar]
- Yamanishi T, Chapple CR, Yasuda K, Chess-Williams R. The role of M2 muscarinic receptor subtypes in mediating contraction of the pig bladder base after cyclic adenosine monophosphate elevation and/or selective M3 inactivation. J Urol. 2002;167:397–401. [PubMed] [Google Scholar]


