

Abstract
Purpose
To assess the clinical significance of the interaction between estrogen and Runx2 signaling, previously demonstrated in vitro.
Experimental design
MCF7/Rx2dox BCa cells were treated with estradiol and/or doxycycline to induce Runx2, and global gene expression was profiled to define genes regulated by estradiol, Runx2, or both. Anchorage-independent growth was assessed by soft agar colony formation assays. Expression of gene-sets defined using the MCF7/Rx2dox system was analyzed in pre- and on-treatment biopsies from hormone receptor-positive patients undergoing neo-adjuvant letrozole treatment in two independent studies, and short-term changes in gene expression were correlated with tumor size reduction or Ki67 index at surgery.
Results
Reflecting its oncogenic property, estradiol strongly promoted soft agar colony formation, whereas Runx2 blocked this process suggesting tumor suppressor property. Transcriptome analysis of MCF7/Rx2dox cells treated with estradiol and/or doxycycline demonstrated reciprocal attenuation of Runx2 and estrogen signaling. Correspondingly in BCa tumors, expression of estradiol- and Runx2-regulated genes was inversely correlated; and, letrozole increased expression of Runx2-stimulated genes as defined in the MCF7/Rx2dox model. Of particular interest was a gene-set upregulated by estradiol and downregulated by Runx2 in vitro; its short-term response to letrozole treatment associated with tumor size reduction and Ki67 index at surgery better than other estradiol-regulated gene-sets.
Conclusion
This work provides clinical evidence for the importance of antagonism between Runx2 and E2 signaling in BCa. Likely sensing the tension between them, letrozole responsiveness of a genomic node, positively regulated by estradiol and negatively regulated by Runx2 in vitro, best correlated with the clinical efficacy of letrozole treatment.
Keywords: Letrozole, MCF7, Ki67, microarray, polo-like kinase
Introduction
The mitogenic effect of estrogens in breast epithelial cells is one of the best examples of hormonal carcinogenesis. Which of the many primary and secondary estrogen-responsive genes in breast epithelial cells drive hormonal carcinogenesis is difficult to discern. Although genes such as c-Myc, cyclin D and cyclin E have been implicated in estrogen-driven breast cancer (BCa) (1), there is limited understanding of why some are better correlated than others with disease progression and drug responsiveness. Recent high throughput gene expression studies have led to the identification of gene groups, whose baseline mRNA levels and hormone responsiveness correlated well with clinical and histological features of disease progression (2–6). Interestingly, first-generation prognostic gene signatures were enriched for proliferation- and cell cycle-related genes, and were particularly valid for estrogen receptor alpha (ERα)-positive tumors (7, 8). Better understanding of the biological significance of such gene signatures will potentially lead to novel pharmacological approaches targeting key molecular nodes that regulate BCa progression.
The Runx family of mammalian transcription factors plays fundamental roles in the differentiation of osteoblasts and chondrocytes (Runx2) (9), hematopoietic cells (Runx1) (10, 11) and neurons (Runx3) (12). Runx proteins are also increasingly implicated in cancer progression, both positively and negatively (13, 14). Contrasting their pro-metastatic role, which was mostly studied in advanced breast and prostate cancer (14–20), Runx proteins are well known for their tumor suppressor properties. Runx3 is a bona fide tumor suppressor gene, whose methylation contributes to gastric cancer (21–23); ablation of Runx1 activity leads to leukemia (24, 25); and Runx2 inhibits cell cycle progression in osteoblasts and prostate cancer cells (20, 26–28).
Runx2 physically interacts with the DNA-binding domains of both ERα and the androgen receptor. These interactions usually result in reciprocal inhibition of the respective transcriptional activation activities (29–31) although different outcomes have been reported (32–35). The physical interaction between ERα and Runx2 (29), and our more recent observation that E2 independently regulates half of the Runx2-responsive genes in BCa cells (see herein), led to the speculation that the oncogenic potential of estradiol in breast epithelial cells might be related in part to antagonizing Runx2. In the present study, we first define gene sets co-regulated by estrogen and Runx2 signaling in BCa cells in vitro. Then, by correlating expression pattern of these genes in BCa tumor biopsies with clinical response to aromatase inhibition therapy, we show that genes up-regulated by E2 and down-regulated by Runx2 are more informative than those defined in vitro based on their response to E2 alone.
Materials and methods
Establishment and maintenance of Runx2 expressing MCF7 BCa cells
MCF7 BCa cells were obtained from the American Type Culture Collection. To establish MCF7 cell subline that conditionally express Runx2, we employed the recently described lentivirus-based pSLIK vector system, which allows tight doxycycline (dox)-inducible, RNA PolII-mediated transcription of a gene of interest (36). Lentiviral particles encoding dox-inducible Flag-Runx2 (MASN isoform, type-2) and the Hygromycin B selection marker were constructed and packaged as previously described (20). Transduced MCF7/Rx2dox cells were selected in DMEM containing 10% FBS and 100 μg/ml Hygromycin B (GIBCO, Carlsbad, CA).
Western blot analysis
Proteins were separated on 10% SDS-PAGE and Western blotting was performed using as primary antibodies mouse monoclonal anti-FLAG M2 (Sigma, St. Louis, MO), mouse monoclonal anti-Runx2 (Invitrogen, Carlsbad, CA) and goat anti-GAPDH (V-18) (Santa Cruz Biotechn., Inc, Santa Cruz, CA). After incubation with either horseradish peroxidase-conjugated goat anti-mouse secondary antibodies (sc2031) or donkey anti-goat antibodies (sc2020) from Santa Cruz Biotech., Inc., proteins were visualized with enhanced Chemiluminescence Plus western blotting detection kit (GE Healthcare UK limited, UK).
Immunofluorescence
Runx2 and ERα were visualized with the respective primary antibodies and secondary antibodies conjugated to either rhodamine or fluorescein, respectively. Cells were viewed using an LSM 510 Zeiss confocal microscope at 60× magnification.
Soft agar colony formation assay
MCF7/Rx2dox cells were suspended in 0.4% agarose prepared in DMEM containing 10% charcoal-stripped serum (CSS) and plated over 0.5% base agar at a density of 5000 cells/well in 6 well plates. Cells were incubated at 37C° with media change every two days and stained with 0.005% Crystal violet after 21 days of incubation. Colonies were counted using a dissecting microscope.
High-throughput gene expression analyses
Two days before treatment MCF7/Rx2dox cells were switched to phenol red-free DMEM containing 5% CSS. Cells were treated with 0.5 μg/ml dox to induce Runx2 expression and/or with 10 nM E2. After 48h of treatment, RNA was extracted using Aurum Total RNA Mini Kit (BioRad, Hercules, CA) and submitted to the Southern California Genotyping Consortium (SCGC) for microarray analysis using HumanRef-8 v3.0 Expression BeadChips (Illumina Inc, CA). Raw data processing was performed using GenomeStudio (Illumina Inc) and extended analyses were performed using Partek Genomics Suite™ 6.6 (Partek, Inc, MO), or the R 2.11.1 package (http://cran.r-project.org), as indicated. Comparisons between gene expression under the various treatment conditions were performed by one-way ANOVA and differentially expressed genes were defined based on two criteria: an FDR-adjusted p value <0.05 and a fold change ≥1.3-fold. Hierarchical clustering was statistically assessed based on average silhouettes distance, average Pearson gamma, entropy, and within-between cluster ratio (see Supplemental Table 1). The web-based Database for Annotation, Visualization, and Integrated Discovery (DAVID) system (37) was used for functional annotation clustering of gene sets. The complete microarray dataset has been deposited in the Gene expression Omnibus (GEO) database with the accession number GSE30597.
Real-time quantitative PCR analysis
Quantitative Real Time PCR was carried out on an OPTICON2 (MJ Research) in triplicates using Maxima SYBR Green/Fluorescein Master Mix (Fermentas, Inc., Glen Burnie, MD). All transcript levels were normalized to that of GAPDH. Primer sequences used for PCR are listed in Supplementary Table 2.
Data mining
Three independent Affymetrix HG-U133A microarray datasets profiling gene expression in untreated ER-positive and ER-negative breast cancer patients were downloaded from the NCBI GEO data repository. The first dataset (GSE2034) known as the Rotterdam cohort represented 180 lymph-node negative relapse-free patients and 106 lymph node-negative patients that developed a distant metastasis (3). The second dataset TRANSBIG (GSE7390) consisted of 186 lymph node-negative primary breast cancer patient samples (38) and the third Mainz cohort (GSE11121) involved 200 node-negative breast cancer patients treated at the Department of Obstetrics and Gynecology of the University of Mainz between 1988 and 1998 (39).
Gene expression analysis of preoperative letrozole (POL) study
The open-label, multicenter phase II POL trial has been previously described (40). Eligible hormone receptor-positive patients were administered 2.5 mg oral letrozole daily for 16 to 24 weeks before surgery, with biopsies taken at baseline and after 4 weeks of treatment, with change in proliferation marker Ki67 being as one of the primary outcomes of response. Using RNA extracted from the biopsies, gene expression profiles were generated on Agilent 4×44K whole human genome platform on 80 patients at baseline while 58 had paired four-week on-treatment gene expression profiling. Probe-level gene expression data were collapsed to the gene level by median representative and standardized by median-centering and robust scaling by inter-quartile range. All statistical analysis was carried out in R 2.11.1 (http://cran.r-project.org) and all tests were two-sided at the 5% significance level unless otherwise noted. The detailed description of the POL data analyses and independent letrozole study GSE5462 downloaded from GEO (41) is provided in Supplementary materials.
Results
Establishment of MCF7/Rx2dox cells for the investigation of interactions between E2 and Runx2 signaling
Luminal-like MCF-7 BCa cells were transduced with lentiviruses containing the doxycycline (dox)-regulated Flag-tagged Runx2 cassette described previously (20). Neither western blotting nor immunofluorescence imaging detected endogenous Runx2 protein in untreated MCF7/Rx2dox cells (Figure 1A, B). Runx2 was expressed in response to dox (Figure 1A, B) at levels that were comparable to the endogenous Runx2 in T47D BCa cells and much lower than those seen in osteoblasts (Figure 1A). ERα was readily detected in both control and E2-treated cells, and reorganized in subnuclear domains together with Runx2 when the latter was expressed (Figure 1B). The co-localization of ERα and Runx2 in MCF7/Rx2dox cells is similar to that previously reported in COS7 cells and is attributable to physical interaction between the two proteins (29).
Figure 1.
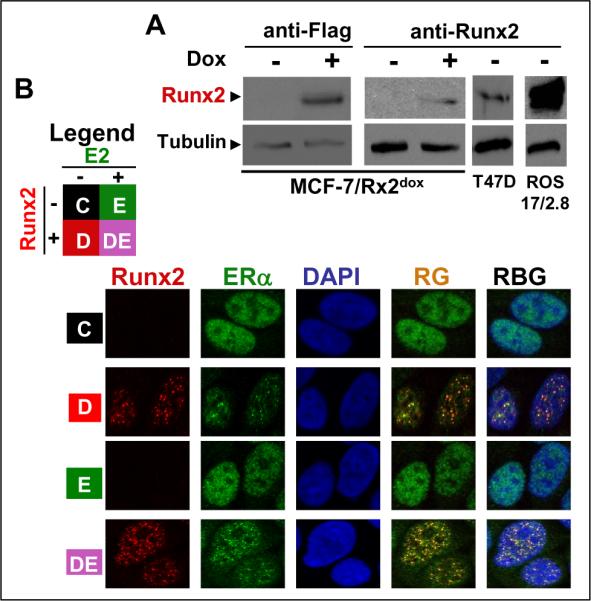
Conditional expression of Runx2 and colocalization with ERα in MCF7 BCa cells. A, Western blot analysis of Runx2 in MCF7/Rx2dox cells treated for 48h with 0.5 μg/ml Dox or vehicle. Runx2-positive T47D BCa cells and ROS17/2.8 osteosarcoma cells were used as control. Tubulin was analyzed to confirm equal loading. B, Confocal immunofluorescence analysis of Runx2 and ERα in MCF7/Rx2dox cells treated for 24h with vehicle (C; control), 0.5 μg/ml Dox (D) to induce Runx2, 10 nM E2 (E), or both together (DE) as indicated in the legend.
We next employed the MCF7/Rx2dox cell culture model to investigate the individual and combined effects of E2 and Runx2 on anchorage independent growth in vitro. Cells were suspended in soft agar and colonies were enumerated after 21 days of incubation in the presence of dox (to induce Runx2), E2, or both. As shown in Figure 2, E2 increased by 3.3-fold and Runx2 decreased by 4-fold the number of colonies formed; when present together, Runx2 completely antagonized the ability of E2 to enhance growth of MCF7/Rx2dox cells in soft agar.
Figure 2.
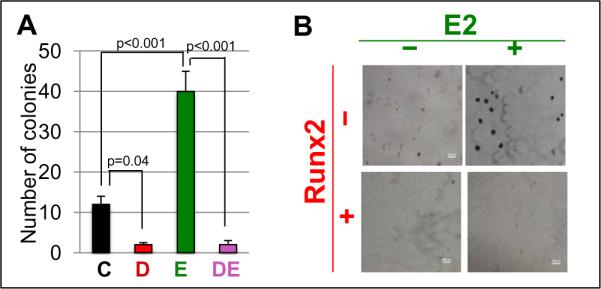
Runx2 diminished E2-stimulated anchorage independent growth of MCF7/Rx2dox cells in soft agar. A, MCF7/Rx2dox cells were incubated for three weeks in soft agar containing vehicle control (C), dox (D), E2 (E), or both (DE), and the colonies formed were enumerated (Mean±SEM; n=3). B, Representative phase contrast images form one of the three experiments (4X magnification).
Genome-wide reciprocal modulation of Runx2 and E2 signaling in MCF7/Rx2dox BCa cells
To investigate the interaction between E2- and Runx2-regulated gene expression in BCa, we performed genome-wide mRNA analysis of MCF7/Rx2dox cells after treatment with vehicle (control; C), dox (D), estradiol (E), or both together (DE) (see Materials and Methods and Figure 1B). Thus, the Runx2-response in the absence of E2 is defined for each gene as the ratio between the D and the C values, and Runx2-response in the presence of E2 is defined as the ratio between the DE and the E values. Similarly, E2-response in the absence and presence of Runx2 is defined as the E vs C and the DE vs D ratios. The complete list of differentially regulated genes in each array comparison is provided in Supplemental Table 3.
A global view of the influence of E2 on Runx2-driven changes in gene expression revealed diverse outcomes. Most of the Runx2-stimulated genes were enhanced to a lesser extent or even inhibited by Runx2 in the presence of E2 (Figure 3A and Supplemental Table 4). This is graphically demonstrated in Figure 3A by the larger number of data points below versus above the diagonal in the right half of the scatter-plot. The fraction of genes where E2 attenuated Runx2-mediated stimulation progressively increased from 0.7 for genes stimulated by <1.5-fold to 0.9 for genes stimulated by ≥3-fold (Figure 3A, bar graph and Supplemental Table 4). That E2 attenuated the Runx2-mediated stimulation of gene expression is equally demonstrable when counting only the statistically significant changes (Supplemental Table 4). Similarly, E2 attenuated the inhibitory effects of Runx2 on genes expression (Figure 3A, left half, and Supplemental Table 4). Exceptions to the attenuation phenomenon, however, were numerous, and are represented in Figure 3A by data points above the diagonal for dox-stimulated genes and below the diagonal for dox-repressed genes. Similar analysis in the reciprocal orientation revealed that Runx2 modulated E2-mediated regulation of gene expression in a locus-specific manner, with attenuation again being the predominant mode of interaction (Figure 3B). These results are consistent with our original observation of E2-mediated inhibition of Runx2 activity (29), but suggest two amendments. First, while attenuation of Runx2 activity by E2 was observed for the vast majority of genes strongly responding to Runx2, more exceptions were observed for genes that Runx2 stimulated or inhibited only mildly (Figure 3A, bar graphs). Second, in the reciprocal orientation, Runx2 generally attenuated the responses to E2, in particular for E2-inhibited genes (Figure 3B). In both orientations, the outcomes of the interactions were gene-dependent.
Figure 3.

Genome-wide reciprocal modulation of Runx2 and E2 signaling in MCF7/Rx2dox BCa cells. MCF7/Rx2dox cells were maintained for two days in medium supplemented with CSS prior to treatment with either vehicle control (C) dox (D), E2 (E), or both stimulants (DE). After 48h of treatment, RNA was isolated and subjected to microarray analysis using Illumina HumanRef-8 v3.0 expression Beadchips. A, Scatter plot describing the log2 response of each gene to Runx2 in the presence of E2 (Log2DE/E) versus absence of E2 (Log2D/C). Data points representing multiple genes are proportionally darker. The bars illustrate the fraction of genes whose response to Runx2 was attenuated in the presence versus absence of E2 for each of the indicated levels of stimulation or repression. B, Log2 fold changes by E2 in the presence (y-axis,) versus absence of Runx2 (x-axis) are plotted for each gene. The bars illustrate the fraction of genes whose response to E2 was attenuated in the presence versus absence of Runx2 for each of the indicated levels of stimulation or repression.
Gene expression data from BCa tumors suggest attenuation of Runx2 activity by estrogens
To investigate the relationship between Runx2 and E2 signaling in human BCa tumors, we assessed the correlation between the respective responsive genes, as defined in our MCF7/Rx2dox culture model, using publicly available gene expression data from BCa biopsies. Because of the significant overlap between Runx2- and E2-responsive genes in the MCF7/Rx2dox model, we disregarded the “common” genes (Figure 4A) to avoid bias and analyzed the correlation between genes that responded only to dox (D-only) or only to E2 (E-only) (Figure 4A). We defined a D-only↑ gene-set as 52 D-only genes that Runx2 stimulated by ≥2-fold and a similarly sized E-only↑ gene-set as 53 E-only genes that E2 stimulated by ≥2.5-fold in the MCF7/Rx2dox model (Figure 4A and Supplementary Table 5). For each BCa patient in the GSE11121 (39), GSE2034 (3) and GSE7390 public datasets (38), we determined the D-only↑ and E-only↑ metagenes as the average of standardized expressions of matching genes in the GEO datasets (Supplementary Table 5). As shown in Figure 4B, we observed a significant negative correlation between the D-only↑ and E-only↑ metagenes in each of these three independent cohorts. The negative correlation likely reflects the E2-mediated attenuation of the Runx2 response (Figure 3A) and/or the Runx2-mediated attenuation of the E2 response (Figure 3B) revealed using the MCF7/Rx2dox culture model.
Figure 4.
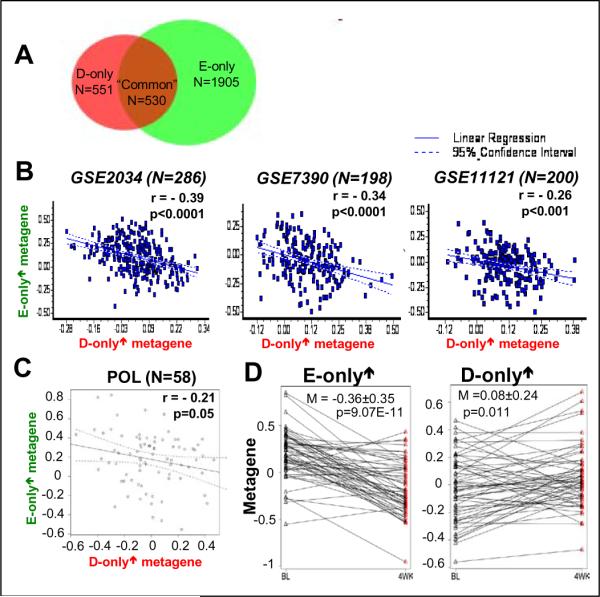
Negative interaction of E2- and Runx2 signaling in BCa tissues. A, Venn diagram of genes responsive to dox (Runx2) or estradiol by ≥1.3-fold (FDR p<0.05) in MCF7/Rx2dox cells. Genes responsive to dox but not E2, or vice versa, are indicated as “D-only” or “E-only”, respectively, and those responsive to each are indicated as “common”. B, Linear regression analysis of the correlation between the D-only↑ and the E-only↑ metagenes in BCa biopsies from the three indicated cohorts. The metagenes were defined as average of strandardized expression of all genes within the gene list. The D-only↑ metagene was represented by 34 (out of 52) genes which were upregulated by ≥2 fold in response to dox treatment in the MCF7/Rx2dox cell culture model and were also present in the HG-U133A Affymetrix array used in Gene Expression Omnibus datasets GSE11121 (39), GSE2034 (3) and GSE7390 (38). The E-only↑metagene was represented by 37 (out of 53) genes upregulated by ≥2.5 fold in response to E2 treatment of MCF7/Rx2dox cells and present in the above public datasets. C, Negative correlation between the E-only↑ and D-only↑ metagenes at baseline in patients from the WU-POL study. D, Changes in expression of the E-only↑ (left) and D-only↑ (right) metagenes in inidividual patients in the POL study between base line (BL) at the time of initial biopsy and four weeks after initiation of letrozole treatment (4WK). Two-sided paired sample t-test was used to examine the significance of the mean paired difference.
Because cross-sectional analyses can only test correlation, we directly tested how loss of estrogen signaling influences Runx2-regulated genes by comparing gene expression in BCa biopsies obtained from patients in the WU-POL clinical trial (40) at baseline versus four weeks into treatment with the aromatase inhibitor letrozole. We first confirmed that, similar to the negative correlation observed in the GEO datasets, there was a negative correlation between the D-only↑ and E-only↑ metagenes in the POL cohort at baseline (Figure 4C). We also confirmed the expected decrease in expression of the E-only↑ metagene in response to letrozole treatment (Figure 4D). Most importantly, four weeks of letrozole therapy increased expression of the D-only↑ metagene in most of the POL BCa patients (Figure 4D), with p=0.01 for the entire cohort (paired sample t-test). The increase in expression of the D-only↑ metagene after letrozole treatment is attributable to loss of the inhibitory effect of estrogens on Runx2-stimulated genes.
A gene network independently regulated by E2 and Runx2 signaling with a potential role in BCa cell cycle control
Given that E2 and Runx2 stimulated and inhibited, respectively, colony formation by MCF7/Rx2dox cells in soft agar even in the absence of the other stimulus (Figure 2), we turned our attention to genes that were independently regulated by each of these opposing poles. We subjected the “common” genes, those regulated by E2 and Runx2 even in the absence of the other stimulus (Figure 4A) to unsupervised clustering based on their expression levels in the absence and presence of dox (to induce Runx2) and/or E2. Of the four major branches (Figure 5A), genes in Clusters I and III were similarly regulated by Runx2 and E2, either down (Cluster I) or up (Cluster III). More interesting were Clusters II and IV, comprised of genes inversely regulated by the two signals; up by Runx2 (dox) and down by E2 (Cluster II) or vice versa (Cluster IV). Co-treatment with both dox and E2 generally resulted in additive effects (Figure 5A). The genes comprising each cluster, the matching genes in the POL and GEO datasets, as well as microarray-based standardized expression values for each of these genes in the MCF7/Rx2dox model, are listed in Supplemental Table 5. RT-qPCR analysis of selected genes in three independent experiments confirmed the expected expression pattern of genes in Cluster I (NPNT and MATN3), Cluster II (S100A6 and RHOB), Cluster III (CD44 and HEY2) and Cluster IV (PLK4, CCNB2, CCNB1 and CDC2) (Figure 5B). These and additional RT-qPCR assays of a total of 20 genes confirmed reproducibility of the microarray data (90% validation rate) and also suggested similar gene regulation in T47D/shRx2dox cells (42), in which endogenous Runx2 was silenced by dox treatment (Supplemental Table 7). Functional annotation analysis of Clusters I–IV revealed significant enrichment of each of them for particular biological functions, but the only strong significant association was that between Cluster IV and cell cycle-related genes, with a p value of 1.9×10⁻⁶ (Figure 5A). Thus, Cluster IV may be enriched in genes responsible for the opposing effects of E2 and Runx2 signaling on BCa cell growth (Figure 2).
Figure 5.

Various relationships between effects of E2 and Runx2 on “common” genes. A, Unsupervised hierarchical clustering of the “common” genes (Figure 4A) based on their normalized expression in MCF7/Rx2dox cells treated with vehicle control (C), Dox (D), E2 (E), or both stimulants (DE). Pathway enrichment of genes in each cluster was assessed by DAVID. B, RT-qPCR analysis of representative genes from each of the four clusters from panel A.
Response of Cluster IV genes to letrozole best correlates with BCa cell post-treatment proliferation index and change in tumor size in vivo
We speculated that genes in Cluster IV, which were stimulated by E2 and inhibited by Runx2 in the MCF7/Rx2dox model, represent a critical growth regulatory node, and that the sensitivity of these genes to letrozole would therefore correlate with clinical outcome better than genes selected based on their stimulation by E2 alone. We approached this conjuncture by comparing Cluster IV to other metagenes with regard to their letrozole response and the correlation with clinical outcome in the WU-POL study.
We initially redefined metagenes I–IV, consisting of the respective genes in Clusters I–IV from the Illumina Beadchip analysis of the MCF7/Rx2dox cells (Figure 5A), which were also represented in the Agilent microarrays employed in the WU-POL study (Supplementary Table 6). Figure 6A describes arrow-plots connecting expression levels at baseline and after four weeks of letrozole treatment for each metagene in each tumor. As expected, expression of the Clusters III and Cluster IV metagenes, representing E2-stimulated genes in vitro was decreased in response to letrozole in most patients, whereas expression of the Clusters I and Cluster II metagenes, representing E2-inhibited genes in vitro (Figure 5A) was generally stimulated in response to letrozole (Figure 6A). Remarkably, however, the letrozole response was much stronger for the Clusters II and IV metagenes (Figure 6A). The more significant response of Cluster II and IV genes (p values of 5×10⁻¹⁰ and 3×10⁻¹⁰, respectively) as compared to Cluster I and III metagenes (p values of 0.1 and 0.0002, respectively) is attributable to the unleashed activity of Runx2 upon loss of the counteracting activity of E2.
Figure 6.
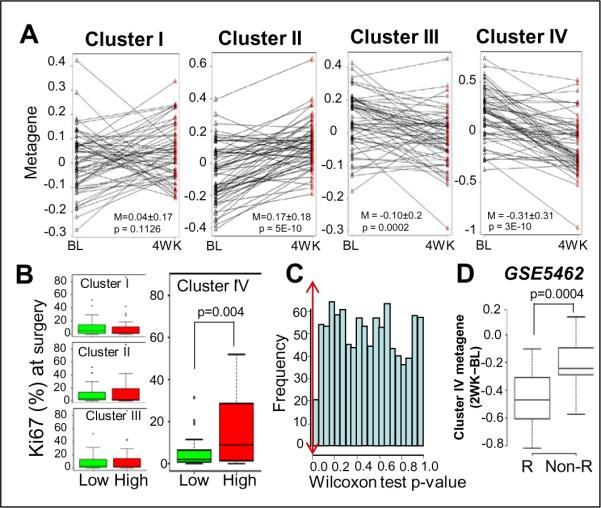
Letrozole responsiveness of the Cluster IV metagene predicts future Ki67 index. A. Changes in expression of the Custer I-IV metagenes in the WU-POL study between baseline (BL) at the time of initial biopsy, and 4 weeks (4WK) after initiation of letrozole treatment. Two-sided paired sample t-test was used to examine the significance of the mean paired difference. B. Distribution of Ki67 (%) at surgery in the lower and higher expressing group of patients defined based on the Cluster I-IV metagenes. Patients were dichotomized into low and high expressing groups based on their response to letrozole (4WK-BL) in each cluster and further examined if the two groups differed in their Ki67 status determined at surgery. Significance of the difference between the two groups was determined by Wilcoxon rank sum test. C, Distribution of Wilcoxon rank sum test p-values of correlation of high and low 4WK-BL difference of 1000 random metagenes (50 genes each) sampled from the list of the E2-stimulated genes in MCF7/Rx2dox cells (N=1061) with the Ki67 index at surgery. the double arrowed vertical line indicates the p value of 0.0043 returned for the Cluster IV metagene. D, Analysis of an independent letrozole study from the GEO dataset GSE5462 (41). Distribution of the letrozole-induced changes in Cluster IV metagene exprtession (2WK-BL) in patients that later showed a decrease in tumor volume (responders, R) versus non-responders (Non-R).
Because Cluster IV was highly enriched in cell cycle related genes (Figure 5A), we asked whether the letrozole response of the corresponding metagene in individual patients correlated with the percentage of Ki67-positive cells in tumor sections from blocks obtained during surgery 16 to 24 weeks after commencement of letrozole treatment. Post-treatment Ki67 proliferative index is a well-documented surrogate marker for clinical outcome (43, 44). First, patients were dichotomized into a “High” and a “Low” group (N=29 each) based on the median change in the expression of the Cluster IV metagene during the initial four weeks of letrozole treatment. The same patients were also dichotomized in a similar fashion based on the response of Clusters I, II and III. We then compared the “High” and “Low” groups per each metagene in terms of the Ki67 index measured at the time of surgery months later. Remarkably, the letrozole response of the Cluster IV metagene significantly correlated with the Ki67 index at surgery (Wilcoxon rank sum test, p=0.0043), while no significant correlation was found with the letrozole response of Clusters I-III (Figure 6B). Furthermore, the change in the expression of the Cluster IV metagene associated with the Ki67 index at surgery better than any of 1,000 random metagenes of similar size sampled from the E-only stimulated genes in MCF7/Rx2dox cells (Figure 4A; Figure 6C). Even the most upregulated E-only↑ metagene returned a less significant p-value of 0.01. Thus, among all E2-responsive metagenes tested, the letrozole response of Cluster IV during the initial four weeks of treatment best correlated with the Ki67 index in tumor biopsies taken after 16–24 weeks of treatment.
We further tested the correlation between the initial letrozole response in the expression of Cluster IV genes and tumor phenotype in an independent study (41, 45). Changes in tumor gene expression before versus after two weeks of letrozole were first determined from the corresponding GSE5462 trial dataset (41) in a similar fashion to that described above for the POL study. Because this study did not include Ki67 staining, the patients with high versus low Cluster IV response were compared in terms of the efficacy of letrozole in reducing tumor volume (45). As shown in Figure 6D, the change in the Cluster IV metagene expression over the initial two weeks of treatment significantly discriminated between clinically responsive and resistant patients assessed after three months of letrozole treatment (p=0.0004). The changes in the expression of Cluster I, Cluster II, Cluster III, the E-only↑, and the D-only↑ metagenes were either not or >7-fold less discriminative of tumor size reduction as compared to the Cluster IV metagene (Supplemental Table 8).
Discussion
The nuclear hormone receptor ERα and Runx family transcription factors play important roles in BCa, but little is known about their functional interaction. This work highlights Runx2 as an antagonist of the mitogenic property of E2 signaling in BCa tumors. Runx2 diminished E2-mediated colony formation by MCF7/Rx2dox cells in soft agar (Figure 2). Runx2 and ERα colocalized in distinct subnuclear domains of MCF7/Rx2dox cells (Figure 1) and genome-wide expression profiling of cells treated with dox (to induce Runx2) and/or E2 demonstrated that Runx2 generally attenuated effects of E2 on gene expression (Figure 3). Consistent with these in vitro observations, letrozole treatment of BCa patients not only decreased expression of genes upregulated by E2 in our in vitro system, but also mimicked the response of genes to Runx2 (Figure 4D). Finally, we identified a group of 84 genes (Cluster IV), many with known roles in cell cycle control, which were stimulated by E2 and inhibited by Runx2 in the MCF7/Rx2dox culture model and whose short-term inhibition by letrozole in BCa tumors strongly correlated with clinical parameters assessed months later – post-therapy Ki67 proliferative index in our clinical study and change in tumor volume in an independent clinical study (Figure 6). The opposing effects of Runx2 and E2 on expression of Cluster IV genes and the targeting of this genomic node could therefore provide the basis for novel therapeutic approaches against hormone receptor-positive BCa.
Cluster IV genes are extreme examples of antagonism between E2 and Runx2 signaling because they are independently upregulated by E2 and downregulated by Runx2 (Figure 5). Additional mechanisms of antagonism between estrogen and Runx2 signaling do not require independent regulation by the two pathways. For example, both the microarray data (Supplementary Table 3) and the immunofluorescence results (Figure 1) suggest that Runx2 inhibits ERα expression. Runx2 may also destabilize ERα similar to Runx3 (23). Yet another mechanism could be the physical interaction between ERα and Runx2, which may result not only in decreased association of Runx2 with its target genes (29), but also decreased association of ERα with its targets. In support of this idea, re-analysis of data from two recent studies (46, 47) indicated that genomic ERα target genes are more likely to be antagonized by Runx2 than non-genomic targets (Supplemental Table 9). While the relative contribution of each of these mechanisms is under investigation, the global reciprocal inhibitory effects between estrogen and Runx2 signaling observed in vitro (Figure 3) and the inverse correlation between E2- and Runx2-stimulated genes observed in BCa tumors (Figure 4B–C) provide a novel insight into BCa carcinogenesis. In particular, being independently stimulated by E2 and inhibited by Runx2 (Figure 5), and being enriched for cell cycle regulatory genes (Figure 5A), Cluster IV appears to represent a critical regulatory node where the mitogenic property of E2 meets the anti-mitogenic property of Runx2. It is tempting to speculate that the direct opposition between E2 and Runx2 signaling at this node (Supplemental Figure 1) renders Cluster IV a sensor for the status of interaction between E2 and Runx2 signaling. Tumors with the highest tension between the two poles will respond to loss of E2 signaling with the sharpest decline in the expression of Cluster IV genes. In turn, unopposed Runx activity after letrozole treatment of these tumors will most effectively suppress their growth (Figure 6). Unlike the response of Cluster IV to letrozole treatment, no significant correlation was observed between clinical outcome and the baseline expression levels of Cluster IV, Runx2, Runx2-resposive genes, or E2-responsive genes (data not shown).
Cluster IV is enriched in genes associated with the mitotic polo-like kinase pathway, such as PLK4, CDC2, CCNB2, KIF11, PRC1 and PTTG1 (Supplemental Table 6 and Supplemental Figure 1), which regulates multiple mitotic events, including centrosome maturation, bipolar spindle formation, DNA damage adaptation, mitotic entry, activation of anaphase promoting complex, and cytokinesis, processes that must be well balanced to ensure normal mitotic progression and cell division (48). Polo-like kinase 4 (PLK4) in particular plays a crucial role in centriole duplication, cytokinesis and maintenance of chromosomal stability, and deregulation of PLK4 has been implicated in carcinogenesis (48). Previous reports showed that estrogens stimulate and letrozole inhibits genes regulating mitotic spindle formation and cell proliferation (41, 49). Therefore, inhibition of these genes by Runx2 and possibly other members of the Runx family (14, 18, 23) may constitute an important mechanism of tumor suppression.
In summary, by manipulating both estrogen and Runx2 signaling in vitro, we demonstrated diverse interactions between the pathways. Most commonly, E2 attenuated responses to Runx2 and vice versa, although many exceptions to this general rule were observed, the significance of which remains to be investigated. Another type of interaction occurs when E2 and Runx2 each regulate the same genes in the absence of the other stimulus. Of particular interest is the E2-stimulated and Runx2-inhibited PLK pathway-enriched Cluster IV, whose 2–4-week response to initial letrozole treatment in two independent clinical studies correlated well with the Ki67 index or tumor volume reduction measured after 3–'6 months of treatment. This correlation contrasts with the weaker or lack of association between other E2-regulated gene signatures determined here in vitro (e.g, E-only↑, Cluster I-III) or by Miller et al. based on clinical short-term response to letrozole alone (45). Future studies are warranted to investigate other roles of Runx proteins in BCa hormonal carcinogenesis, including the roles of Runx1 and Runx3 (14, 18, 23), as well as the interactions of Runx proteins with signals elicited by selective estrogen receptor modulators. Finally, while harnessing the tumor suppressor functions of Runx proteins, future translational research will have to take into account that these proteins can also display oncogenic properties (14, 18–20) much like estrogens can also display tumor suppressor properties (8, 50).
Supplementary Material
Statement of Translational Relevance.
We identified in an unbiased manner a gene-set upregulated by estradiol and downregulated by Runx2 in an MCF7 breast cancer (BCa) culture model, whose short-term response to letrozole in tumor biopsies correlated with future tumor growth better than the responsiveness of hormone-regulated gene-sets defined regardless of Runx2; initial decrease in the expression of these genes in patients receiving letrozole therapy correlated most significantly with Ki67 index and tumor size reduction assessed months later. Many of the genes encoded components of the mitotic polo-like kinase pathway. Reciprocal antagonism between the mitogenic properties of estradiol and the anti-mitogenic properties of Runx2 should be further studied as a potential basis for the development of predictive strategies and identification of novel therapeutic targets for BCa.
Acknowledgements
We thank Dr. Alice E. Kohn-Gabet and Ms. Yunfan Shi for their expert technical assistance, Dr. Joseph DeYoung at the Southern California Genotyping Consortium (SCGC) for the microarray hybridization, and Dr. Yibu Chen and Ms. Meng Li at the USC Keck School of Medicine Bioinformatics Service Group for help with data analysis. This work was funded by NIH RO1 grants DK071122, CA095614 and CA109147. BF holds the J. Harold and Edna L. LaBriola Chair in Genetic Orthopedic Research at USC and MJE holds the Anheuser Busch Chair in Medical Oncology.
Financial support: NIH grants RO1 DK071122 and R01 CA109147 to BF and R01 CA095614 to MJE
References
- 1.Butt AJ, McNeil CM, Musgrove EA, Sutherland RL. Downstream targets of growth factor and oestrogen signalling and endocrine resistance: the potential roles of c-Myc, cyclin D1 and cyclin E. Endocr Relat Cancer. 2005;12(Suppl 1):S47–59. doi: 10.1677/erc.1.00993. [DOI] [PubMed] [Google Scholar]
- 2.van't Veer LJ, Dai H, van de Vijver MJ, He YD, Hart AA, Mao M, et al. Gene expression profiling predicts clinical outcome of breast cancer. Nature. 2002;415:530–6. doi: 10.1038/415530a. [DOI] [PubMed] [Google Scholar]
- 3.Wang Y, Klijn JG, Zhang Y, Sieuwerts AM, Look MP, Yang F, et al. Gene-expression profiles to predict distant metastasis of lymph-node-negative primary breast cancer. Lancet. 2005;365:671–9. doi: 10.1016/S0140-6736(05)17947-1. [DOI] [PubMed] [Google Scholar]
- 4.Sotiriou C, Wirapati P, Loi S, Harris A, Fox S, Smeds J, et al. Gene expression profiling in breast cancer: understanding the molecular basis of histologic grade to improve prognosis. J Natl Cancer Inst. 2006;98:262–72. doi: 10.1093/jnci/djj052. [DOI] [PubMed] [Google Scholar]
- 5.Parker JS, Mullins M, Cheang MC, Leung S, Voduc D, Vickery T, et al. Supervised risk predictor of breast cancer based on intrinsic subtypes. Journal of clinical oncology : official journal of the American Society of Clinical Oncology. 2009;27:1160–7. doi: 10.1200/JCO.2008.18.1370. [DOI] [PMC free article] [PubMed] [Google Scholar]
- 6.Nielsen TO, Parker JS, Leung S, Voduc D, Ebbert M, Vickery T, et al. A comparison of PAM50 intrinsic subtyping with immunohistochemistry and clinical prognostic factors in tamoxifen-treated estrogen receptor-positive breast cancer. Clinical cancer research : an official journal of the American Association for Cancer Research. 2010;16:5222–32. doi: 10.1158/1078-0432.CCR-10-1282. [DOI] [PMC free article] [PubMed] [Google Scholar]
- 7.Reis-Filho JS, Weigelt B, Fumagalli D, Sotiriou C. Molecular profiling: moving away from tumor philately. Sci Transl Med. 2:47ps3. doi: 10.1126/scitranslmed.3001329. [DOI] [PubMed] [Google Scholar]
- 8.Sotiriou C, Piccart MJ. Taking gene-expression profiling to the clinic: when will molecular signatures become relevant to patient care? Nature reviews Cancer. 2007;7:545–53. doi: 10.1038/nrc2173. [DOI] [PubMed] [Google Scholar]
- 9.Komori T. Regulation of bone development and extracellular matrix protein genes by RUNX2. Cell and tissue research. 2010;339:189–95. doi: 10.1007/s00441-009-0832-8. [DOI] [PubMed] [Google Scholar]
- 10.Lo Coco F, Pisegna S, Diverio D. The AML1 gene: a transcription factor involved in the pathogenesis of myeloid and lymphoid leukemias. Haematologica. 1997;82:364–70. [PubMed] [Google Scholar]
- 11.Woolf E, Xiao C, Fainaru O, Lotem J, Rosen D, Negreanu V, et al. Runx3 and Runx1 are required for CD8 T cell development during thymopoiesis. Proc Natl Acad Sci U S A. 2003;100:7731–6. doi: 10.1073/pnas.1232420100. [DOI] [PMC free article] [PubMed] [Google Scholar]
- 12.Levanon D, Glusman G, Bettoun D, Ben-Asher E, Negreanu V, Bernstein Y, et al. Phylogenesis and regulated expression of the RUNT domain transcription factors RUNX1 and RUNX3. Blood Cells Mol Dis. 2003;30:161–3. doi: 10.1016/s1079-9796(03)00023-8. [DOI] [PubMed] [Google Scholar]
- 13.Zaidi SK, Pande S, Pratap J, Gaur T, Grigoriu S, Ali SA, et al. Runx2 deficiency and defective subnuclear targeting bypass senescence to promote immortalization and tumorigenic potential. Proc Natl Acad Sci U S A. 2007;104:19861–6. doi: 10.1073/pnas.0709650104. [DOI] [PMC free article] [PubMed] [Google Scholar]
- 14.Blyth K, Vaillant F, Jenkins A, McDonald L, Pringle MA, Huser C, et al. Runx2 in normal tissues and cancer cells: A developing story. Blood cells, molecules & diseases. 2010;45:117–23. doi: 10.1016/j.bcmd.2010.05.007. [DOI] [PubMed] [Google Scholar]
- 15.Pratap J, Imbalzano KM, Underwood JM, Cohet N, Gokul K, Akech J, et al. Ectopic runx2 expression in mammary epithelial cells disrupts formation of normal acini structure: implications for breast cancer progression. Cancer Res. 2009;69:6807–14. doi: 10.1158/0008-5472.CAN-09-1471. [DOI] [PMC free article] [PubMed] [Google Scholar]
- 16.Pratap J, Javed A, Languino LR, van Wijnen AJ, Stein JL, Stein GS, et al. The Runx2 osteogenic transcription factor regulates matrix metalloproteinase 9 in bone metastatic cancer cells and controls cell invasion. Mol Cell Biol. 2005;25:8581–91. doi: 10.1128/MCB.25.19.8581-8591.2005. [DOI] [PMC free article] [PubMed] [Google Scholar]
- 17.Onodera Y, Miki Y, Suzuki T, Takagi K, Akahira J, Sakyu T, et al. Runx2 in human breast carcinoma: its potential roles in cancer progression. Cancer Sci. 2010;101:2670–5. doi: 10.1111/j.1349-7006.2010.01742.x. [DOI] [PMC free article] [PubMed] [Google Scholar]
- 18.Pratap J, Lian JB, Stein GS. Metastatic bone disease: role of transcription factors and future targets. Bone. 2011;48:30–6. doi: 10.1016/j.bone.2010.05.035. [DOI] [PMC free article] [PubMed] [Google Scholar]
- 19.Akech J, Wixted JJ, Bedard K, van der Deen M, Hussain S, Guise TA, et al. Runx2 association with progression of prostate cancer in patients: mechanisms mediating bone osteolysis and osteoblastic metastatic lesions. Oncogene. 2010;29:811–21. doi: 10.1038/onc.2009.389. [DOI] [PMC free article] [PubMed] [Google Scholar]
- 20.Baniwal SK, Khalid O, Gabet Y, Shah RR, Purcell DJ, Mav D, et al. Runx2 transcriptome of prostate cancer cells: insights into invasiveness and bone metastasis. Molecular cancer. 2010;9:258. doi: 10.1186/1476-4598-9-258. [DOI] [PMC free article] [PubMed] [Google Scholar]
- 21.Oshimo Y, Oue N, Mitani Y, Nakayama H, Kitadai Y, Yoshida K, et al. Frequent loss of RUNX3 expression by promoter hypermethylation in gastric carcinoma. Pathobiology. 2004;71:137–43. doi: 10.1159/000076468. [DOI] [PubMed] [Google Scholar]
- 22.Hsu PI, Hsieh HL, Lee J, Lin LF, Chen HC, Lu PJ, et al. Loss of RUNX3 expression correlates with differentiation, nodal metastasis, and poor prognosis of gastric cancer. Annals of surgical oncology. 2009;16:1686–94. doi: 10.1245/s10434-009-0428-2. [DOI] [PubMed] [Google Scholar]
- 23.Huang B, Qu Z, Ong CW, Tsang YH, Xiao G, Shapiro D, et al. RUNX3 acts as a tumor suppressor in breast cancer by targeting estrogen receptor alpha. Oncogene. 2011 doi: 10.1038/onc.2011.252. [DOI] [PMC free article] [PubMed] [Google Scholar]
- 24.Growney JD, Shigematsu H, Li Z, Lee BH, Adelsperger J, Rowan R, et al. Loss of Runx1 perturbs adult hematopoiesis and is associated with a myeloproliferative phenotype. Blood. 2005;106:494–504. doi: 10.1182/blood-2004-08-3280. [DOI] [PMC free article] [PubMed] [Google Scholar]
- 25.Rossetti S, Van Unen L, Touw IP, Hoogeveen AT, Sacchi N. Myeloid maturation block by AML1-MTG16 is associated with Csf1r epigenetic downregulation. Oncogene. 2005;24:5325–32. doi: 10.1038/sj.onc.1208651. [DOI] [PubMed] [Google Scholar]
- 26.Thomas DM, Johnson SA, Sims NA, Trivett MK, Slavin JL, Rubin BP, et al. Terminal osteoblast differentiation, mediated by runx2 and p27KIP1, is disrupted in osteosarcoma. J Cell Biol. 2004;167:925–34. doi: 10.1083/jcb.200409187. [DOI] [PMC free article] [PubMed] [Google Scholar]
- 27.Galindo M, Pratap J, Young DW, Hovhannisyan H, Im HJ, Choi JY, et al. The bone-specific expression of Runx2 oscillates during the cell cycle to support a G1-related antiproliferative function in osteoblasts. J Biol Chem. 2005;280:20274–85. doi: 10.1074/jbc.M413665200. [DOI] [PMC free article] [PubMed] [Google Scholar]
- 28.Pratap J, Galindo M, Zaidi SK, Vradii D, Bhat BM, Robinson JA, et al. Cell growth regulatory role of Runx2 during proliferative expansion of preosteoblasts. Cancer Res. 2003;63:5357–62. [PubMed] [Google Scholar]
- 29.Khalid O, Baniwal SK, Purcell DJ, Leclerc N, Gabet Y, Stallcup MR, et al. Modulation of Runx2 activity by estrogen receptor-alpha: implications for osteoporosis and breast cancer. Endocrinology. 2008;149:5984–95. doi: 10.1210/en.2008-0680. [DOI] [PMC free article] [PubMed] [Google Scholar]
- 30.Baniwal SK, Khalid O, Sir D, Buchanan G, Coetzee GA, Frenkel B. Repression of Runx2 by androgen receptor (AR) in osteoblasts and prostate cancer cells: AR binds Runx2 and abrogates its recruitment to DNA. Mol Endocrinol. 2009;23:1203–14. doi: 10.1210/me.2008-0470. [DOI] [PMC free article] [PubMed] [Google Scholar]
- 31.Kawate H, Wu Y, Ohnaka K, Takayanagi R. Mutual transactivational repression of Runx2 and the androgen receptor by an impairment of their normal compartmentalization. J Steroid Biochem Mol Biol. 2007;105:46–56. doi: 10.1016/j.jsbmb.2006.11.020. [DOI] [PubMed] [Google Scholar]
- 32.Das K, Leong DT, Gupta A, Shen L, Putti T, Stein GS, et al. Positive association between nuclear Runx2 and oestrogen-progesterone receptor gene expression characterises a biological subtype of breast cancer. Eur J Cancer. 2009;45:2239–48. doi: 10.1016/j.ejca.2009.06.021. [DOI] [PMC free article] [PubMed] [Google Scholar]
- 33.Lambertini E, Penolazzi L, Tavanti E, Schincaglia GP, Zennaro M, Gambari R, et al. Human estrogen receptor alpha gene is a target of Runx2 transcription factor in osteoblasts. Exp Cell Res. 2007;313:1548–60. doi: 10.1016/j.yexcr.2007.02.002. [DOI] [PubMed] [Google Scholar]
- 34.McCarthy TL, Chang WZ, Liu Y, Centrella M. Runx2 integrates estrogen activity in osteoblasts. J Biol Chem. 2003;278:43121–9. doi: 10.1074/jbc.M306531200. [DOI] [PubMed] [Google Scholar]
- 35.Ning YM, Robins DM. AML3/CBFalpha1 is required for androgen-specific activation of the enhancer of the mouse sex-limited protein (Slp) gene. The Journal of biological chemistry. 1999;274:30624–30. doi: 10.1074/jbc.274.43.30624. [DOI] [PubMed] [Google Scholar]
- 36.Shin KJ, Wall EA, Zavzavadjian JR, Santat LA, Liu J, Hwang JI, et al. A single lentiviral vector platform for microRNA-based conditional RNA interference and coordinated transgene expression. Proc Natl Acad Sci U S A. 2006;103:13759–64. doi: 10.1073/pnas.0606179103. [DOI] [PMC free article] [PubMed] [Google Scholar]
- 37.Huang da W, Sherman BT, Lempicki RA. Systematic and integrative analysis of large gene lists using DAVID bioinformatics resources. Nat Protoc. 2009;4:44–57. doi: 10.1038/nprot.2008.211. [DOI] [PubMed] [Google Scholar]
- 38.Desmedt C, Piette F, Loi S, Wang Y, Lallemand F, Haibe-Kains B, et al. Strong time dependence of the 76-gene prognostic signature for node-negative breast cancer patients in the TRANSBIG multicenter independent validation series. Clin Cancer Res. 2007;13:3207–14. doi: 10.1158/1078-0432.CCR-06-2765. [DOI] [PubMed] [Google Scholar]
- 39.Schmidt M, Bohm D, von Torne C, Steiner E, Puhl A, Pilch H, et al. The humoral immune system has a key prognostic impact in node-negative breast cancer. Cancer Res. 2008;68:5405–13. doi: 10.1158/0008-5472.CAN-07-5206. [DOI] [PubMed] [Google Scholar]
- 40.Olson JA, Jr., Budd GT, Carey LA, Harris LA, Esserman LJ, Fleming GF, et al. Improved surgical outcomes for breast cancer patients receiving neoadjuvant aromatase inhibitor therapy: results from a multicenter phase II trial. Journal of the American College of Surgeons. 2009;208:906–14. doi: 10.1016/j.jamcollsurg.2009.01.035. discussion 15–6. [DOI] [PMC free article] [PubMed] [Google Scholar]
- 41.Miller WR, Larionov AA, Renshaw L, Anderson TJ, White S, Murray J, et al. Changes in breast cancer transcriptional profiles after treatment with the aromatase inhibitor, letrozole. Pharmacogenetics and genomics. 2007;17:813–26. doi: 10.1097/FPC.0b013e32820b853a. [DOI] [PubMed] [Google Scholar]
- 42.Baniwal SK, Little GH, Chimge NO, Frenkel B. Runx2 controls a feed-forward loop between androgen and prolactin-induced protein (PIP) in stimulating T47D cell proliferation. J Cell Physiol. 2011 doi: 10.1002/jcp.22966. [DOI] [PMC free article] [PubMed] [Google Scholar]
- 43.Dowsett M, Smith IE, Ebbs SR, Dixon JM, Skene A, A'Hern R, et al. Prognostic value of Ki67 expression after short-term presurgical endocrine therapy for primary breast cancer. Journal of the National Cancer Institute. 2007;99:167–70. doi: 10.1093/jnci/djk020. [DOI] [PubMed] [Google Scholar]
- 44.de Azambuja E, Cardoso F, de Castro G, Jr., Colozza M, Mano MS, Durbecq V, et al. Ki-67 as prognostic marker in early breast cancer: a meta-analysis of published studies involving 12, 155 patients. British journal of cancer. 2007;96:1504–13. doi: 10.1038/sj.bjc.6603756. [DOI] [PMC free article] [PubMed] [Google Scholar]
- 45.Miller WR, Larionov A, Renshaw L, Anderson TJ, Walker JR, Krause A, et al. Gene expression profiles differentiating between breast cancers clinically responsive or resistant to letrozole. Journal of clinical oncology : official journal of the American Society of Clinical Oncology. 2009;27:1382–7. doi: 10.1200/JCO.2008.16.8849. [DOI] [PubMed] [Google Scholar]
- 46.Stender JD, Kim K, Charn TH, Komm B, Chang KC, Kraus WL, et al. Genome-wide analysis of estrogen receptor alpha DNA binding and tethering mechanisms identifies Runx1 as a novel tethering factor in receptor-mediated transcriptional activation. Molecular and cellular biology. 2010;30:3943–55. doi: 10.1128/MCB.00118-10. [DOI] [PMC free article] [PubMed] [Google Scholar]
- 47.Cicatiello L, Mutarelli M, Grober OM, Paris O, Ferraro L, Ravo M, et al. Estrogen receptor alpha controls a gene network in luminal-like breast cancer cells comprising multiple transcription factors and microRNAs. Am J Pathol. 2010;176:2113–30. doi: 10.2353/ajpath.2010.090837. [DOI] [PMC free article] [PubMed] [Google Scholar]
- 48.Archambault V, Glover DM. Polo-like kinases: conservation and divergence in their functions and regulation. Nature reviews Molecular cell biology. 2009;10:265–75. doi: 10.1038/nrm2653. [DOI] [PubMed] [Google Scholar]
- 49.Li JJ, Weroha SJ, Lingle WL, Papa D, Salisbury JL, Li SA. Estrogen mediates Aurora-A overexpression, centrosome amplification, chromosomal instability, and breast cancer in female ACI rats. Proceedings of the National Academy of Sciences of the United States of America. 2004;101:18123–8. doi: 10.1073/pnas.0408273101. [DOI] [PMC free article] [PubMed] [Google Scholar]
- 50.Maynadier M, Nirde P, Ramirez JM, Cathiard AM, Platet N, Chambon M, et al. Role of estrogens and their receptors in adhesion and invasiveness of breast cancer cells. Adv Exp Med Biol. 2008;617:485–91. doi: 10.1007/978-0-387-69080-3_48. [DOI] [PMC free article] [PubMed] [Google Scholar]
Associated Data
This section collects any data citations, data availability statements, or supplementary materials included in this article.