Abstract
Breast cancer is the most common cancer in women worldwide. It is necessary to identify biomarkers for early detection, to make accurate prognoses, and to monitor for any recurrence of the cancer. In order to identify potential breast cancer biomarkers, we analyzed the plasma samples of women diagnosed with breast cancer and age-matched normal healthy women by mTRAQ-based stable isotope-labeling mass spectrometry. We identified and quantified 204 proteins including thrombospondin-1 (THBS1) and bromodomain and WD repeat-containing protein 3 (BRWD3) which were increased by more than 5-fold in breast cancer plasma. The plasma levels of the two proteins were evaluated by Western blot assay to confirm for their diagnostic value as serum markers. A 1.8-fold increase in BRWD3 was observed while comparing the plasma levels of breast cancer patients (n = 54) with age-matched normal healthy controls (n = 30), and the area under the receiver operating characteristic curve (AUC) was 0.917. THBS1 was detected in pooled breast cancer plasma at the ratio similar to mTRAQ ratio (> 5-fold). The AUC value for THBS1 was 0.875. The increase of THBS1 was more prominent in estrogen receptor negative and progesterone receptor negative patients than receptor-positive patients. Our results are evidence of the diagnostic value of THBS1 in detecting breast cancer. Based on our findings, we suggest a proteomic method for protein identification and quantification lead to effective biomarker discovery.
Keywords: biological markers; breast neoplasms; BRWD3 protein, human; mass spectrometry; proteomics; thrombospondin 1
Introduction
Breast cancer is a global health concern. According to the World Health Organization (WHO), breast cancer is the leading killer cancer in women aged 20-59 years in high-income countries. Breast cancer has been the most common cancer among Korean women since 2002 and may continue to increase for the next 20 years, at least (Yoo et al., 2006). According to a nationwide survey to evaluate the chronological changes in Korean breast cancer characteristics, there was a strong continuous increase from 1996 to 2004 the percentage of early stage breast cancer and asymptomatic cases (128.6% increase for stage O; a 64.8% increase for stage I) (Ahn and Yoo, 2006). It is expected that compared against 1983 records, the mortality rate of breast cancer will have increased 3-fold by the year 2020 (Kim et al., 2009). Detection of breast cancer at an early stage of the disease is critical to an improved prognosis and survival rate. Especially, serum biomarkers are most attractive for the purpose since a simple blood test is minimally invasive to patients and can yield valuable information about the breast cancer status. Several breast cancer biomarkers have already been identified, including estrogen receptor (ER), progesterone receptor (PR) (Osborne et al., 1980), carbohydrate antigen 15-3 (CA15-3) (Duffy, 1999), carcinoembryonic antigen (CEA) (Haagensen et al., 1978), Her-2/neu (Paik et al., 1990), etc. Often these biomarkers are over-expressed in breast cancer patients, and they can also be detected in tumor cells, blood, and other body fluids. CEA is the first widely used serum biomarker for breast cancer, but it has been found to be a non-organ-specific biomarker. However, many biomarker discovery studies were not driven by a particular clinical application. New screening markers with high specificity and sensitivity are still required for breast cancer.
Proteomic analyses make the global comparison of proteins from almost any biological sample, thus enabling the identification of multiple proteins of interest in a single experiment. Differential protein expression between conditions, e.g. diseased and normal, may be examined by applying proteomic tools within a well-defined hypothesis (Meehan et al., 2010). Current biomarker discoveries using isotopically labeled protein digests of samples such as tissues and blood, followed by liquid chromatographic separation and mass spectrometric (MS) analyses have produce putative cancer markers. In particular, we have successfully applied mTRAQ for performing a relative quantification of proteins between two different states. The technology uses two chemically identical versions with different masses that can label peptides at amine groups. It indicates that, in a sample mixture where peptides originating from different sources are tagged separately with heavy and light labels, the two versions can be monitored at each MS spectrum and their intensities compared directly (Kang et al., 2010b).
In this study, we tried to discover breast cancer biomarkers from blood plasma. Six abundant proteins were depleted from all plasma samples using affinity chromatography, and then quantitatively analyzed by using the mTRAQ-labeling method. The biomarker candidates discovered were then confirmed and verified with a blinded set of multiple samples by Western blot assays. Our study showed that levels of throbospondin-1 (THBS1) and bromodomain and WD repeat-containing protein 3 (BRWD3) increase in breast cancer plasma suggesting them as potential breast cancer biomarkers.
Results
Quantitative profiling of breast cancer plasma proteome
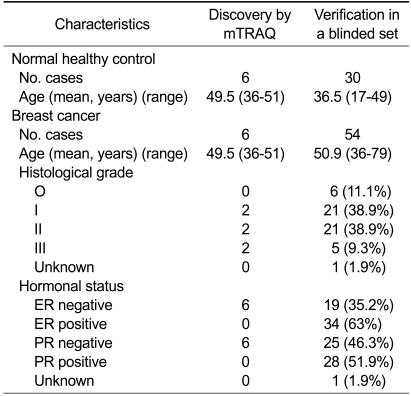
The mTRAQ analysis was introduced for profiling of differentially expressed proteins in a set of pooled plasma samples of breast cancer patients (n = 6, age = 36-59, cancer grade = I-III) and age-matched normal healthy women (n = 6) (Table 1). Analyzing the mTRAQ-labeled tryptic peptides by LC-MS/MS, the number of unique peptides identified was 6,984 (Peptide-Prophet probability > 0.9) and a total 204 proteins were confidently identified (Protein-Prophet probability > 0.9). Of these 204 proteins, 192 proteins (94%) were identified by two or more peptide matches, and 12 proteins (6%) were identified by single peptide match (Supplemental Data Table S1).
Table 1.
Clinical and pathological data for the breast cancer patients and the healthy control
ER, estrogen receptor; PR, progesterone receptor.
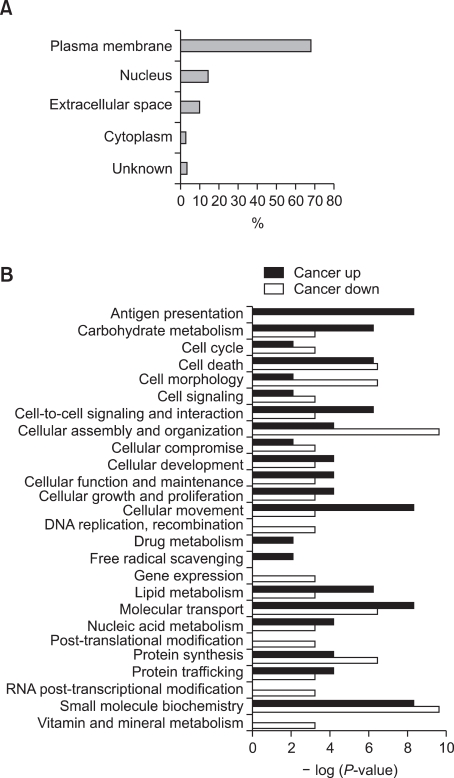
The ratios of differentially expressed proteins between the plasmas of breast cancer patients and normal healthy women were calculated by the XPRESS software. Then, we classified the 204 proteins based on their functional and compartmental class. Since a single protein is usually involved in multiple molecular and cellular functions, the total count of functionally classified proteins exceeded 204. As shown in Figure 1A, more than 70% of proteins were extracellular proteins (extracellular space and plasma membrane). Figure 1B displays the distribution of the identified proteins across various biological processes according to disease state. Proteins related to cell development and maintenance, which includes carbohydrate metabolism, cell-to-cell signaling and interaction, cellular movement and lipid metabolism, were increased in breast cancer. Over-expression of the proteins related to antigen presentation was also observed, which may be due to an increased inflammatory response as cancer progresses.
Figure 1.
Localization and functional categorization of the identified proteins. (A) More than 70% of the identified 204 proteins were extracellular proteins (extracellular space, 10%; plasma membrane, 68%). (B) The distribution of proteins across various biological processes.
The greater part of the whole identified proteins were not remarkably changed in expression level between breast cancer and normal, and only 8 proteins showed an increased abundance greater than 2-fold in breast cancer plasma (Table 2). Two proteins, namely THBS1 and BRWD3 showed the highest, more than 5-fold ratios of increase which led us to test their diagnostic potential in a follow-up study.
Table 2.
Mass spectrometric identification of the proteins exhibiting greater than 2-fold increase in breast cancer plasma
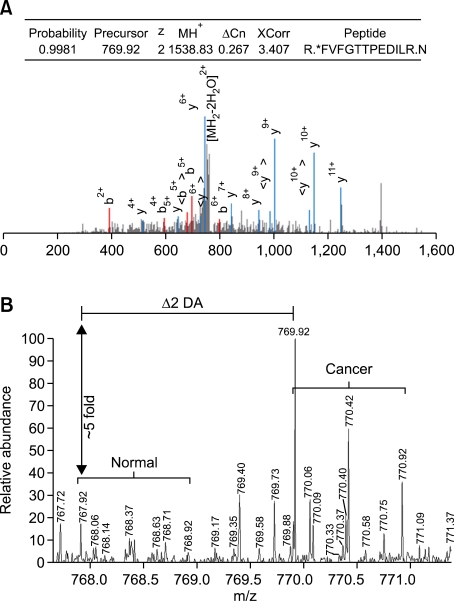
The selection was mainly based on the cancer/normal ratios of the proteins derived from mTRAQbased quantitation. THBS1 protein was identified and quantified by a single unique peptide match. Although the number of peptides matched to THBS1 was three, two peptides were shared by other protein (Supplemental Data Table S1). The single unique peptide, FVFGTTPEDILR, was identified by SQUEST with X-corr score 3.4, deltaCN 0.267 for the doubly charged ions (Figure 2). Peptide probability for the peptide was 0.998 in Trans Proteomics Pipeline (TPP). BRWD3 protein was identified by two unique peptide matches and quantified by three peptide matches. One of them showing the highest probability was identified as AAAPTQIEAELYYLIAR with X-corr score 3.3, deltaCN 0.257 for the 4+-charged ions. Peptide probability was 0.982 in TPP (Supplemental Data Figure S1). The peptide was partially tryptic digested with start codon methionine just ahead of the sequence.
Figure 2.
Identification and quantification of the THBS1 by mTRAQ analysis. (A) MS search output identifying THBS1 protein. MH+, theoretical mass for the singly charged molecular ion; ΔCn, delta correlation; XCorr, cross-correlation score. Tandem mass spectrum is shown below. Spectrum was generated using the Trans Proteomic Pipeline. *denotes mTRAQ label. (B) Quantification of THBS1 through the mTRAQ-labeled peptide FVFGTTPEDILR using parent ion signal intensity. The precursor ion at m/z = 769.92 was selected and fragmented to generate MS/MS spectrum in (A).
The present data were compared with our previous report in which 155 proteins were identified by analyzing the same plasma sample set. While ICAT labeling followed by LTQ-ion trap MS was employed in the previous analysis (Kang et al., 2010a), mTRAQ and LTQ-Orbitrap MS were used in the present study. Among the 204 proteins identified by mTRAQ, 86 proteins were common in both dataset and 126 proteins had not been observed in ICAT. The two proteins THBS1 and BRWD3 were included in mTRAQ data only.
Confirmation of protein abundance difference by Western blot analysis
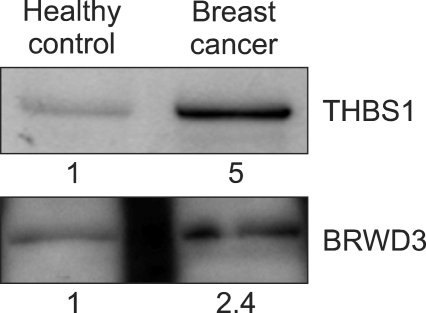
We next addressed a question whether THBS1 and BRWD3 have enough diagnostic value as serum markers of breast cancer. For this, the plasma level of the two proteins was evaluated by Western blot assay. Quantitation by MS is not always equal to that based on immunoassay (Rifai et al., 2006). Since we were willing to use Western blot for verification of biomarker candidates, confirmation of MS quantitation result by immunoassay was a prerequisite to large scale verification. The levels of THBS1 and BRWD3 in the pooled plasma sample used for mTRAQ quantitation were assessed by Western blot. The THBS1 protein expression level showed a 5-fold increase in the pooled plasma of breast cancer patients compared to the pooled plasma of the healthy control, which was highly consistent with MS data (Figure 3). However, we observed only a 2.4-fold increase for BRWD3 even though both MS and Western blot data showed an increase of BRWD3 in breast cancer.
Figure 3.
Western blot analysis of THBS1 and BRWD3 in pooled plasma. Western blot assay was performed for the pooled plasma of breast cancer patients and age-matched normal healthy women to confirm mass spectrometric data. Band intensities were quantitated densitiometrically.
Verification of THBS1 and BRWD3 as potential breast cancer biomarkers in plasma
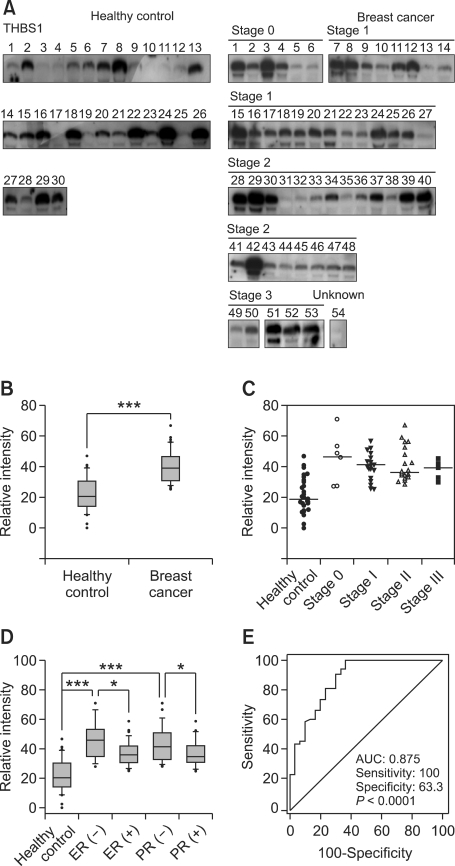
We next tested the diagnostic values of THBS1 and BRWD3 in a blinded set of plasmas from 54 breast cancer patients (age = 36-79, cancer stage = O-III) and 30 normal healthy women (age = 17-49) (Table 1) by Western blots. Compared to the healthy control, the median value of THBS1 was increased 1.9-fold (P < 0.0001) in breast cancer plasma (Figure 4B). THBS1 levels were relatively similar in all cancer stages tested (O-III). THBS1 level was increased greater in ER negative and PR negative cases than receptor positive cases. Statistical analysis by rank sum test comparing healthy control and receptor negative cancers manifested an increase of THBS1 level in breast cancers (P < 0.0001 for ER negative; P < 0.0001 for PR negative). Also, THBS1 levels were higher in receptor negative cases than receptor positive cases (P = 0.0167 for ER; P = 0.0040 for PR; Figure 4D). Dividing the cancer patients equally into two subgroups by age, the THBS1 level was slightly higher in older groups than younger groups (P = 0.0435; data not shown). No significant difference was observed in healthy controls (P = 0.7535). The specificity and the sensitivity of THBS1 measurement for breast cancer diagnosis are represented by a receiver operating characteristic (ROC) curve (Figure 4E). The area under the ROC curve (AUC) was 0.875 (sensitivity = 100%, and specificity=63.3%). According to the guideline suggested by Swets (1988), the AUC of THBS1 lay within the moderately accurate range (0.7 < AUC ≤ 0.9).
Figure 4.
THBS1 level in plasma of breast cancer patients and healthy controls. (A) Western blot analysis was performed for THBS1 with the plasma samples from 54 breast cancer patients as well as 30 age-matched healthy controls. (B) Western blot images were scanned and their intensities were determined by densitometry and the data are presented as a box plot. (C) THBS1 levels are presented according to the pathological grade. Horizontal bars represent median values. (D) THBS1 levels are presented according to ER and PR status. (E) The relationship between the specificity and the sensitivity of THBS1 measurement for the detection of breast cancer is represented by an ROC curve. The AUC value is 0.875. The number of asterisks denote significance level of differences (***P < 0.001, **P < 0.01 and *P < 0.05, Mann-Whitney U test) in the median values of each comparison.
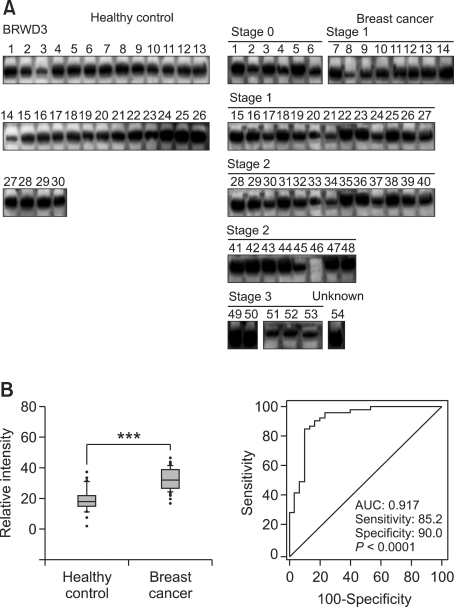
In the initial stages of biomarker discovery by MS and the following Western blot analysis, we observed a slight discrepancy between mass spectrometry and Western blot data for BRWD3. However, the sample pooling strategy yields a possibility of generating biased quantification result stemming from individual variations, which necessitates an independent downstream assay in individual samples. Therefore, we confirmed the level of BRWD3 together with THBS1 in individual breast cancer plasma samples. In almost all individual samples, we clearly detected BRWD3. The median value of BRWD3 was increased 1.8-fold in breast cancer plasma with the P-value of 0.0001 (Figure 5). However, the expression levels were distributed continuously without a clear-cut threshold value. The AUC value of ROC curve was 0.917 (sensitivity = 85.2%, specificity = 90%).
Figure 5.
BRWD3 level in plasma of breast cancer patients and healthy controls. (A) Western blot analysis was performed for BRWD3 with the plasma samples from 54 breast cancer patients as well as 30 age-matched healthy controls. (B) Western blot images were scanned and their intensities were determined by densitometry. The box plot represents levels of BRWD3 (***P < 0.0001; left panel). The relationship between the specificity and the sensitivity of BRWD3 measurement for the detection of breast cancer is represented by an ROC curve (right panel).
Discussion
This study presents a comparative profiling of plasma proteins between breast cancer patients and age-matched healthy women by using the mTRAQ-labeling method. We quantified 204 proteins and tested two of them for their diagnostic values when they showed an over 5-fold increase in breast cancer plasma. Among the 204 proteins, 86 proteins had been commonly identified in our previous study in which ICAT labeling followed by LTQ-ion trap MS was employed for the analysis of breast cancer plasma proteins (Kang et al., 2010a). The low percentage of proteins shared by the two dataset (24% of the total proteins) can largely be attributed to the difference of the labeling strategy between ICAT and mTRAQ. ICAT labels the sulfhydryl group of cysteine residue and mTRAQ labels primary amine groups. The percentage value is quite comparable to the value (30%) obtained in the analysis of tissue proteome (Kang et al., 2010b), which exemplify the notion that ICAT and mTRAQ are not mutually exclusive but complementary to each other. We also noticed that in both studies, the biotinidase (BTD) level was lower in breast cancer plasma than healthy control though the fold-ratio was smaller in this study than the previous one (0.79-fold by mTRAQ vs. 0.51-fold by ICAT).
This study provides a proteomic strategy for biomarker discovery. Proteomic techniques are convenient to identify proteins in a biological sample. For practical use in clinical research, accurate and sensitive identification and quantification of biomarker candidates is demanded. We have shown that labeling of tryptic peptides with mTRAQ improved spectrum quality compared to other chemical labeling method. In addition, mTRAQ labeling increased confidence in protein identification (Kang et al., 2010b). In that sense, our quantitative profiling by mTRAQ method is suited to discover biomarkers, and actually enabled us to identify THBS1 as a biomarker candidate for breast cancer. Many of previous studies about THBS1 focused on its complicated role during angiogenesis in breast cancer (Bagavandoss and Wilks, 1990; Good et al., 1990; Taraboletti et al., 1990; Volpert et al., 1998). Because THBS1 affects breast cancer extensively, researchers have attempted to use it as an anti-cancer agent. Coincidently, our study confirms the finding of previous reports on a correlation between intra-tumoral THBS1 level and clinicopathological prognostic parameters (Bicknell and Harris, 1991; Fidler and Ellis, 1994; Folkman, 1995).
Based on the mTRAQ-quantitation result, THBS1 and BRWD3 were selected for further validation in a blinded set of plasmas from 54 breast cancer patients and 30 healthy women. However, the two proteins showed different validation outputs as to their potential diagnostic values. The level of THBS1 was higher in breast cancer plasma and positive expression values were clearly distinguished from negative values while BRWD3 was detected in almost all individual samples. The validation data suggest THBS1 as a biomarker for breast cancer and adds clear evidence that plasma level of THBS1 is positively correlated with breast cancer progression (Byrne et al., 2007). THBS1 is a high molecular weight glycoprotein, originally described as a secretion product of platelets, which assists in wound healing, with protease activity that serves as an adhesive protein in cell-cell and cell-substratum interactions (Baenziger et al., 1971). THBS1 has important roles in human tumor invasion and metastasis (Lee et al., 2010) including aggressive promotion of breast cancer cell invasion (Wang et al., 1996). THBS1 is one of endogenous inhibitors of tumor angiogenesis (Bouck et al., 1996). Recently, it has been reported that there is a direct correlation between plasma levels of THBS1 and breast cancer stages with higher levels being found in women with metastatic breast cancer (Byrne et al., 2007), with which our study on 84 plasma samples is highly consistent. THBS1 is synthesized and secreted by many cultured human tumor cell lines derived from squamous carcinoma, melanoma, glioma (Varani et al., 1989), osteosarcoma (Clezardin et al., 1989), and breast adenocarcinoma (Incardona et al., 1993). THBS1 could be found commonly in malignant breast tissues, especially in the stromal vicinity of the tumor cells. By contrast, normal breast tissue and benign breast lesions showed no THBS1 (Wong et al., 1992). Since THBS1 is synthesized in breast cancer cells and tissues, it may well be detected higher in the plasma of breast cancer patients. Hence, our result supports the role of THBS1 as a serological biomarker in breast cancer.
Our results also provide evidence that ER and PR status is correlated with plasma level of THBS1 in breast cancer. ER and PR status are important criteria to decide which therapy is proper since estrogen and progesterone play a critical role in breast cancer etiology (Key and Pike, 1988; Andre and Pusztai, 2006). ER negative tumors have a more aggressive character and a different metastatic pathway than ER positive tumors. Thus, THBS1 that is detected more in ER negative breast cancer may constitute a complementary biomarker to known screening methods and be helpful to a better prognosis. With the data hitherto provided in the current study as well as several previous reports, it is then obvious that the measurement of plasma levels of THBS1 may have clinical value for a better outcome in breast cancer treatment.
In our study, BRWD3 protein was detected at slightly higher levels in the breast cancer plasmas. The function of BRWD3 is unknown but can be surmised from its structure. Bromodomains are typically present in chromatin-associated proteins, many of which have a chromatin-modifying function (de la Cruz et al., 2005). The relationship between BRWD3 and breast cancer has not been studied yet. Our result implies that BRWD3 is not a good biomarker for discriminating breast cancer due to the difficulty of determining threshold value. However this does not exclude the possibility of BRWD3's involvement in breast cancer and this will requires further study at the molecular level.
For most types of cancers including breast cancer, early detection using biomarkers enables physicians to more successfully administer therapy. Having a better understanding of the release of proteins from tumors into blood would greatly facilitate prompt and more effective treatment. In the present work we adapted comparative quantitative proteomics using mTRAQ labeling and tandem mass spectrometry to the search for new serological biomarkers of breast cancer. Our study revaluated the diagnostic power of THBS1 in the detection of breast cancer.
Methods
Materials
Reagent grade chemicals and proteins were purchased from Sigma Aldrich (St. Louis, MO), or Thermo Fisher Scientific (Rockford, IL). mTRAQ reagent (Δ0 and Δ4) was obtained from AB SCIEX (Framingham, MA).
Subjects
Blood samples were collected from breast cancer patients and normal healthy volunteers at the Seoul National University Hospital (30 breast cancer patients, 30 normal healty volunteer) and Asan Medical Center (24 breast cancer patients). The use of human samples for research purpose was authorized by the Institutional Review Board of Seoul National University Hospital and Asan Medical Center, and all the patients and volunteers agreed to take part in the experiment, signing their names on the informed consent document. Six breast cancer plasma samples and six plasma samples of age-matched healthy women were used in the mTRAQ-based discovery study; and 54 breast cancer plasmas and 30 plasmas from healthy women were used in the follow-up verification study (Table 1). The plasma samples were depleted of the top six abundant serum proteins using a multiple-affinity MARS column (Agilent Technologies, Palo Alto, CA) (Park et al., 2011), and precipitated with trichloroacetic acid (Kang et al., 2010a). The pellet was dissolved in a denaturation buffer (6 M urea, 0.05% SDS, 5 mM EDTA, 50 mM Tris-HCl, pH 8.3).
mTRAQ tagging and sample preparation
We pooled equal amounts of proteins from the 6 breast cancer patients and the 6 normal healthy women, separately. mTRAQ-labeling of proteins was performed as described previously (Kang et al., 2010b). Proteins (100 µg) in the denaturation buffer were first reduced with 250 mM Tris(2-carboxyethyl)phosphine for 1 h at 60℃, treated with 200 mM methyl methane-thiosulfonate for 10 min at 25℃, and then diluted 10 fold with 50 mM Tris (pH 8.0), and digested with sequencing-grade trypsin (Promega, Madison, WI) at 37℃ overnight at the protein:trypsin molar ratio of 40:1. Tryptic digests were desalted with C18 SPE cartridges and dried in vacuum. The dried samples were reconstituted in 500 mM triethyl ammonium bicarbonate and incubated with mTRAQ reagent at 25℃ for 1 h as indicated in the manufacturer's protocol.
Tryptic peptides of the pooled plasma sample from 6 breast cancer patients were labeled with Δ4-mTRAQ, while those of normal healthy women were labeled with Δ0-mTRAQ. After 1 h reaction, the Δ4- and Δ0-mTRAQ labeled peptides were combined, dried in vacuum, re-dissolved in 0.1% TFA, and cleaned using Oasis® MCX (1 cc, 30 mg) solid-phase extraction cartridges (Waters, Milford, MA). Finally, the peptides were fractionated according to their pI values on a 3100 OFFGEL fractionator system (Agilent Technologies). An OFFGEL kit pH 3-10 with a 12 well setup was used according to the manufacturer's protocol. Fifteen minutes prior to sample loading, 12 cm long IPG gel strips with a linear pH gradient ranging from 3 to 10 were rehydrated in the assembled device with 0.7 ml of rehydration solution. About 200 mg of peptide sample was diluted in rehydration solution, and the sample was loaded in each well. The sample was focused at typical voltages ranging from 200 to 4500 V until 20 kVh was reached after 24 h, with a maximum current of 50 µA. After electrophoresis, the separated peptides were recovered from each well (volumes between 50 and 150 µl), desalted with C18 SPE cartridges and dried in vacuum.
Liquid chromatography and tandem mass spectrometry
Peptide samples were reconstituted in 0.4% acetic acid and an aliquot (~1 µg) was injected into a reversed-phase Magic C18aq column (15 cm × 75 µm) on an Eksigent MDLC system at a flow rate of 300 nl/min. The column was equilibrated with 95% buffer A (0.1% formic acid in H2O) and 5% buffer B (0.1% formic acid in acetonitrile) prior to use. Peptides were eluted with a linear gradient of 10-40% buffer B over 90 min.
The HPLC system was coupled to an LTQ XL-Orbitrap mass spectrometer (Thermo Fisher Scientific). The spray voltage was set to 1.9 kV, and the temperature of the heated capillary was set to 250℃. Survey full-scan MS spectra (m/z 300-2,000) were acquired in the Orbitrap with 1 microscan and a resolution of 100,000 allowing the preview mode for precursor selection and charge-state determination. MS/MS spectra of the five most intense ions from the preview survey scan were acquired in the ion-trap concurrent with full-scan acquisition in the Orbitrap with the following options: isolation width, 3 m/z; normalized collision energy, 35%; dynamic exclusion duration, 30 s. Precursors with unmatched charge state were discarded during data dependant acquisition. Data were acquired using the Xcalibur software version 2.0.7.
Database search and data analysis
The DTA files for tandem mass spectra were generated by the Extract-msn program (v3) of Bioworks software (v3.2) with the following parameters: minimum ion count threshold, 15; minimum intensity, 100. The acquired MS/MS spectra were searched using SEQUEST (TurboSequest version 27, revision 12) against the human International Protein Index database plus known contaminants which include 72,065 protein entries (IPI, versions 3.44, European Bioinformatics Institute, http://www.ebi.ac.uk/IPI), allowing the options of no enzyme, 0.5000 Da mass tolerance for MS/MS, 15 ppm mass tolerance for MS. mTRAQ option (140.0950 Da as fixed modification plus +4.0071 Da as variable modification) on N-terminus and lysine residue and a fixed modification of 45.9877 Da on cysteine residue were used. Variable modification of methionine oxidation (+15.9949 Da) was also allowed.
Peptide assignment and quantification were performed with the TPP (TPP, version 4.0, http://www.proteomecenter.org). The SEQUEST search output was used as an input for pepXML module allowing trypsin restriction and 'monoisotopic masses' options. Then Peptide-Prophet was applied with 'accurate mass binning' option. Peptides with probabilities greater than 0.05 were included in the subsequent Protein-Prophet, and proteins having protein probability more than 0.9 were gathered. Quantification analysis was achieved by using XPRESS during TPP analysis. The XPRESS mass difference was set to 4.0071 Da and 0.0500 Da of 'XPRESS mass tolerance' was used.
Western blot analysis
Plasma samples were fractionated by SDS-PAGE, transferred onto a PVDF membrane (Amersham BioScience, Piscataway, NJ), blocked with 5% skim milk in TTBS (20 mM Tris, pH 7.4, 150 mM NaCl, and 0.05% Tween 20 with 0.01% sodium azide), and incubated with specific antibodies. Antibodies directed to THBS1 (SantaCruz Biotechnology Inc., Santa Cruz, CA), and BRWD3 (Abcam, Cambridge, MA) were used as primary antibodies. Blots were washed five times with TTBS buffer and incubated with horseradish peroxidase-conjugated secondary antibody with 5% skim milk in TTBS for 1 h at room temperature, and then developed with a chemiluminescence detection system (ECL plus; GE Healthcare, Piscataway, NJ).
Statistical ananlysis
Band intensities of Western blot images were quantified using ImageQuant version 5.2. (GE Healthcare). Statistical analyses were performed by the Mann-Whitney U test (Medcalc, Medcalc software, Ghent, Belgium). The box plots and dot plot were generated by SigmaPlot software (version10.0, Systat Inc., CA). The ROC curves were calculated using MedCalc® version 11.3.0.0. software (Medcalc software).
Supplemental data
Supplemental data include a figure and a table, and can be found with this article online at http://e-emm.or.kr/article/article_files/SP-44-1-05.pdf.
Acknowledgements
This study was supported by a grant from the Functional Proteomics Center of the 21st Century Frontier R&D Program funded by the Korean Ministry of Education, Science and Technology, Republic of Korea.
Abbreviations
- AUC
area under the curve
- BRWD3
bromo-domodomain and WD repeat-containing protein 3
- ER
estrogen receptor
- IPA
ingenuity pathways analysis
- PR
progesteron receptor
- ROC
receiver operating characteristic
- THBS1
thrombospondin-1
- TPP
trans-proteomic pipeline
Supplemental Material
Supplemental Data
References
- 1.Ahn SH, Yoo KY. Chronological changes of clinical characteristics in 31,115 new breast cancer patients among Koreans during 1996-2004. Breast Cancer Res Treat. 2006;99:209–214. doi: 10.1007/s10549-006-9188-x. [DOI] [PubMed] [Google Scholar]
- 2.Andre F, Pusztai L. Molecular classification of breast cancer: implications for selection of adjuvant chemotherapy. Nat Clin Pract Oncol. 2006;3:621–632. doi: 10.1038/ncponc0636. [DOI] [PubMed] [Google Scholar]
- 3.Baenziger NL, Brodie GN, Majerus PW. A thrombin-sensitive protein of human platelet membranes. Proc Natl Acad Sci USA. 1971;68:240–243. doi: 10.1073/pnas.68.1.240. [DOI] [PMC free article] [PubMed] [Google Scholar]
- 4.Bagavandoss P, Wilks JW. Specific inhibition of endothelial cell proliferation by thrombospondin. Biochem Biophys Res Commun. 1990;170:867–872. doi: 10.1016/0006-291x(90)92171-u. [DOI] [PubMed] [Google Scholar]
- 5.Bicknell R, Harris AL. Novel growth regulatory factors and tumour angiogenesis. Eur J Cancer. 1991;27:781–785. doi: 10.1016/0277-5379(91)90189-k. [DOI] [PubMed] [Google Scholar]
- 6.Bouck N, Stellmach V, Hsu SC. How tumors become angiogenic. Adv Cancer Res. 1996;69:135–174. doi: 10.1016/s0065-230x(08)60862-3. [DOI] [PubMed] [Google Scholar]
- 7.Byrne GJ, Hayden KE, McDowell G, Lang H, Kirwan CC, Tetlow L, Kumar S, Bundred NJ. Angiogenic characteristics of circulating and tumoural thrombospondin-1 in breast cancer. Int J Oncol. 2007;31:1127–1132. doi: 10.3892/ijo.31.5.1127. [DOI] [PubMed] [Google Scholar]
- 8.Clezardin P, Jouishomme H, Chavassieux P, Marie PJ. Thrombospondin is synthesized and secreted by human osteoblasts and osteosarcoma cells. A model to study the different effects of thrombospondin in cell adhesion. Eur J Biochem. 1989;181:721–726. doi: 10.1111/j.1432-1033.1989.tb14783.x. [DOI] [PubMed] [Google Scholar]
- 9.de la Cruz X, Lois S, Sanchez-Molina S, Martinez-Balbas MA. Do protein motifs read the histone code? Bioessays. 2005;27:164–175. doi: 10.1002/bies.20176. [DOI] [PubMed] [Google Scholar]
- 10.Duffy MJ. CA 15-3 and related mucins as circulating markers in breast cancer. Ann Clin Biochem. 1999;36(Pt 5):579–586. doi: 10.1177/000456329903600503. [DOI] [PubMed] [Google Scholar]
- 11.Fidler IJ, Ellis LM. The implications of angiogenesis for the biology and therapy of cancer metastasis. Cell. 1994;79:185–188. doi: 10.1016/0092-8674(94)90187-2. [DOI] [PubMed] [Google Scholar]
- 12.Folkman J. Angiogenesis in cancer, vascular, rheumatoid and other disease. Nat Med. 1995;1:27–31. doi: 10.1038/nm0195-27. [DOI] [PubMed] [Google Scholar]
- 13.Good DJ, Polverini PJ, Rastinejad F, Le Beau MM, Lemons RS, Frazier WA, Bouck NP. A tumor suppressor-dependent inhibitor of angiogenesis is immunologically and functionally indistinguishable from a fragment of thrombospondin. Proc Natl Acad Sci USA. 1990;87:6624–6628. doi: 10.1073/pnas.87.17.6624. [DOI] [PMC free article] [PubMed] [Google Scholar]
- 14.Haagensen DE, Jr, Kister SJ, Vandevoorde JP, Gates JB, Smart EK, Hansen HJ, Wells SA., Jr Evaluation of carcinoembryonic antigen as a plasma monitor for human breast carcinoma. Cancer. 1978;42:1512–1519. doi: 10.1002/1097-0142(197809)42:3+<1512::aid-cncr2820420824>3.0.co;2-6. [DOI] [PubMed] [Google Scholar]
- 15.Incardona F, Calvo F, Fauvel-Lafeve F, Legrand Y, Legrand C. Involvement of thrombospondin in the adherence of human breast-adenocarcinoma cells: a possible role in the metastatic process. Int J Cancer. 1993;55:471–477. doi: 10.1002/ijc.2910550325. [DOI] [PubMed] [Google Scholar]
- 16.Kang UB, Ahn Y, Lee JW, Kim YH, Kim J, Yu MH, Noh DY, Lee C. Differential profiling of breast cancer plasma proteome by isotope-coded affinity tagging method reveals biotinidase as a breast cancer biomarker. BMC Cancer. 2010a;10:114. doi: 10.1186/1471-2407-10-114. [DOI] [PMC free article] [PubMed] [Google Scholar]
- 17.Kang UB, Yeom J, Kim H, Lee C. Quantitative analysis of mTRAQ-labeled proteome using full MS scans. J Proteome Res. 2010b;9:3750–3758. doi: 10.1021/pr9011014. [DOI] [PubMed] [Google Scholar]
- 18.Key TJ, Pike MC. The role of oestrogens and progestagens in the epidemiology and prevention of breast cancer. Eur J Cancer Clin Oncol. 1988;24:29–43. doi: 10.1016/0277-5379(88)90173-3. [DOI] [PubMed] [Google Scholar]
- 19.Kim J, Shin A, Lee JS, Youn S, Yoo KY. Dietary factors and breast cancer in Korea: an ecological study. Breast J. 2009;15:683–686. doi: 10.1111/j.1524-4741.2009.00817.x. [DOI] [PubMed] [Google Scholar]
- 20.Lee YJ, Koch M, Karl D, Torres-Collado AX, Fernando NT, Rothrock C, Kuruppu D, Ryeom S, Iruela-Arispe ML, Yoon SS. Variable inhibition of thrombospondin 1 against liver and lung metastases through differential activation of metalloproteinase ADAMTS1. Cancer Res. 2010;70:948–956. doi: 10.1158/0008-5472.CAN-09-3094. [DOI] [PMC free article] [PubMed] [Google Scholar] [Retracted]
- 21.Meehan KL, Rainczuk A, Salamonsen LA, Stephens AN. Proteomics and the search for biomarkers of female reproductive diseases. Reproduction. 2010;140:505–519. doi: 10.1530/REP-10-0226. [DOI] [PubMed] [Google Scholar]
- 22.Osborne CK, Yochmowitz MG, Knight WA, 3rd, McGuire WL. The value of estrogen and progesterone receptors in the treatment of breast cancer. Cancer. 1980;46:2884–2888. doi: 10.1002/1097-0142(19801215)46:12+<2884::aid-cncr2820461429>3.0.co;2-u. [DOI] [PubMed] [Google Scholar]
- 23.Paik S, Hazan R, Fisher ER, Sass RE, Fisher B, Redmond C, Schlessinger J, Lippman ME, King CR. Pathologic findings from the National Surgical Adjuvant Breast and Bowel Project: prognostic significance of erbB-2 protein overexpression in primary breast cancer. J Clin Oncol. 1990;8:103–112. doi: 10.1200/JCO.1990.8.1.103. [DOI] [PubMed] [Google Scholar]
- 24.Park J, Cha DH, Lee SJ, Kim YN, Kim YH, Kim KP. Discovery of the serum biomarker proteins in severe preeclampsia by proteomic analysis. Exp Mol Med. 2011;43:427–435. doi: 10.3858/emm.2011.43.7.047. [DOI] [PMC free article] [PubMed] [Google Scholar]
- 25.Rifai N, Gillette MA, Carr SA. Protein biomarker discovery and validation: the long and uncertain path to clinical utility. Nat Biotechnol. 2006;24:971–983. doi: 10.1038/nbt1235. [DOI] [PubMed] [Google Scholar]
- 26.Swets JA. Measuring the accuracy of diagnostic systems. Science. 1988;240:1285–1293. doi: 10.1126/science.3287615. [DOI] [PubMed] [Google Scholar]
- 27.Taraboletti G, Roberts D, Liotta LA, Giavazzi R. Platelet thrombospondin modulates endothelial cell adhesion, motility, and growth: a potential angiogenesis regulatory factor. J Cell Biol. 1990;111:765–772. doi: 10.1083/jcb.111.2.765. [DOI] [PMC free article] [PubMed] [Google Scholar]
- 28.Varani J, Riser BL, Hughes LA, Carey TE, Fligiel SE, Dixit VM. Characterization of thrombospondin synthesis, secretion and cell surface expression by human tumor cells. Clin Exp Metastasis. 1989;7:265–276. doi: 10.1007/BF01753679. [DOI] [PubMed] [Google Scholar]
- 29.Volpert OV, Lawler J, Bouck NP. A human fibrosarcoma inhibits systemic angiogenesis and the growth of experimental metastases via thrombospondin-1. Proc Natl Acad Sci USA. 1998;95:6343–6348. doi: 10.1073/pnas.95.11.6343. [DOI] [PMC free article] [PubMed] [Google Scholar]
- 30.Wang TN, Qian X, Granick MS, Solomon MP, Rothman VL, Berger DH, Tuszynski GP. Thrombospondin-1 (TSP-1) promotes the invasive properties of human breast cancer. J Surg Res. 1996;63:39–43. doi: 10.1006/jsre.1996.0219. [DOI] [PubMed] [Google Scholar]
- 31.Wong SY, Purdie AT, Han P. Thrombospondin and other possible related matrix proteins in malignant and benign breast disease. An immunohistochemical study. Am J Pathol. 1992;140:1473–1482. [PMC free article] [PubMed] [Google Scholar]
- 32.Yoo KY, Kim Y, Park SK, Kang D. Lifestyle, genetic susceptibility and future trends of breast cancer in Korea. Asian Pac J Cancer Prev. 2006;7:679–682. [PubMed] [Google Scholar]
Associated Data
This section collects any data citations, data availability statements, or supplementary materials included in this article.
Supplementary Materials
Supplemental Data


