

Abstract
The primate facial nucleus is a prominent brainstem structure that is composed of cell bodies giving rise to axons forming the facial nerve. It is musculotopically organized, but we know little about the morphological features of its motor neurons. Using the Lucifer yellow intracellular filling method, we examined 17 morphological parameters of motor neurons innervating the monkey orbicularis oculi (OO) muscle, which plays an important role in eye lid closure and voluntary and emotional facial expressions. All somata were multipolar and remained confined to the intermediate subnucleus, as did the majority of its aspiny dendritic branches. We found a mean maximal cell diameter of 54 μm in the transverse dimension, cell diameter of 60 μm in the rostrocaudal dimension, somal surface area of 17,500 μm2 and somal volume of 55,643 μm3. Eight neurons were used in the analysis of dendritic parameters based upon complete filling of the distal segments of the dendritic tree. We found a mean number of 16 dendritic segments, an average dendritic length of 1,036 μm, diameter of 7 μm, surface area of 12,757 μm2 and total volume of 16,923 μm3. Quantitative analysis of the dendritic branch segments demonstrated that the average number, diameter and volume gradually diminished from proximal to distal segments. A Sholl analysis revealed that the highest number of dendritic intersections occurred 60 μm distal to the somal center with a gradual reduction of intersections occurring distally. These observations advance our understanding of the morphological organization of the primate facial nucleus and provide structural features for comparative studies, interpreting afferent influence on OO function and for designing studies pinpointing structural alterations in OO motor neurons that may accompany disorders affecting facial movement.
Keywords: Blinking, Facial Expression, Cranial Nerves, Pons, Non-human primate
INTRODUCTION
Primate craniofacial muscles, otherwise known as the muscles of facial expression, are unique because they arise from the facial skeleton or subcutaneous aponeurosis, and insert directly into the deep surface of the skin (Huber, 1933; Hollinshead, 1982; Williams, 1989). This organization endows these extraordinary muscles with the capability of exerting their biomechanical influence on the skin and facial orifices. Although the muscles of facial expression occupy widespread anatomical regions, they all receive neural innervation from the seventh cranial nerve (CN VII, or the facial nerve) due to their common embryological origin from the second branchial arch.
Motor neurons contributing to the formation of the facial nerve arise from the facial nucleus. The nucleus is located in the lower ventrolateral pontine region of the brainstem and is musculotopically organized (Papez, 1927; Szentagothai, 1948; Crosby et al., 1963; Friauf and Herbert, 1985; Jenny and Saper, 1987; Satoda et al., 1987; Welt and Abbs, 1990; Morecraft et al., 2001; Sherwood, 2005). In the non-human primate, cell bodies innervating the orbicularis oculi muscle, which is the focus of this report, are localized in the dorsocentral portion of the nucleus, in an anatomical region designated by most authorities as the intermediate subnucleus (Kuypers, 1958; Jenny and Saper, 1987; Porter et al., 1989; Welt and Abbs, 1990; VanderWerf et al., 1998; Morecraft et al., 2001; Gong et al., 2005).
Historically, the paired orbicularis oculi muscles have received significant attention due to their prominent role in emotional expression and social communication, as well as their critical contribution to ocular reflexes (Duchenne, 1862; Darwin, 1872; Yerkes and Yerkes, 1929; Huber, 1931; Ekman and Friesen, 1982; Manning and Evinger, 1986; Evinger et al., 1989; Ekman et al., 1990; Ekman, 2003). In addition, the OO muscle and its affiliated motor neurons have long been integral components of experimental models designed to understand classical conditioning, the functional organization of brainstem sensorimotor networks, and voluntary and emotional facial expression. However, recent efforts have focused on examining the role of the OO in neurological movement disorders affecting eyelid closure. Indeed, OO abnormalities occur in a host of neurological disorders including blepharospasm, hemifacial spasm, Meige syndrome, Parkinson’s disease and Tourette’s syndrome (Basso and Evinger, 1996; Hallett and Daroff, 1996; Smith et al., 1996; Schicatano et al., 1997; Jankovic and Tolosa, 1998; Peshori et al, 2001; Evinger et al., 2002; Hallett, 2002; Holstege, 2002). In many of these diseases there is a cumulative breakdown in the structural organization and functional regulation of the neural circuitry mediating OO function. In response to the growing interest in the roles of the OO, we examined the normal morphological characteristics of OO motor neurons in the facial nucleus of the non-human primate by capitalizing on the application of the post-mortem Lucifer yellow (LY) intracellular filling technique.
EXPERIMENTAL PROCEDURES
The morphological characteristics of lower motor neurons innervating the orbicularis oculi (OO) muscle were examined in four healthy adult monkeys (three male and one female) (Table 1). All protocols were approved by the Institutional Animal Care and Use Committee of The University of South Dakota and were conducted in accordance with the United States Department of Agriculture, National Institutes of Health and The Society for Neuroscience guidelines for the ethical treatment of experimental animals.
Table 1.
Experimental Details
| Animal | Sex | Species | Weight (kg) | Side | Tracer | Muscle Location | Injection sites | Total Amount (ul) |
|---|---|---|---|---|---|---|---|---|
| Case 1 | M | Rhesus | 7 | R,L | FB | Upper and Lower Orbital, Upper Pretarsal | 18 | 36 |
| Case 2 | M | Rhesus | 8 | R,L | FB | Upper and Lower Orbital, Upper Pretarsal | 8 | 20 |
| Case 3 | F | Fascicularis | 4.5 | R,L | FB | Upper and Lateral Orbital | 8 | 20 |
| Case 4 | M | Rhesus | 3.2 | R,L | FB | Upper Orbital | 4 | 25 |
To localize neurons within the facial nucleus innervating the OO muscles, we injected the retrograde neural tracer, fast blue (FB) (Dr. Illing Plastics, Breuberg, Germany) directly into the OO muscles of anesthetized monkeys (Fig. 1). To minimize involvement of the surrounding muscles, which interdigitate with OO fibers, we placed our injections into the orbital portion of the OO muscle located directly over the bony orbital margin of the facial skeleton. In Cases 1 and 2, injections were also made directly into the pretarsal (palpebral) portion within the upper eyelid (Table 1).
Figure 1.
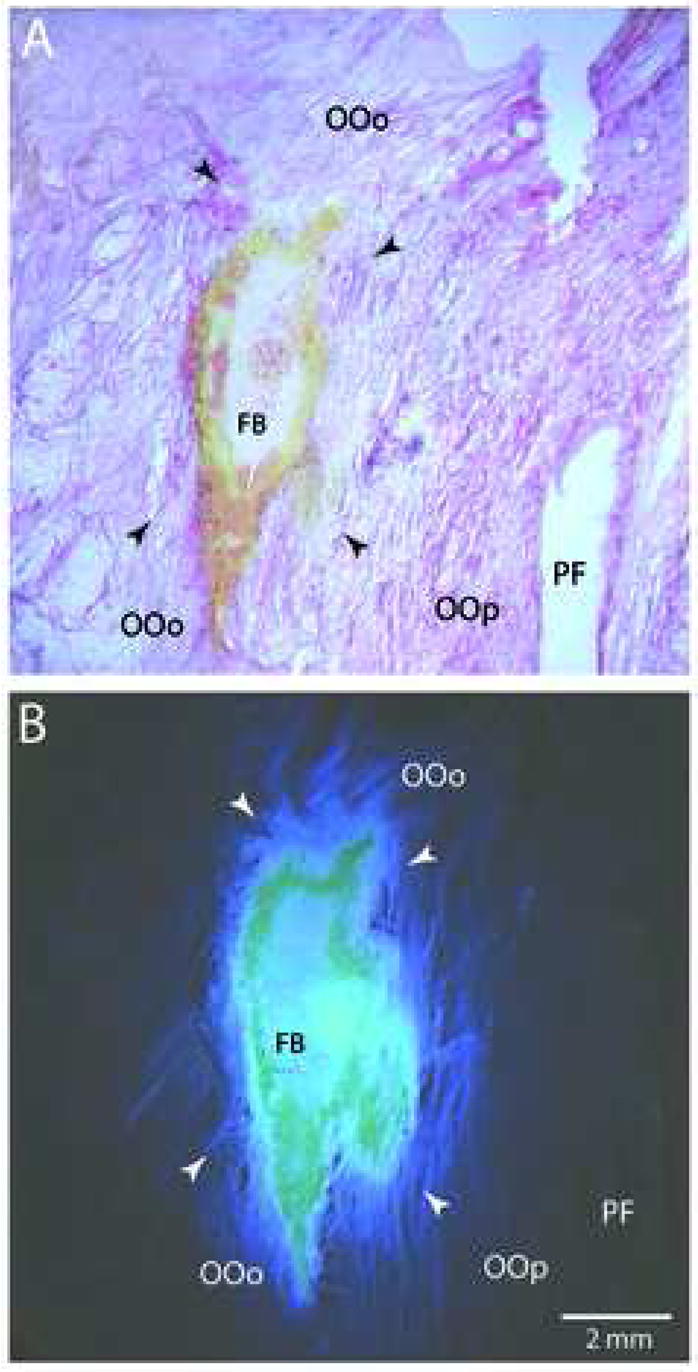
Plate of low-power photomicrographs illustrating examples of Fast Blue (FB) injections into the orbital portion of the orbicularis oculi (OO) muscle. A: Examples of a FB injection site located in the OO muscle in case 1. The tissue was stained using Eosin Y for the histochemical demonstration of the cytoplasm and muscle striations. B: Adjacent tissue section of the injection site prepared for fluorescent visualization and photographed under epifluorescent illumination. Note the localization of the dense core of the FB injectate in the orbital portion of the orbicularis oculi (OOo) directly above the palpebral portion of the OO muscle (OOp). In both panels, arrowheads represent the peripheral extent of the injectate as determined under fluorescent visualization. Micron bar in panel B applies to all photomicrographs. Abbreviations: PF, palpebral fissure.
Following a survival period of 26–32 days to enable neuronal transport of the tracer to the facial nucleus, the monkeys were reanesthetized, perfused transcardially with fixative and the central nervous system and OO muscles were removed. We then filled FB labeled neurons in the facial nucleus with LY in fixed, 250–300 μm thick tissue sections. Infusing each neuron with LY enabled us to visualize the somata and dendritic extensions of OO motor neurons, and to quantify these morphological elements with confocal microscopy. Following confocal microscopy and photographic documentation, the 250–300 μm thick tissue sections were sliced using a cryostat at a thickness of 10 μm and these sections were processed for immunohistochemical localization of LY (and BDA in Case 1) and histochemical localization of Nissl substance for facial nucleus cytoarchitecture. The FB injection sites in the OO muscles were also evaluated using histochemical and fluorescent methods for injectate localization.
Surgery
For surgical preparation, each monkey was injected with atropine sulfate (0.05mg/kg), immobilized with ketamine hydrochloride (10mg/kg) and either anesthetized with an IP injection of sodium pentobarbital or intubated, placed on a mechanical respirator and anesthetized with isoflorane gas (1–1.5%) and a surgical grade oxygen/air mixture. Several injections of a 3–4% solution of FB were placed into the OO muscle (Table 1). This was accomplished by inserting a sterile, one inch, 20 gauge hypodermic needle through the skin and into the orbital portion of the OO muscle, and then passing a 10μl Hamilton microsyringe (Fisher Scientific, Pittsburg, PA, USA) filled with FB through the bore hole of the needle. The use of the hypodermic needle allowed for precise penetration into the OO muscle and prevented potential tissue blockage of the Hamilton microsyringe. Animals were then removed from anesthesia, placed into their home cage and carefully monitored throughout the recovery process.
Tissue Processing
After a survival period of 26–32 days, the animals were injected with atropine sulfate (0.05mg/kg) and immobilized with ketamine hydrochloride (10mg/kg). They then were deeply anesthetized with an overdose of pentobarbital (50mg/kg or more) and perfused transcardially with 0.9% saline, followed by 2 liters of 4% paraformaldyhyde in 0.1 M phosphate buffer (PB). Sucrose was not used during the perfusion to limit the possibility of tissue shrinkage in the brainstem for our cell filling procedure. The brain and brainstem were removed, blocked and photographed for neuroanatomical reconstruction. Subsequently, the cortex was placed into a 30% sucrose solution in 0.1 M PB and the brainstem placed into cold 0.1 M PB buffer (without sucrose) for preparation of vibratome slicing.
The OO muscles and surrounding tissue were removed from the facial skeleton and processed for fluorescent and brightfield microscopy to localize the placement of the neural tracers, and to determine if the tracer had spread into adjacent muscle fibers (Fig. 1). To accomplish this, the muscles were placed in a solution of 20% glycerol and 2% dimethyl sulfoxide in 0.1M PB adjusted to a pH of 7.4. After thorough infiltration of the cryoprotectant, the tissue was flattened and frozen sectioned at 50–75 μm on a sliding microtome (American Optical model AO 860, Buffalo, NY, USA). Even numbered serial sections were placed on subbed slides, stained with Eosin Y, for identification of cytoplasm and muscle striations, and then coverslipped with Permount (Fisher Chemicals, Pittsburg, PA, USA) for microscopic analysis of muscular organization in relation to the location of the injected tract tracer (Fig. 1A, C). Odd numbered serial sections were mounted on subbed slides, and coverslipped using D.P.X. neutral mounting medium (Aldrich Chemical Co. Inc., Milwaukee, WI, USA) for fluorescent microscopic analysis (Fig. 1B, D).
The entire rostral to caudal extent of the pons was blocked from the brainstem and transferred to an oscillating vibratome (Electron Microscopy Sciences, Model OTS-3000-03, Washington, PA, USA). The pons was then cut transversely into 250 or 300 μm thick serial sections, which were transferred to well plates filled with cold 0.1M PB at a pH of 7.4.
The locations of FB labeled neurons within the facial nucleus were then recorded. This was accomplished by placing each thick section into a bath of 0.1M PB solution supported on a microscope slide. The brainstem outline and locations of labeled neurons were then plotted using epiflourescent illumination on an Olympus microscope (BX-51 or BX-60, Leeds Precision Inc., Minneapolis, MN, USA). The microscope was equipped with a computer-controlled MAC 5000 motorized microscope stage (Ludl Electronic Products, Hawthorne, NY, USA) which was electronically coupled to a Neurolucida neuroanatomical data collection and analysis system (Microbrightfield Inc., Colchester, VT, USA) loaded in a Dell 4400 desktop computer.
Intracellular Filling Method
To intracellularly fill the FB labeled neurons, borosilicate glass micropipettes (10 cm length, 0.2 mm O.D., 0.69 mm I.D.; Sutter Instrument Co., Novato CA, USA) were pulled using a micro pipette puller (Stoelting, Model APP-1, Wood Dale IL, USA) to produce a tip diameter that ranged between 1–1.5 μm. The micropipettes were then filled with 0.9% saline solution with 4% LY. To inject individual FB labeled cells, each 250 or 300 μm section was placed on a glass slide and fully immersed in a 0.1M PB bath to maintain tissue integrity. FB labeled neurons located within the tissue section, but away from either cut surface were filled with LY. The LY filled micropipette was slowly inserted into the FB labeled cell body using the microdrive system (Narashige M0-150 micromanipulator, Setagaya-Ku, Japan) with the assistance of the 20X long working distance microscope objective (Nikon Plan Apo 20/0.40 ELWD, Japan). Using the current source (Stoelting, Model 51413), approximately 0.05–0.5 μA was delivered through the micropipette and into the tracer using alternating current. Each individual FB labeled cell was subsequently filled with LY until the dendritic arbors were fully visible (Fig. 2). After filling each cell with LY, the tissue section was turned over and FB labeled cells on the opposite side of the tissue section were also filled with LY in the same manner.
Figure 2.

Epifluorescent photographs demonstrating representative examples of Lucifer yellow filled orbicularis oculi motor neurons in the facial nucleus from all four experimental cases. The peripheral border of the intermediate subnucleus of the facial nucleus is illustrated in panels A, B, E and F (see white dashed line). The border was determined using thionin stain for histochemical identification of Nissl substance following confocal microscopic scanning of each filled neuron (see Materials and Methods). In A, C and E, visible axons are identified by the white arrowheads. Note that each intracellularly filled neuron is located within the nuclear boundaries of the intermediate subnucleus.
The individual brainstem slices were then placed into a 4% paraformaldyhyde solution overnight before being transferred into graded solutions of glycerol for clearing. Finally, each tissue section was placed on a microscope slide, coated with glycerol and temporarily sealed with cover glass (Brain Research Laboratories, Waban, MA, USA) for confocal laser scanning microscopy. This enabled us to remove the cover glass after scanning the LY filled cells at the top of the section, flip the tissue and scan the filled cells on the opposite side.
Confocal Imaging and Data Analysis
Each filled neuron was imaged on an Olympus BX61 confocal laser scanning microscope (CLSM) (Leeds Precision Inc., Minneapolis MN, USA) which was operated by digital acquisition software (Fluoview FV500, version 3.3, Leeds Precision Inc., Minneapolis, MN, USA) from a Dell 4400 desktop computer. The filled OO motoneurons were located using a low power (4x or 10x) objective lens, then a series of laser scans of each individual filled neuron was taken throughout the depth of the tissue using a 20x objective lens. Neurons filled with LY were scanned with the Argon laser at an excitation wavelength of 488 nm and emission wavelength of 505 nm. Each cell was scanned from the top edge of LY labeling to the bottom edge at 2–3 μm intervals, thus creating a Z stack.
Using the Neurolucida 3-D confocal software package (Microbrightfield Inc., Colchester, VT, USA), the Z stacks were examined on a high resolution computer screen and individual contours were traced by one of us (J. G.) around the LY filled soma and each filled dendrite (Fig. 3). Automatic neuron tracing methods were not employed in our analysis. Cells were selected for analysis based upon the presence of a clear distinction between the LY illuminated soma membrane and non-fluorescing background of the supporting neuropil, and the presence of sharply defined, LY-filled tertiary dendrites. Dendrites were defined by a gradual narrowing from their emergence on the soma toward their distal segments, and in most circumstances the presence of dendritic branches.
Figure 3.
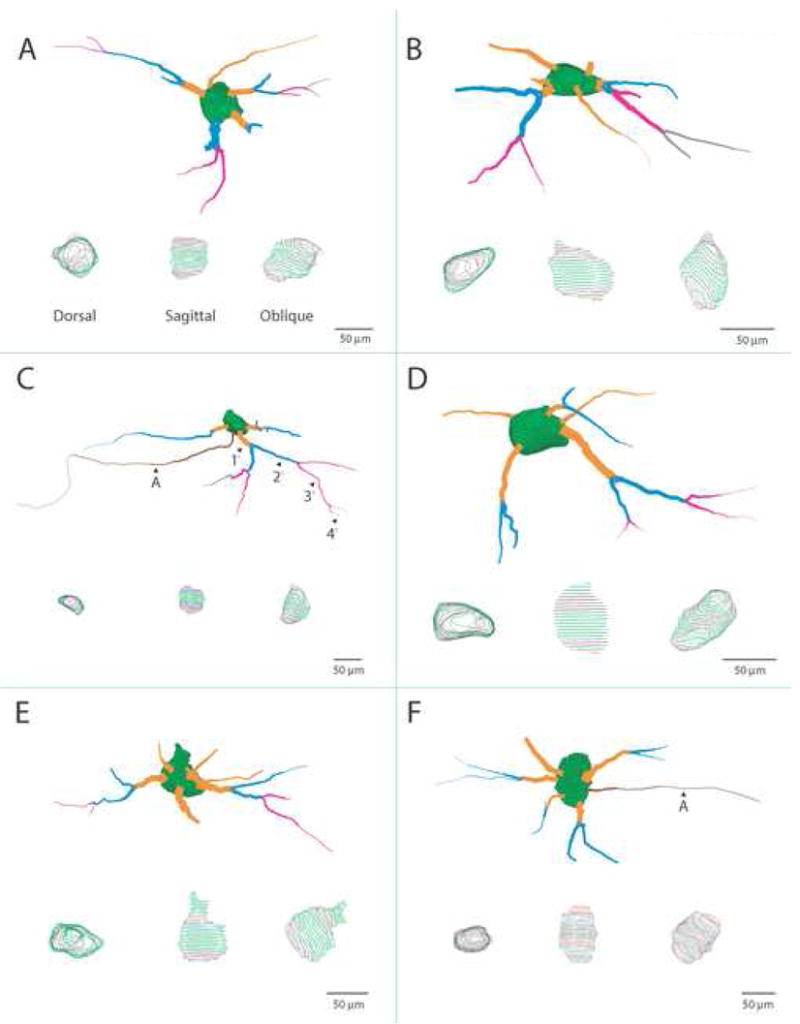
Scale illustrations of selected Lucifer Yellow (LY) filled OO motor neurons that were reconstructed using Neuroexplorer software and confocal scans. Each cell has been rotated to display the optimal view of dendritic arborization. At the bottom of each panel are dorsal, sagittal and oblique views of the soma showing only the mapped contour lines. Each cell body is characterized by an irregular ovoid shape with several large primary dendritic segments emanating in a multipolar manner. The primary (orange), secondary (blue), tertiary (magenta) and quaternary (gray) dendritic segments are color coded for identification (see panel C). Occasionally, the dendritic field of these neurons would polarize toward one side of the cell body (i.e., panels B, C and D) which was a characteristic displayed by many neurons located near the periphery of the intermediate subnucleus (see also Fig. 2A, B, E and F). In panels C and F, the axon is demarcated by a black arrowhead and the letter A.
The data files were then loaded into the Neuroexplorer 3-D analysis software program (Microbrightfield Inc., Colchester VT, USA) and each individual neuron was then quantitatively analyzed for mean maximal somal diameter (in both the transverse and rostrocaudal dimensions), somal area, somal volume, number of dendritic segments, total dendritic length, total dendritic diameter, total dendritic surface area and total dendritic volume. From our neuron reconstructions, a total of 54 OO motor neurons were selected for quantitative analysis of somal parameters (filled neurons: Case 1 = 20; Case 2 = 10; Case 3 = 19; Case 4 = 5). Eight of these LY filled cells, which had well defined and complete dendritic trees, were included in our dendritic analysis (filled neurons: Case 1 = 4; Case 2 = 1; Case 3 = 3). In this analysis, there was the occasional presence of artifactually truncated dendrites (due to our sectioning techniques). Although this analysis does not reflect the complete natural dendritic profile of the cell, this information forms a reliable measure within the limitations of the applied technique (Burman et al., 2000) and provides considerable insight into the general morphology of the neuron as a whole.
For calculation of the transverse somal diameter, somal area and somal volume, the software employed the feret maximum measurement tool in Neuroexplorer. The feret maximum makes use of a virtual caliper to identify the longest distance across each drawn contour in the transverse dimension. Each reconstructed soma consisted of numerous contours along the entire Z stack (Fig. 3- see dorsal, sagittal and oblique views of each cell) and each contour in turn, was assigned a feret maximum. For the transverse diameter, we selected the largest feret maximum value for each neuron and used this value as the representative transverse somal diameter in our analysis. For the maximal somal diameter in the rostrocaudal dimension, we calculated the distance across the filled neuron in the rostrocaudal dimension from the combined Z stack for each cell. This was accomplished by calculating the distance in microns between the tip of the rostral pole of the somal surface (i.e., first somal contour encountered at the top of each Z stack) to the tip of the caudal pole of the somal surface (i.e., last somal contour encountered at the bottom of each Z stack).
Additionally, for the eight best filled cells, an in-depth analysis was conducted on the segmental dendritic branches. This included the number of dendrites per segment and the average length, diameter, surface area, and volume for each segment. A Sholl analysis was also performed on the data using the Neuroexplorer software to determine the location of the maximal dendritic branching in relation the somal center. Specifically, this analysis uses the center of the cell body as the initial reference point and places concentric circles at 10 μm intervals radiating out from the reference point. The total number of dendritic intersections at each concentric circle was then determined for each LY filled neuron. For each monkey, a mean value of intersections was calculated for each concentric radius and plotted to determine the spatial location containing the highest number of intersections. A mean value was also calculated for all of the Cases.
In 28 of the 54 LY filled cells (i.e., 52%), we were able to localize an axonal process. These processes were defined as axons if they were small in diameter (les than 4μm), tapered very little throughout their peripheral course and did not give rise to branches (Figs. 2A, C, E; 3C, F) (Faulkner et al., 1997). For each axon, we analyzed the base (i.e., proximal) diameter, which was defined as the largest diameter located immediately adjacent to the cell soma. The average axon diameter was calculated by determining the average axon diameter from all of the individual confocal Z-stack files containing the identified axon.
Data for the all the morphological parameters were then entered into Graphpad InStat 3 software (GraphPad Software Inc., San Diego CA, USA) to produce quantitative analysis. Values were expressed as a mean ± standard error of the mean (SEM). Because one case was a different species of monkey, we performed a one-way ANOVA on the soma characteristics to determine if there were any cross-species differences. However, we did not perform any statistical tests on the dendritic parameters as only 8 neurons were used and this precluded any statistical tests from being performed. Corresponding graphs were then created using the Graphpad Prism program (GraphPad Software Inc., San Diego CA, USA). Contour drawings of the LY filled neurons were imported from the Neuroexplorer software into Adobe Illustrator 10.0 (Adobe Systems, San Jose CA, USA) for publication quality figures. Photomicrographic images of the LY filled cells also were obtained using a Spot Flex 64 mega pixel digital camera (Diagnostic Instruments, Inc., Sterling Heights, MI, USA) mounted onto an Olympus BX52 microscope. Representative publication quality images were selected and assembled into photographic plates using Adobe Photoshop 7.0 (Adobe Systems, San Jose CA, USA). Contrast and brightness were the only variables adjusted to achieve final versions of the microscopically captured data.
Post-Confocal Immunohistochemical and Cytoarchitectonic Analysis
Following tissue plotting, confocal scanning and photographic documentation, all 54 of the filled motor neurons were processed for cytoarchitectural organization of the facial nucleus and immunohistochemical localization of LY. To accomplish this, the coverslip was removed and the 250–300 μm glycerol embedded tissue sections were rinsed in 0.1M PB and frozen sectioned on a cryostat microtome (Leica, Model CM 1850, Germany) at a thickness of 10 μm. The first 10 μm tissue section was processed for Nissl substance by staining with Thionin (Morecraft and Van Hoesen, 1992; Morecraft et al., 1992; Morecraft et al., 2004) and the second section for LY using standard immunohistochemical procedures (Morecraft et al., 2001; Morecraft et al., 2002). This sequence was repeated for all of the available tissue sections obtained from each 250 μm–300 μm block. For immunohistochemical visualization of LY, the tissue sections were placed into 5% normal goat serum overnight, rinsed in tris-buffered saline (TBS), then placed into an avidin blocking reagent (Vector laboratories, Burlingame CA, USA) for 15 minutes. Next, the tissue was rinsed in TBS then incubated in a biotin blocking reagent (Vector laboratories, Burlingame CA, USA) for 15 minutes. Following subsequent PB rinses, the tissue was incubated in a polyclonal rabbit IgG fraction biotinylated anti-lucifer yellow antibody at a concentration of 1:1000 (Invitrogen, Carlsbad CA, USA) overnight. This antibody was not tested for any cross species reactivity and was only tested for recognition of the LY molecule by Invitrogen. Subsequently, the tissue sections were rinsed and incubated in a solution of avidin-biotin peroxidase complex (Vector Laboratories, Burlingame CA, USA). Finally, LY was converted to either a black or blue reaction product using the respective Vectastain SG kits (Vector laboratories, Burlingame CA, USA
The locations of the immunohistochemically localized LY labeled somata and dendrites were plotted in each immuno-reacted tissue section using bright-field illumination on an Olympus microscope (BX-51 or BX-60, Leeds Precision, Minneapolis, MN, USA) with a computer-controlled MAC 5000 motorized microscope stage (Ludl Electronic Products, Hawthorne, NY, USA) joined to a Neurolucida neuroanatomical data collection and analysis system, (Microbrightfield Inc., Colchester, VT, USA). With the same data collection system the adjacent Nissl stained tissue sections were charted by outlining the peripheral border of the facial nucleus and the respective subnuclei (i.e. intermediate, dorsalmedial, medial and lateral subnuclei) according to the criteria of Jenny and Saper (1987). The electronic files containing the charted LY profiles and the files containing the cytoarchitectonic boundaries were merged using the NeuroLucida software to determine the location of the LY labeled somata and dendritic fields in direct relation to the structural boundaries of the facial nucleus.
RESULTS
Intramuscular injections of FB placed into the orbicularis oculi were found to be well localized, with minimal spread confined to the circular muscle fibers surrounding the orbital rim and palpebral fibers (Fig. 1). All cases resulted in a moderate number of labeled neurons that were located exclusively within the intermediate subnucleus of the facial nucleus (Fig. 2A, B, E, and F). The lack of tracer involving the frontalis muscle was confirmed by our microscopic analysis of each injection site and the absence of labeled neurons in the dorsomedial subnucleus. The alignment of labeled neurons in the rostral to caudal dimension formed a longitudinal column that spanned the upper 4/5ths of the facial nucleus (i.e., approximately 1.7–1.9 mm). Descriptively, the OO motor neurons were characterized by oval somata (Fig. 2, 3- see sagittal views) with radiating aspiny dendrites, which diminished in thickness from their proximal to distal regions.
Somal Measurements
The average somal diameter in the transverse dimension (i.e., the plane of tissue sectioning) is given in Table 2. For all 54 facial nucleus neurons filled with LY, we calculated a mean somal diameter of 54.3 μm (± 0.9 SEM). Variability among the neuron diameters was low, as evidenced by the low standard error amongst the four cases. This was also underscored by the small range in diameter (49.9 μm to 58.4 μm) in all 54 cells analyzed. No statistically significant difference was found between the cases with respect to transverse neuronal diameter (F(3, 50) = 2.143: P= 0.1065, DF = 53).
Table 2.
Somal Parameters (values are mean +/− SEM)
| Transverse Diameter (μm) | Coronal Diameter (μm) | Area (μm2) | Volume (μm3) | |
|---|---|---|---|---|
| Case 1 | 53.6 (+/− 1.5) | 59.3 (+/− 2.2) | 18,0891.2 (+/− 1,029.9) | 53,512.1 (+/− 3,076.5) |
| Case 2 | 58.4 (+/− 2.6) | 57.0 (+/− 2.1) | 18,005.7 (+/− 2,030.4) | 57,098.7 (+/− 5,304.3) |
| Case 3 | 54.2 (+/− 1.0) | 61.5 (+/− 3.0) | 16,394.5 (+/− 1,050.9) | 57,345.7 (+/− 5,120.7) |
| Case 4 | 49.9 (+/− 2.9) | 61.0 (+/− 1.6) | 18,327.3 (+/− 2,116.5) | 54,782.5 (+/− 6,367.6) |
| Overall | 54.3 (+/− 0.9) | 59.5 (+/− 1.3) | 17,500.3 (+/− 668.1) | 55,642.7 (+/− 2,370.2) |
| Range | (49.9–58.4) | (38.2–78.2) | (16,394.5–18,327.3) | (53,512.1–57,345.7) |
In addition to the maximal somal diameter in the transverse dimension, we calculated the distance across the filled neuron in the rostrocaudal dimension. The average somal diameter in the rostrocaudal dimension is also given in Table 2. For all 54 facial nucleus neurons, the mean somal diameter in the rostrocaudal dimension was 59.5 μm (± 1.3 SEM). Variability among the neuron diameters was again low, as evidenced by the low standard error, although the range was wider (i.e., 38.2 μm to 78.2 μm) (Fig. 4A). No statistically significant difference was found between the cases with respect to the rostrocaudal neuronal diameter (F(3, 50) = .3815: P = 0.8213, DF = 53).
Figure 4.
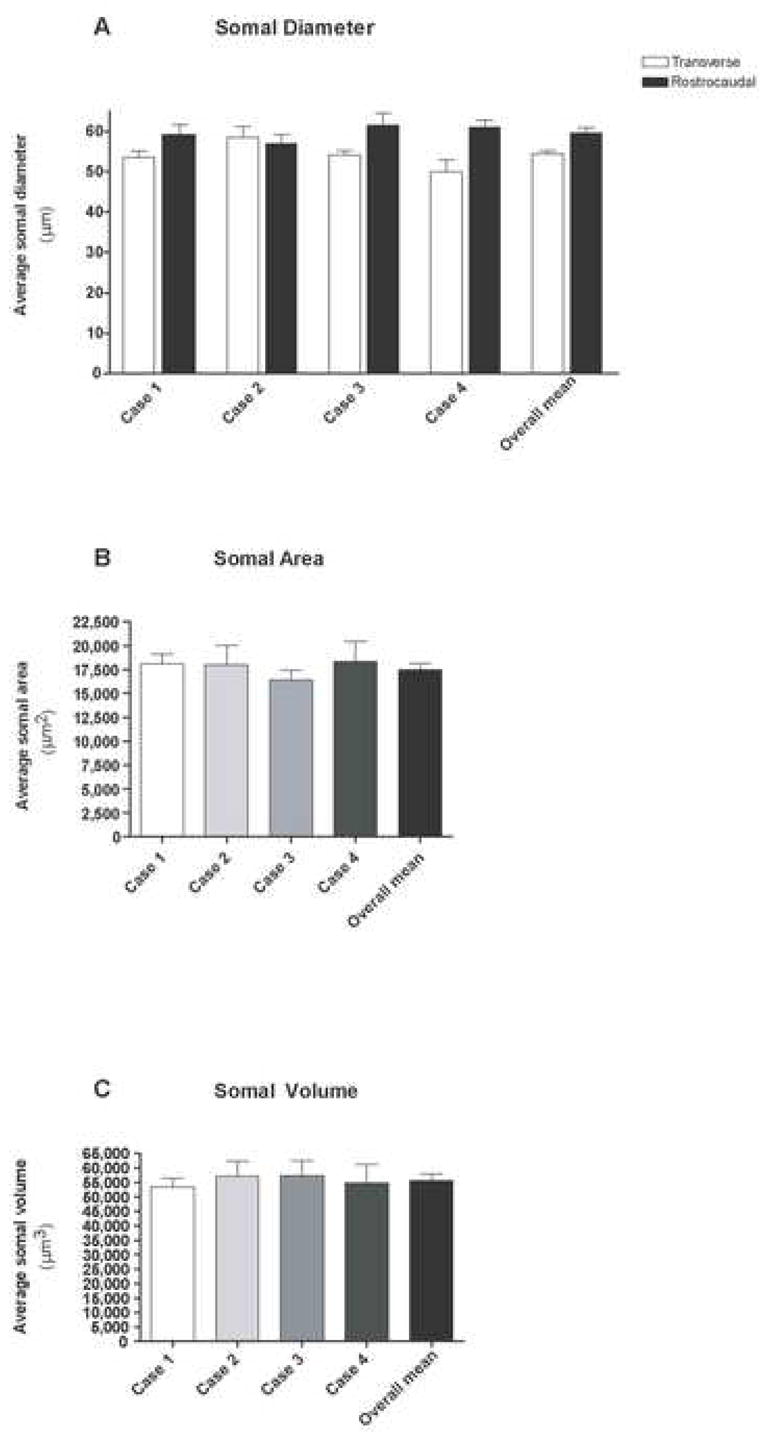
Quantitative analysis of the somal diameter (A), somal area (B) and somal volume (C) obtained from the analysis of 54 filled OO motor neurons. Illustrated in each graph are the mean values determined for each Case and a corresponding overall mean for all cases. Error bars represent the SEM.
As shown in Table 2, the overall mean somal area for all four cases was 17,500.30 μm2 (± 668.1 SEM) for all 54 cells. Somal areas ranged from 16,394.5 to 18,327.3 μm2 (Fig. 4B). Statistical analysis of the means for somal area between the four cases yielded no significant differences (F(3, 50) = 0.4859: P = 0.6936, DF = 53).
The mean somal volume, considering all 54 cell fills (Table 2), was found to be to be 55,642.7 μm3 (± 2,370.2 μm3 SEM) (Fig. 4C). We also found a low level of variability in somal volumes, as evidenced by the small standard error, as well as the small range of values for somal volumes (53,512.1 μm3 to 57,345.7 μm3). No statistically significant difference was found between the cases with respect to somal diameter (F(3, 50) = 0.1789: P = 0.9102, DF = 53).
Dendritic Measurements
For analysis of the dendritic parameters, the 8 best filled neurons were selected (see Methods). All filled dendrites were aspiny (Fig. 2B–D). The mean number of dendritic segments was found to be 16.7 (± 1.1 SEM) for all four cases, with a range of 12 to 20 dendritic segments (Fig. 5).
Figure 5.
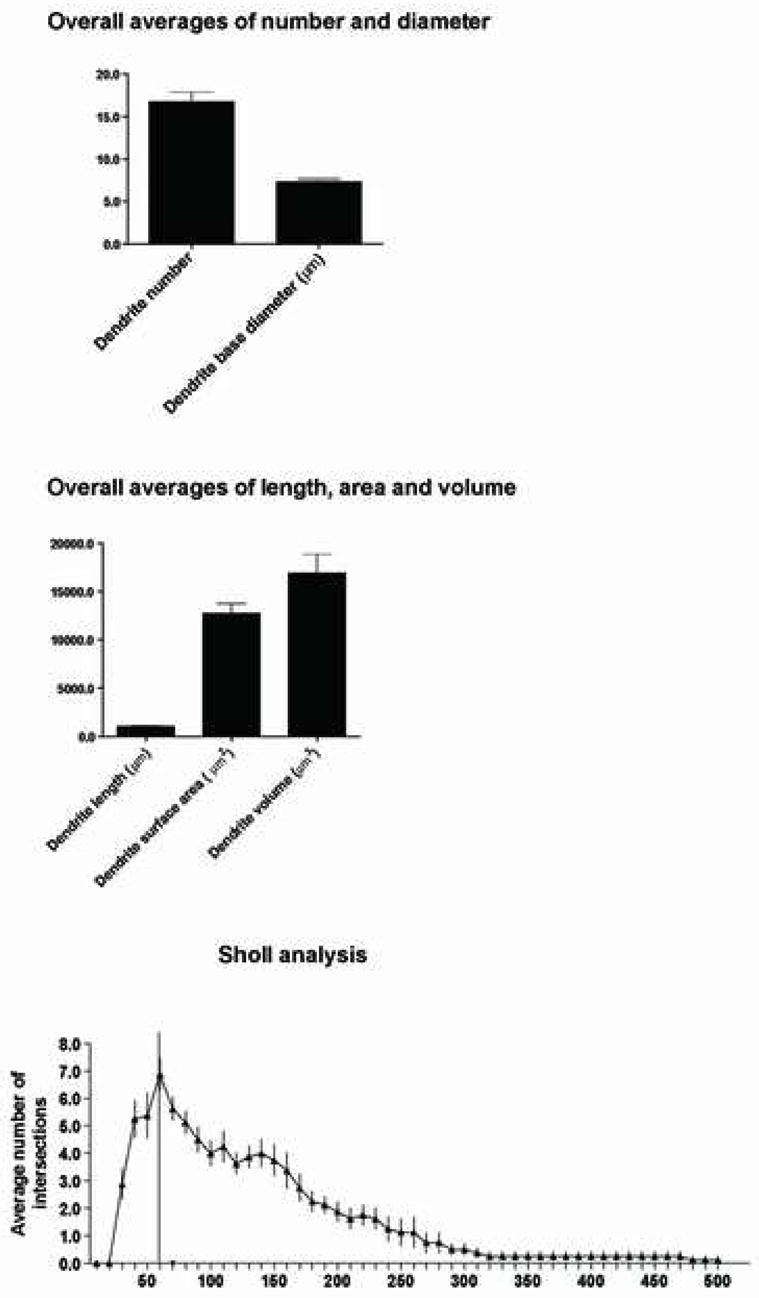
Quantitative analysis depicting the mean values of the dendritic segment number and diameter (top), dendritic length, area and volume (middle), and the Sholl analysis (bottom) obtained from the evaluation of the 8 best-filled OO motor neurons. Error bars represent the SEM.
The total dendritic length, mean diameter, area and volume were determined for this population. The total dendritic length calculated refers to the total length of all dendritic segments of all the non-truncated dendritic trees arising from a single filled neuron. We found the mean dendritic length of all 8 neurons to be 1,036.1 μm (± 67.7 SEM) (Fig. 5). Relatively high levels of variability were found when dendrite number was compared, as evidenced by the standard error, as well the range (715.9–1,224.0 μm) of values. Additionally, the average diameter for all dendritic segments combined (i.e., primary, secondary, tertiary, quaternary) were analyzed. The overall average dendrite diameter was calculated to be 7.3 μm (± 0.3 SEM) with a range of 2.5–18.0 μm. We found a mean dendrite surface area of 12,757.7 μm2 (± 1,011.3 SEM). The range of values for all four Cases was 8,956.2 to 17, 891.0 μm2 (Fig. 5). We found a mean dendritic volume of 16,923.3 μm3 (± 1,946.8 SEM). The range of values of the dendritic volume for all four cases was 11,120.0 to 26,868.0 μm3 (Fig. 5). This finding, combined with a wide range of diameter values and a subjective observation of a gradual tapering in dendritic diameter in drawings of filled motor neurons (Fig. 3), led us to examine these same dendritic parameters based on segmental distribution (i.e., primary, secondary, tertiary and quaternary dendritic segments).
Segmental Dendritic Analysis
In addition to analyzing the overall morphological characteristics of dendritic arborization, we analyzed the total number of dendrites, dendrite length, average dendrite diameter, average dendrite surface area and average dendrite volume of the primary (1°), secondary (2°), tertiary (3°) and quaternary (4°) segments (Fig. 6). For all 8 neurons analyzed, we found the mean number of dendrites for 1°, 2°, 3° and 4° segments to be 5.50 (±0.6 SEM), 5.7 (± 0.5 SEM), 4.0 (± 0.3 SEM) and 2.4 (± 0.4 SEM) respectively (Fig. 6). This data indicated that the highest number of dendrites were associated with the 1° and 2° segments. Consistent with this result was our analysis of the dendritic length, which showed that on average, the longest dendritic segment was associated with the secondary dendritic domain (Fig. 6). For example, the mean length for the 1°, 2°, 3° and 4° segments were 237.0 μm (± 63.0 SEM), 385.0 μm (± 31.8 SEM), 341.4 μm (± 68.0 SEM), and 162.6 μm (± 61.8 SEM) respectively. Further analysis of the diameter of these segments at the bifurcation node revealed that the 1°, 2°, 3° and 4° segments had a mean diameter of 9.3 μm (± 0.47 SEM), 8.4 μm (± 0.49 SEM), 4.60 μm (± 0.29 SEM), and 3.6 μm (± 0.25 SEM) respectively (Fig. 6). The mean surface area for the 1°, 2°, 3° and 4° segments were 4,414.7 μm2 (± 925.3 SEM), 5,079.8 μm2 (± 679.2 SEM), 2,943.3 μm2 (± 675.8 SEM), and 1,036.1 μm2 (± 387.1 SEM) respectively (Fig. 6). Additionally, the individual volumes of the 1°, 2°, 3° and 4° segments was calculated to be 7,639.0 μm3 (± 1,283.5 SEM), 6,893.3 μm3 (± 1,581.7 SEM), 2,356.5 μm3 (± 592.6 SEM), and 604.5 μm3 (± 225.4 SEM) respectively (Fig. 6).
Figure 6.
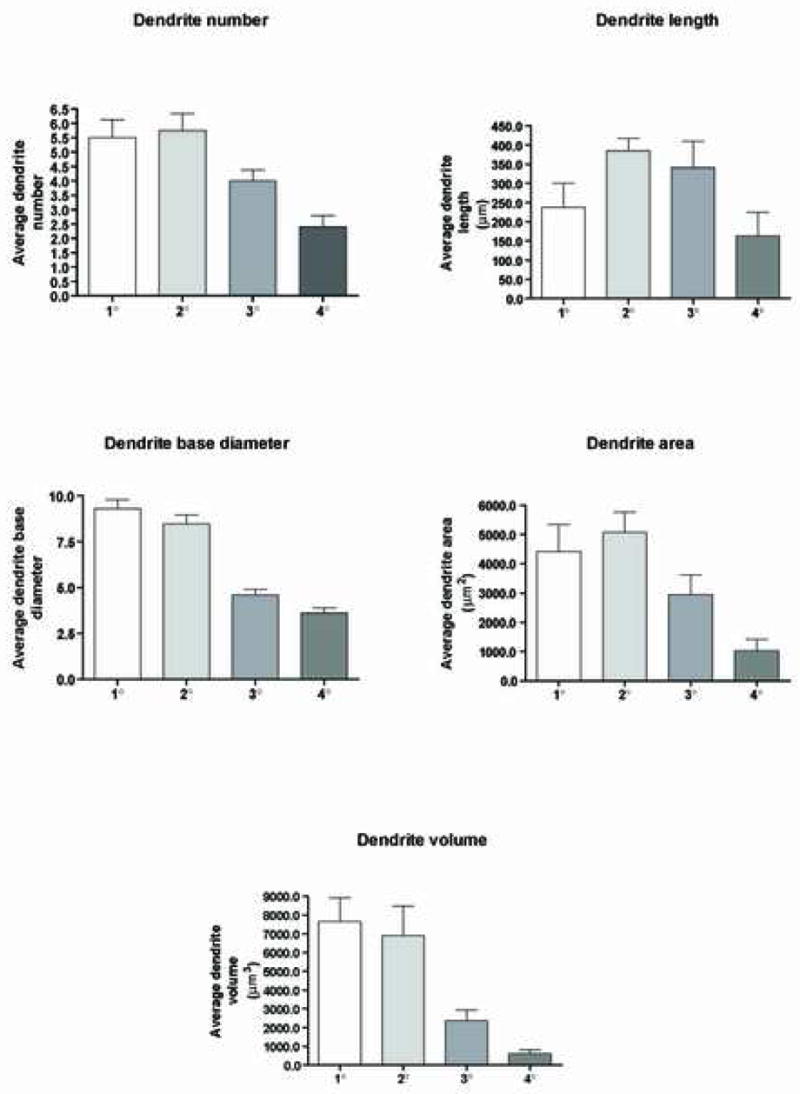
Segmental quantitative analysis of the dendritic number, length, diameter, surface area and volume obtained from the evaluation of the 8 best-filled OO motor neurons. Illustrated in each graph are the average values determined for the primary, secondary, tertiary and quaternary domains. Error bars represent the SEM.
Sholl Analysis
To further analyze the dendritic arborization of these 8 neurons, we employed a Sholl analysis. We found the highest coincidence of intersections occurring approximately 35 to 170 μm away from the somal center (Fig. 5). Within this range, the peak number of intersections was found at the 60 μm interval. Distal to this location, the number of intersections gradually decreased and the SEM increased, indicating a progressively diminished number of dendrite segments.
Axonal Diameter
Axonal analysis demonstrated an average base diameter (i.e., the initial branch point from the soma) of 5.6 μm (± 0.3 SEM) with a range of 3.4 μm to 9.4 μm (Fig. 7). We also found an average overall diameter of the axons to be 2.3 μm with a small range of 1.6 μm to 3.7 μm (Fig. 7). These findings suggested that the presumed axon rapidly narrows to achieve a relatively consistent diameter once it emerges from the somal surface.
Figure 7.
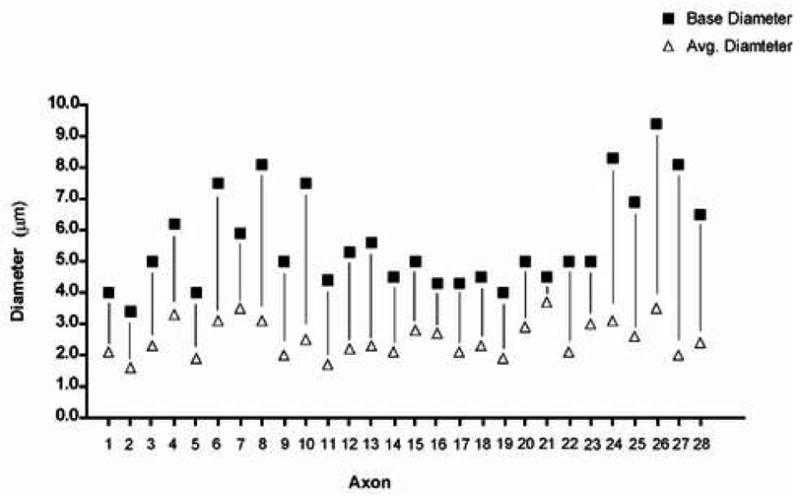
Results of the quantitative analysis of 28 axons identified in 28 filled cells. Each base diameter is paired with its respective overall average diameter by a vertical black line.
Immunohistochemical Localization of OO Somal and Dendritic Branches
All 54 filled cells were processed for immunohistochemical visualization of LY and analyzed for subnuclear localization of the filled somata and dendritic processes. Examination of alternating Nissl and LY stained tissue sections indicated that the somata of OO motor neurons were confined to the dorsal central region of the facial nucleus, corresponding to the intermediate subnucleus. We found no evidence of labeled dendritic branches located outside the peripheral boundary of the facial nucleus. Occasionally dendritic branches would pass toward the edge of the intermediate subnucleus but would arch to assume a trajectory parallel to the outer border of the facial nucleus (Figs. 2A, B, E, F, 8B). The densest distribution of labeled dendritic processes was found within the confines of the intermediate subnucleus, (Fig. 8A). Occasionally, a few distal dendritic processes of small diameter were found in the territory of the dorsomedial, medial and lateral subnuclei (Fig. 8B). Of these, the lateral subnucleus appeared to contain the majority of these distal dendrites.
Figure 8.
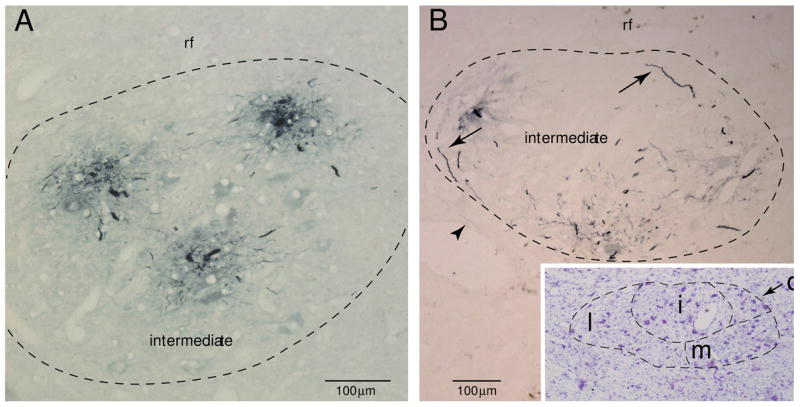
Plate of photomicrographs demonstrating immunohistochemical localization of Lucifer yellow (LY) filled OO motor neurons (stained blue). A: Immunohistochemically localized dendritic branches from 3 filled OO motor neurons in Case 2. In this section, all visible dendritic processes are confined to the intermediate subnucleus. B: LY filled dendrites within the intermediate subnucleus in Case 1. Dendrites located at the periphery of the subnucleus (see arrows) commonly arched to follow the curvature of the boundary. The arrowhead identifies a rare distal dendritic segment within the lateral subnucleus. The inset shows the adjacent tissue section stained with thionin for Nissl substance which aided in defining the external boundary of the facial nucleus and the lateral (l), medial (m), intermediate (i) and dorsomedial (d) subnuclei
DISCUSSION
The complex nature of facial expression and the frequent compromise of its control in neurological disorders dictate the need for more detailed structural correlates of the neural systems regulating this behavior. Motor neurons located in the facial nucleus hold a position of central importance as they express the summative effect of central nervous system processes mediating facial expression and reveal important diagnostic information, which in part, reflects an individual’s physical, mental and general behavioral status. In Results, we presented the results of 17 structural parameters characterizing OO motor neurons in the non-human primate facial nucleus, and determined that OO motor neurons display morphological characteristics that were found to be consistent across all of the cells analyzed. Our results also confirm a number of previous observations regarding the fundamental structural organization of the primate facial nucleus. Our study confirms that the somata of OO motorneurons reside in a restricted location of the facial nucleus that corresponds to the intermediate subnucleus (Fig. 2) and the observation that these neurons collectively form a longitudinal column in the rostrocaudal dimension, (Jenny and Saper, 1987; Porter et al., 1989; Welt and Abbs, 1990; Morecraft et al., 2001). We also found OO motor neurons to be multipolar and aspiny (Figs. 2, 3) and to occupy most of the facial nucleus in the rostrocaudal dimension with the exception of the inferior pole, as has been previously observed (Jenny and Saper, 1987; Welt and Abbs, 1990; Faulkner et al., 1997; VanderWerf et al., 1998; Morecraft et al., 2001).
In this study, we attempted to characterize several morphological features of OO motor neurons using the post mortem intracellular filling technique. In our estimation, our parametric analysis is likely to be reflective of a typical macaque OO somal profile since this data was consistently characterized by relatively small ranges in values and low standard error of the means (Table 2). Similarly, our analysis of the number of 1° and 2° dendrites is probably reflective of a typical macaque OO motor neuron. However, our parametric analysis of the average dendritic length, area and volume and Sholl analysis is limited due to technical constraints of the post mortem LY filling method, which include artificially truncated dendrites that run perpendicular to the plane of sectioning and the likelihood of some incompletely filled dendrites in the horizontal plane. Although this analysis does not reflect the complete natural dendritic profile of the cell, this information forms a reasonable measure that is reflective of the general trend of these individual parameters, such as diameter tapering from proximal to distal segments. Our material has utility for drawing comparisons with other animal models, particularly because in vivo methods are unlikely to be practical in higher-order primates.
Quantitative Analysis of Somal Features
We found the average maximal diameter of OO neurons in the transverse dimension to be 54 μm with a small range in diameter (50 μm to 58 μm) in all 54 cells analyzed (Fig. 4A). Interestingly, we found no statistical differences between the rhesus and fascicularis monkeys for any of the somal parameters. Contrary to these findings are the observations of Welt and Abbs (1990) who evaluated 104 horseradish peroxidase (HRP) labeled orbital neurons in the Macaca fasicularis and found a mean somal diameter of 24 μm accompanied by a range of values spanning approximately 15 μm to 38 μm in diameter. We suspect that these differences could be due to a number of experimental factors. First, Welt and Abbs’ approach to evaluating cell diameter would have likely included somal diameters that were not located at the widest region of the neuron since they sampled cell diameters at uniformly spaced tissue section intervals. In contrast, we used the feret maximum measurement to localize the widest diameter of each three dimensionally reconstructed cell, and used this value to determine the average transverse diameter of all cells. We sense that this measurement provides a more consistent and reliable value that can be applied in future studies to examine potential somal alterations that may occur in non-human primate disease models, as well as providing a more reliable measurement for comparative neuroanatomical studies. The two studies also employed different fixatives, which could produce shrinkage differences. More importantly than the issue of fixation however, several studies have recognized the significant effect of sucrose cryoprotection (Rosene et al., 1986) and histochemical processing (Andersen and Gundersen, 1999) on tissue shrinkage. The HRP procedure employed by Welt and Abbs subjected their tissue samples to both shrinkage factors, whereas the fluorescent procedure used in our study avoided both factors. Finally, it has been shown that the glycerol used in our study, unlike conventional ethanol dehydration, has little to no effect on tissue shrinkage (Rosene et al., 1986). Our observations further extend our knowledge of OO somal properties by determining an average rostrocaudal diameter of approximately 60 μm, which indicates they have slightly elongated or conically shaped somata. Our observations from the 3-D reconstructions supported this, as we found many neurons tapering in diameter at polarized regions of the somal profile (Fig. 3).
We are aware of one other study which examined some morphological features of OO neurons in the non-human primate (Macaca mulatta), but the emphasis of that report was placed on investigating the proportion of intermediate subnucleus cells innervating the orbital, upper pretarsal and lower pretarsal subdivisions of the muscle, as well as examining the diameters of neurons innervating the upper and lower pretarsal portions of the OO muscle (VanderWerf et al., 1998). In that particular study, VanderWerf and colleagues used the same method of fixation as we employed, but found a wide range of pretarsal cell diameters (20 μm–60 μm) with the largest number of cells having a diameter in the 40 μm to 50 μm range. This would again be smaller than the average diameter found in our study, but more in line with our observations than those of Welt and Abbs (1990). This discrepancy may again be due to the methodologies applied to calculate the average diameter. For example, the diameter used to in our study represented the single largest maximal distance across the neuron in a complete three dimensional confocal z scan spaced 2–3 μm apart through an individually isolated OO motor neurons. In contrast, VanderWerf and colleagues sampled every 100 μm interval through the facial nucleus in 25 μm thick tissue sections. Thus, the potential analysis of diameters across tapered regions of the motor neurons could account for the smaller values reported in the VanderWerf study.
From a comparative perspective it has been reported that the average somal diameter in the rodent is 27.6 μm (Faulkner et al., 1997). In contrast, the average somal diameter of cat OO neurons has been found to be 55 μm in one study (Shaw and Baker, 1985) and 45 μm in a more recent effort (Yoo et al., 2005). These comparative observations and those obtained in our study suggest that the somata of OO motor neurons in the macaque is on average, larger than OO neurons in the rodent, but similar in diameter to the feline model. In fact, it is possible that feline OO motor neurons are even larger on average, since Shaw and Baker (1985) calculated the average diameter of each cell as an average of the longest and shortest dimensions across the entire soma.
In terms of average somatic area in the rodent model, Faulkner and colleagues (Faulkner et al., 1997) found the average somatic area to be 794 μm2 (± 26 μm2 SEM) with a range of 317–1500 μm2. In comparison, we found a relatively consistent average somal area for macaque OO motor neurons, which was 17,500 μm2 (± 668.12SEM), and a small range of values that spanned an interval between 16,394 to 18,327 μm2 in all 4 Cases. These observations would again support the suggestion that the somata of non-human primate OO motor neurons are larger than the somata of rodent OO motor neurons. However, some of this difference may be attributable to tissue shrinkage (Rosene et al., 1986) of the rodent material since Faulkner and colleagues used sucrose in their tissue preparation procedure.
Quantitative Analysis of Dendritic Features
In the non-human primate, we found the mean number of primary dendrite segments to be 5.50 per cell (Fig. 6) which is fewer than the rodent model, which has on average approximately 7–8 primary dendrites segments per OO filled motor neuron (Friauf 1986; Faulkner et al., 1997). However, we found an average length of the primary dendrite segments to be 237 μm, whereas the mean length of the rodent primary dendrite segments was 50.1 μm. This indicates that there are fewer, but longer primary dendrite segments in the monkey, with potentially more volume and surface area. From intracellularly filled feline OO neurons, the average number of primary dendrite segments was found to be 11.6 with a range of 10 to 13 (Shaw and Baker, 1985). This suggests there are more primary dendrite segments on average in the cat than in the non-human primate and rodent. Unfortunately, the length of the primary dendrites was not provided in the Shaw and Baker paper, precluding a more detailed comparison of the primary dendrite profile. In our material, we found the secondary dendrite segments to have a relatively large average diameter and represent the highest average length. It will be extremely interesting to examine the functional significance of this finding in future studies.
Intranuclear Localization of OO Motor Neurons and Implications for Connectivity
We consistently found the somata of OO motor neurons confined to the territory of the intermediate subnucleus. Similarly, most labeled dendrites of the OO neurons evaluated in our study were confined to the intermediate subnucleus following immunohistochemical and cytoarchitectural analysis (Fig. 8). This observation would be in agreement with Welt and Abbs (1990) who noted that most dendritic branches of musculotopically isolated motor neurons in the monkey ramify extensively within the confines of their respective subregion. Underscoring this observation was our Sholl analysis which revealed that the maximal number of intersections occurred 60 μm distal to the somal center with the highest overall degree of dendritic arborization occurring within a range of 35–170 μm distal to the somal center (Fig. 5).
In terms of connectivity, the intermediate subnucleus of the facial nucleus is known to receive an extensive array of inputs from widespread regions of the neuraxis. For example, brainstem innervation arises from the red nucleus, mesencephalic tegmentum, olivary pretectal nucleus, dorsolateral pontine tegmentum, principle trigeminal nucleus, ventrolateral pontine tegmentum and medullary tegmentum (Travers and Norgren, 1983; Holstege et al., 1984; Holstege et al., 1986; Isokawa-Akesson and Komisaruk, 1987). Additional studies have shown that several regions of the cerebral cortex directly innervate the intermediate subnucleus, including the face region of the primary motor cortex, lateral premotor cortex, supplementary motor cortex, rostral cingulate motor cortex and caudal cingulate motor cortex (Kuypers, 1958; Jenny and Saper, 1987; Morecraft et al., 2001; Gong et al., 2005). Therefore, our findings indicate that terminal projections from extrinsic sources have a high probability of establishing contacts with OO motor neuron somata and their dendrites within the boundaries of the intermediate subnucleus (Figs. 2, 8). Our findings do not rule out the possibility that dendrites from other facial motoneurons such as those supplying the upper and lower lip for example, extend into the intermediate subnucleus and intermingle with dendritic fields of OO motoneurons.
Although we did not find dendrites located in the adjacent reticular formation in our material, we did find evidence of a few distal dendrites that were small in diameter extending beyond the intermediate subnucleus to enter the dorsomedial, medial and lateral subnuclei (Fig. 8B). This finding would be in agreement with Welt and Abbs’s (1990) and Friauf’s (1986) observations who noted that while most dendritic branches ramify within the facial subnuclei occupied by their affiliated somata, very few dendrites extend into adjacent facial subnuclei. These observations suggest that the primary site for potential terminal contacts with OO dendrites from extrinsic afferents lies within the confines of the intermediate subnucleus. On the other hand, this also suggests that afferents preferentially innervating the lateral, medial and intermediate subnuclei may also, but to a much lesser extent, influence dendrites of OO motor neurons whose somata are located within the intermediate subnucleus. For example, it has been shown that facial nucleus projections from the primary motor cortex (M1) preferentially innervate the contralateral, lateral subnucleus (Kuypers, 1958; Sokoloff and Deacon, 1990; Jenny and Saper, 1987; Morecraft et al., 2001). This pattern of terminal distribution suggests that M1 primarily influences the contralateral lower facial musculature since the lateral subnucleus harbors motor neurons innervating the orbicularis oris (Jenny and Saper, 1987, Morecraft et al., 2001) and the dendrites of orbicularis oris neurons ramify extensively within the confines of the lateral subnucleus (Welt and Abbs, 1990 –see their Fig. 9). This relationship is supported by studies examining the effects of cortical stimulation on the ventral region of M1 which primarily elicits contralateral lower facial movements (Penfield, 1937; Woolsey et al.,1952; Woolsey et al., 1979; McGuinness et al., 1980; Huang et al, 1988; Triggs et al., 2005) and longstanding clinical observations which have drawn the association between prominent contralateral lower facial paresis and injury afflicting the lateral peri-central cortex of the cerebral hemisphere (Green, 1938; Symon et al., 1975; Brodal, 1981; Adams et al., 1997). However, it has also been shown that to a lesser extent, OO activation can occur following direct stimulation of M1 (Woolsey et al., 1979; Benecke et al., 1988; Cruccu et al., 1990; Roedel et al., 2001; Sohn et al., 2004; Paradiso et al., 2005) and deficits transpire in OO function following damage to M1 that are less notable than perioral deficits, but are nonetheless detectable (Kojima et al., 1997). Collectively this observation may contribute to the complex nature of facial expression and possibly add to the inherent difficulties in isolating distinct, individuated facial muscle contractions following cortical stimulation (Woolsey et al., 1952; Strick and Preston, 1979; McGuinness et al., 1980; Brecht et al., 2004; Schieber, 2004).
Related to the LY filling technique employed in our study is the possibility that other applied methods may reveal distal dendrites lying outside the boundaries of the facial nucleus. We found examples of dendrites extending 500 μm radially from the somal center in our samples (Fig. 5- Sholl Analysis). This argues against the possibility that numerous dendrites extend beyond the borders of the primate facial nucleus and into the surrounding reticular formation as shown in the cat, rat and guinea pig models (Shaw and Baker 1985, Friauf et al. 1986; Pellegrini et al. 1995). Presumably, the LY filling technique applied in our study would not be completely limited in demonstrating this possibility in at least in some of our samples. This is underscored by the fact that many of our filled somata were located along the periphery of the intermediate subnucleus, but did not give rise to labeled dendrites detected in the reticular formation (Figs. 2A, B, E; 8A, B). To address these issues, it will be important to conduct future studies that apply the same experimental technique across species.
Summary and Future Applications
We found consistent representations in the morphological organization of the somata, dendrites and axons of OO motor neurons in our experimental preparations. The detailed characterization of 17 structural parameters of OO motor neurons should be useful for tracking structural alterations that may accompany experimentally induced disorders that alter OO function. This material also has considerable value for future comparative studies investigating primate scaling patterns and phylogenetic specializations (Sherwood, 2003; Sherwood, 2005; Sherwood et al., 2005), particularly in species where in vivo applications are impractical. These findings are of additional importance for assessing the effects of peripheral nerve trauma and facial nerve compression on the morphological adaptation and reorganization of facial motor neurons (Baker et al., 1994; Gantz et al., 1999). Our observations also provide a framework to study the vulnerability of these morphological characteristics following exposure to viruses which disrupt the neuronal environment and overall function of the facial nerve such as the herpes simplex virus in Bell’s palsy (Gantz et al., 1999; Gacek and Gacek, 2002; Linder et al., 2005). Finally, our observations may be useful for studying the acute and long-term effects of therapeutic interventions on OO motor neurons that are intended to manage facial movement disorders such as blepharospasm, hemifacial spasm and Meige syndrome (Wirtschafter, 1994; Hallett and Daroff, 1996; Jankovic and Brin, 1997; Anderson et al., 1998; Yen et al., 2003; Scott, 2004).
Acknowledgments
GRANT SUPPORT: National Institutes of Health (NS 046367, NS 15567, P20 RR016479) and The Benign Essential Blepharospasm Research Foundation (RJM).
Footnotes
Publisher's Disclaimer: This is a PDF file of an unedited manuscript that has been accepted for publication. As a service to our customers we are providing this early version of the manuscript. The manuscript will undergo copyediting, typesetting, and review of the resulting proof before it is published in its final citable form. Please note that during the production process errors may be discovered which could affect the content, and all legal disclaimers that apply to the journal pertain.
References
- Adams RD, Victor M, Ropper AH. Principles of Neurology. New York: McGraw-Hill; 1997. [Google Scholar]
- Andersen BB, Gundersen HJ. Pronounced loss of cell nuclei and anisotropic deformation of thick sections. J Microsc. 1999;196(Pt 1):69–73. [PubMed] [Google Scholar]
- Anderson RL, Patel BC, Holds JB, Jordan DR. Blepharospasm: past, present, and future. Ophthal Plast Reconstr Surg. 1998;14(5):305–317. [PubMed] [Google Scholar]
- Baker RS, Stava MW, Nelson KR, May PJ, Huffman MD, Porter JD. Aberrant reinnervation of facial musculature in a subhuman primate: a correlative analysis of eyelid kinematics, muscle synkinesis, and motoneuron localization. Neurology. 1994;44:2165–2173. doi: 10.1212/wnl.44.11.2165. [DOI] [PubMed] [Google Scholar]
- Basso MA, Evinger C. An explanation for reflex blink hyperexcitability in Parkinson’s disease. II. Nucleus raphe magnus. J Neurosci. 1996;16:7318–7330. doi: 10.1523/JNEUROSCI.16-22-07318.1996. [DOI] [PMC free article] [PubMed] [Google Scholar]
- Benecke R, Meyer BU, Schonle P, Conrad B. Transcranial magnetic stimulation of the human brain: responses in muscles supplied by cranial nerves. Exp Brain Res. 1988;71:623–632. doi: 10.1007/BF00248756. [DOI] [PubMed] [Google Scholar]
- Brecht M, Schneider M, Sakmann B, Margrie TW. Whisker movements evoked by stimulation of single pyramidal cells in rat motor cortex. Nature. 2004;427:704–710. doi: 10.1038/nature02266. [DOI] [PubMed] [Google Scholar]
- Brodal A. Neurological Anatomy in Relation to Clinical Medicine. Oxford: Oxford University Press; 1981. [Google Scholar]
- Burman K, Darian-Smith C, Darian-Smith I. Geometry of rubrospinal, rubroolivary, and local circuit neurons in the macaque red nucleus. J Comp Neurol. 2000;423:197–219. [PubMed] [Google Scholar]
- Crosby EC, Dejonge BR. Experimental and Clinical Studies of the Central Connections and Central Relations of the Facial Nerve. Ann Otol Rhinol Laryngol. 1963;72:735–755. doi: 10.1177/000348946307200310. [DOI] [PubMed] [Google Scholar]
- Cruccu G, Berardelli A, Inghilleri M, Manfredi M. Corticobulbar projections to upper and lower facial motoneurons. A study by magnetic transcranial stimulation in man. Neurosci Lett. 1990;117:68–73. doi: 10.1016/0304-3940(90)90121-o. [DOI] [PubMed] [Google Scholar]
- Darwin C. The Expressions of the Emotions in Man and Animals. London: John Murray; 1872. [Google Scholar]
- Dekker JJ, Kuypers HG. Morphology of rat AV thalamic nucleus in light and electron microscopy. Brain Res. 1976;117:387–398. doi: 10.1016/0006-8993(76)90749-6. [DOI] [PubMed] [Google Scholar]
- Duchenne G. In: The Mechanism of Human Facial Expression. RC, editor. New York: Cambridge University Press; 1862. 1990. [Google Scholar]
- Ekman P. Darwin, deception, and facial expression. Ann N Y Acad Sci. 2003;1000:205–221. doi: 10.1196/annals.1280.010. [DOI] [PubMed] [Google Scholar]
- Ekman P, Davidson RJ, Friesen WV. The Duchenne smile: emotional expression and brain physiology. II. J Pers Soc Psychol. 1990;58:342–353. [PubMed] [Google Scholar]
- Ekman P, Friesen WV. Felt, flase and miserable smiles. J Nonverb Behavior. 1982;6:238–252. [Google Scholar]
- Evinger C, Bao JB, Powers AS, Kassem IS, Schicatano EJ, Henriquez VM, Peshori KR. Dry eye, blinking, and blepharospasm. Mov Disord. 2002;17(Suppl 2):S75–78. doi: 10.1002/mds.10065. [DOI] [PMC free article] [PubMed] [Google Scholar]
- Evinger C, Graf WM, Baker R. Extra- and intracellular HRP analysis of the organization of extraocular motoneurons and internuclear in the guinea pig and rabbit. J Comp Neurol. 1987;262:529–445. doi: 10.1002/cne.902620307. [DOI] [PubMed] [Google Scholar]
- Evinger C, Manning KA, Sibony PA. Eyelid movements. Mechanisms and normal data. Invest Ophthalmol Vis Sci. 1991;32:387–400. [PubMed] [Google Scholar]
- Evinger C, Pellegrini JJ, Manning KA. Adaptive gain modification of the blink reflex. A model system for investigating the physiologic bases of motor learning. Ann N Y Acad Sci. 1989;563:87–100. doi: 10.1111/j.1749-6632.1989.tb42192.x. [DOI] [PubMed] [Google Scholar]
- Evinger C, Shaw MD, Peck CK, Manning KA, Baker R. Blinking and associated eye movements in humans, guinea pigs, and rabbits. J Neurophysiol. 1984;52:323–339. doi: 10.1152/jn.1984.52.2.323. [DOI] [PubMed] [Google Scholar]
- Faulkner B, Brown TH, Evinger C. Identification and characterization of rat orbicularis oculi motoneurons using confocal laser scanning microscopy. Exp Brain Res. 1997;116:10–19. doi: 10.1007/pl00005729. [DOI] [PubMed] [Google Scholar]
- Friauf E, Herbert H. Topographic organization of facial motoneurons to individual pinna muscles in rat (Rattus rattus) and bat (Rousettus aegyptiacus) J Comp Neurol. 1985;240:161–170. doi: 10.1002/cne.902400206. [DOI] [PubMed] [Google Scholar]
- Friauf E. Morphology of motoneurons in different subdivisions of the rat facial nucleus stained intracellularly with horseradish peroxidase. J Comp Neurol. 1986;8(253):2–231. 41. doi: 10.1002/cne.902530209. [DOI] [PubMed] [Google Scholar]
- Gacek RR, Gacek MR. Idiopathic facial paralysis (Bell’s palsy) Otol Neurotol. 2002;23:617–618. doi: 10.1097/00129492-200207000-00037. [DOI] [PubMed] [Google Scholar]
- Gantz BJ, Rubinstein JT, Gidley P, Woodworth GG. Surgical management of Bell’s palsy. Laryngoscope. 1999;109:1177–1188. doi: 10.1097/00005537-199908000-00001. [DOI] [PubMed] [Google Scholar]
- Gong S, DeCuypere M, Zhao Y, LeDoux MS. Cerebral cortical control of orbicularis oculi motoneurons. Brain Res. 2005;1047:177–193. doi: 10.1016/j.brainres.2005.04.045. [DOI] [PubMed] [Google Scholar]
- Green WE. The Effects of Ablation of the Cortical Motor Face Area in Monkeys. J Neurophysiol. 1938;1:262–280. [Google Scholar]
- Hallett M. Blepharospasm: recent advances. Neurology. 2002;59:1306–1312. doi: 10.1212/01.wnl.0000027361.73814.0e. [DOI] [PubMed] [Google Scholar]
- Hallett M, Daroff RB. Blepharospasm: report of a workshop. Neurology. 1996;46:1213–1218. doi: 10.1212/wnl.46.5.1213. [DOI] [PubMed] [Google Scholar]
- Hollinshead W. Anatomy for Surgeons: The Head and the Neck. Philadelphia: Harper and Row Publishers; 1982. pp. 292–300. [Google Scholar]
- Holstege G. Emotional innervation of facial musculature. Mov Disord. 2002;17(Suppl 2):S12–16. doi: 10.1002/mds.10050. [DOI] [PubMed] [Google Scholar]
- Holstege G, Tan J, van Ham J, Bos A. Mesencephalic projections to the facial nucleus in the cat. An autoradiographical tracing study. Brain Res. 1984;311:7–22. doi: 10.1016/0006-8993(84)91393-3. [DOI] [PubMed] [Google Scholar]
- Holstege G, van Ham JJ, Tan J. Afferent projections to the orbicularis oculi motoneuronal cell group. An autoradiographical tracing study in the cat. Brain Res. 1986;374:306–320. doi: 10.1016/0006-8993(86)90425-7. [DOI] [PubMed] [Google Scholar]
- Huang CS, Sirisko MA, Hiraba H, Murray GM, Sessle BJ. Organization of the primate face motor cortex as revealed by intracortical microstimulation and electrophysiological identification of afferent inputs and corticobulbar projections. J Neurophysiol. 1988;59:796–818. doi: 10.1152/jn.1988.59.3.796. [DOI] [PubMed] [Google Scholar]
- Huber E. Evolution of facial musculature and facial expression. Baltimore, Maryland: Johns Hopkins University Press; 1931. [Google Scholar]
- Huber E. In: The facial musculature and its innervation. Hartman CSW, editor. Baltimore: The Willimas & Wilkins Company; 1933. [Google Scholar]
- Isokawa-Akesson M, Komisaruk BR. Difference in projections to the lateral and medial facial nucleus: anatomically separate pathways for rhythmical vibrissa movement in rats. Exp Brain Res. 1987;65:385–398. doi: 10.1007/BF00236312. [DOI] [PubMed] [Google Scholar]
- Jankovic J, Brin MF. Botulinum toxin: historical perspective and potential new indications. Muscle Nerve. 1997;(Suppl 6):S129–145. [PubMed] [Google Scholar]
- Jankovic J, Tolosa E. Parkinson’s disease and movement disorders. New York: Lipincott, Williams and Wilkins; 1998. [Google Scholar]
- Jenny AB, Saper CB. Organization of the facial nucleus and corticofacial projection in the monkey: a reconsideration of the upper motor neuron facial palsy. Neurology. 1987;37:930–939. doi: 10.1212/wnl.37.6.930. [DOI] [PubMed] [Google Scholar]
- Joshi S, Hawken MJ. Loose – patch - juxtacellular recording in vivo – a method for functional characterization and labeling of neurons in macaque V1. J Neurosci Meth. 2006;156:37–49. doi: 10.1016/j.jneumeth.2006.02.004. [DOI] [PubMed] [Google Scholar]
- Kojima Y, Kaga K, Shindo M, Hirose A. Electromyographic examination of patients with unilateral cortical facial paralysis. Otolaryngol Head Neck Surg. 1997;117:S121–124. doi: 10.1016/S0194-59989770077-9. [DOI] [PubMed] [Google Scholar]
- Kuypers HG. Some projections from the peri-central cortex to the pons and lower brain stem in monkey and chimpanzee. J Comp Neurol. 1958;110:221–255. doi: 10.1002/cne.901100205. [DOI] [PubMed] [Google Scholar]
- Linder T, Bossart W, Bodmer D. Bell’s palsy and herpes simplex virus: fact of mystery? Otol Neurotol. 2005;26:109–113. doi: 10.1097/00129492-200501000-00020. [DOI] [PubMed] [Google Scholar]
- Manning KA, Evinger C. Different forms of blinks and their two-stage control. Exp Brain Res. 1986;64:579–588. doi: 10.1007/BF00340495. [DOI] [PubMed] [Google Scholar]
- McGuinness E, Sivertsen D, Allman JM. Organization of the face representation in macaque motor cortex. J Comp Neurol. 1980;193:591–608. doi: 10.1002/cne.901930302. [DOI] [PubMed] [Google Scholar]
- Morecraft RJ, Cipolloni PB, Stilwell-Morecraft KS, Gedney MT, Pandya DN. Cytoarchitecture and cortical connections of the posterior cingulate and adjacent somatosensory fields in the rhesus monkey. J Comp Neurol. 2004;469:37–69. doi: 10.1002/cne.10980. [DOI] [PubMed] [Google Scholar]
- Morecraft RJ, Geula C, Mesulam MM. Cytoarchitecture and neural afferents of orbitofrontal cortex in the brain of the monkey. J Comp Neurol. 1992;323:341–358. doi: 10.1002/cne.903230304. [DOI] [PubMed] [Google Scholar]
- Morecraft RJ, Herrick JL, Stilwell-Morecraft KS, Louie JL, Schroeder CM, Ottenbacher JG, Schoolfield MW. Localization of arm representation in the corona radiata and internal capsule in the non-human primate. Brain. 2002;125:176–198. doi: 10.1093/brain/awf011. [DOI] [PubMed] [Google Scholar]
- Morecraft RJ, Louie JL, Herrick JL, Stilwell-Morecraft KS. Cortical innervation of the facial nucleus in the non-human primate: a new interpretation of the effects of stroke and related subtotal brain trauma on the muscles of facial expression. Brain. 2001;124:176–208. doi: 10.1093/brain/124.1.176. [DOI] [PubMed] [Google Scholar]
- Morecraft RJ, Van Hoesen GW. Cingulate input to the primary and supplementary motor cortices in the rhesus monkey: evidence for somatotopy in areas 24c and 23c. J Comp Neurol. 1992;322:471–489. doi: 10.1002/cne.903220403. [DOI] [PubMed] [Google Scholar]
- Papez J. Subdivisions of the facial nucleus. J Comp Neurol. 1927;43:159–191. [Google Scholar]
- Paradiso GO, Cunic DI, Gunraj CA, Chen R. Representation of facial muscles in human motor cortex. J Physiol. 2005;567:323–336. doi: 10.1113/jphysiol.2005.088542. [DOI] [PMC free article] [PubMed] [Google Scholar]
- Pellegrini JJ, Horn AK, Evinger C. The trigeminally evoked blink reflex. I. Neuronal circuits. Exp Brain Res. 1995;107(2):166–80. doi: 10.1007/BF00230039. [DOI] [PubMed] [Google Scholar]
- Penfield W. Somatic motor and sensory representation in the cerebral cortex of man as studied by electrical stimulation. Brain. 1937;60:389–443. [Google Scholar]
- Peshori KR, Schicatano EJ, Gopalaswamy R, Sahay E, Evinger C. Aging of the trigeminal blink system. Exp Brain Res. 2001;136:351–363. doi: 10.1007/s002210000585. [DOI] [PubMed] [Google Scholar]
- Porter JD, Burns LA, May PJ. Morphological substrate for eyelid movements: innervation and structure of primate levator palpebrae superioris and orbicularis oculi muscles. J Comp Neurol. 1989;287:64–81. doi: 10.1002/cne.902870106. [DOI] [PubMed] [Google Scholar]
- Roedel RM, Laskawi R, Markus H. Cortical representation of the orbicularis oculi muscle as assessed by transcranial magnetic stimulation (TMS) Laryngoscope. 2001;111:2005–2011. doi: 10.1097/00005537-200111000-00026. [DOI] [PubMed] [Google Scholar]
- Rosene DL, Roy NJ, Davis BJ. A cryoprotection method that facilitates cutting frozen sections of whole monkey brains for histological and histochemical processing without freezing artifact. J Histochem Cytochem. 1986;34:1301–1315. doi: 10.1177/34.10.3745909. [DOI] [PubMed] [Google Scholar]
- Satoda T, Takahashi O, Tashiro T, Matsushima R, Uemura-Sumi M, Mizuno N. Representation of the main branches of the facial nerve within the facial nucleus of the Japanese monkey (Macaca fuscata) Neurosci Lett. 1987;78:283–287. doi: 10.1016/0304-3940(87)90374-0. [DOI] [PubMed] [Google Scholar]
- Schicatano EJ, Basso MA, Evinger C. Animal model explains the origins of the cranial dystonia benign essential blepharospasm. J Neurophysiol. 1997;77:2842–2846. doi: 10.1152/jn.1997.77.5.2842. [DOI] [PubMed] [Google Scholar]
- Schieber MH. Motor control: basic units of cortical output? Curr Biol. 2004;14:R353–R354. doi: 10.1016/j.cub.2004.04.025. [DOI] [PubMed] [Google Scholar]
- Scott AB. Development of botulinum toxin therapy. Dermatol Clin. 2004;22:131–133. v. doi: 10.1016/s0733-8635(03)00019-6. [DOI] [PubMed] [Google Scholar]
- Shaw MD, Baker R. Morphology of motoneurons in a mixed motor pool of the cat facial nucleus that innervate orbicularis oculis and quadratus labii superioris, stained intracellularly with horseradish peroxidase. Neuroscience. 1985;14:627–643. doi: 10.1016/0306-4522(85)90315-x. [DOI] [PubMed] [Google Scholar]
- Sherwood CC. Anthropology. New York: Columbia University; 2003. Neural substrates of primate communication: a comparative histometric study of the orofacial system. [Google Scholar]
- Sherwood CC. Comparative anatomy of the facial motor nucleus in mammals, with an analysis of neuron numbers in primates. Anat Rec A Discov Mol Cell Evol Biol. 2005;287:1067–1079. doi: 10.1002/ar.a.20259. [DOI] [PubMed] [Google Scholar]
- Sherwood CC, Hof PR, Holloway RL, Semendeferi K, Gannon PJ, Frahm HD, Zilles K. Evolution of the brainstem orofacial motor system in primates: a comparative study of trigeminal, facial, and hypoglossal nuclei. J Human Evol. 2005;48:54–84. doi: 10.1016/j.jhevol.2004.10.003. [DOI] [PubMed] [Google Scholar]
- Sokoloff AJ, Deacon TW. Direct projections from the face area of the primary motor cortex to the facial nucleus in the cynomolgus monkey but not the cat or rat. Am J Phys Anthropol. 1990;81:298. [Google Scholar]
- Smith MC, Smith MK, Ellgring H. Spontaneous and posed facial expression in Parkinson’s Disease. J Int Neuropsychol Soc. 1996;2:383–391. doi: 10.1017/s1355617700001454. [DOI] [PubMed] [Google Scholar]
- Sohn YH, Voller B, Dimyan M, St Clair Gibson A, Hanakawa T, Leon-Sarmiento FE, Jung HY, Hallett M. Cortical control of voluntary blinking: a transcranial magnetic stimulation study. Clin Neurophysiol. 2004;115:341–347. doi: 10.1016/j.clinph.2003.10.035. [DOI] [PubMed] [Google Scholar]
- Strick PL, Preston JB. Multiple representation in the primate motor cortex. Brain Res. 1978;154:366–370. doi: 10.1016/0006-8993(78)90707-2. [DOI] [PubMed] [Google Scholar]
- Symon L, Dorsch NW, Crockard HA. The production and clinical features of a chronic stroke model in experimental primates. Stroke. 1975;6:476–481. doi: 10.1161/01.str.6.5.476. [DOI] [PubMed] [Google Scholar]
- Szentagothai J. The Representation of Facial and Scalp Muscles in the Facial Nucleus. J Comp Neurol. 1948;88:207–220. [PubMed] [Google Scholar]
- Travers JB, Norgren R. Afferent projections to the oral motor nuclei in the rat. J Comp Neurol. 1983;220:280–298. doi: 10.1002/cne.902200303. [DOI] [PubMed] [Google Scholar]
- Triggs WJ, Ghacibeh G, Springer U, Bowers D. Lateralized asymmetry of facial motor evoked potentials. Neurology. 2005;65:541–544. doi: 10.1212/01.wnl.0000172916.91302.e7. [DOI] [PubMed] [Google Scholar]
- VanderWerf F, Aramideh M, Otto JA, Ongerboer de Visser BW. Retrograde tracing studies of subdivisions of the orbicularis oculi muscle in the rhesus monkey. Exp Brain Res. 1998;121:433–441. doi: 10.1007/s002210050478. [DOI] [PubMed] [Google Scholar]
- Welt C, Abbs JH. Musculotopic organization of the facial motor nucleus in Macaca fascicularis: a morphometric and retrograde tracing study with cholera toxin B-HRP. J Comp Neurol. 1990;291:621–636. doi: 10.1002/cne.902910409. [DOI] [PubMed] [Google Scholar]
- Williams PLWR, Dyson M, Bannister LH. Gray’s Anatomy. London: Churchill Livingstone; 1989. pp. 570–580. [Google Scholar]
- Wirtschafter JD. Chemomyectomy of the orbicularis oculi muscles for the treatment of localized hemifacial spasm. J Neuroophthalmol. 1994;14:199–204. [PubMed] [Google Scholar]
- Woolsey CN, Erickson TC, Gilson WE. Localization in somatic sensory and motor areas of human cerebral cortex as determined by direct recording of evoked potentials and electrical stimulation. J Neurosurg. 1979;51:476–506. doi: 10.3171/jns.1979.51.4.0476. [DOI] [PubMed] [Google Scholar]
- Woolsey CN, Settlage PH, Meyer DR, Sencer W, Pinto Hamuy T, Travis AM. Patterns of localization in precentral and “supplementary” motor areas and their relation to the concept of a premotor area. Res Publ Assoc Res Nerv Ment Dis. 1952;30:238–264. [PubMed] [Google Scholar]
- Yen MT, Anderson RL, Small RG. Orbicularis oculi muscle graft augmentation after protractor myectomy in blepharospasm. Ophthal Plast Reconstr Surg. 2003;19:287–296. doi: 10.1097/01.IOP.0000075020.81386.D5. [DOI] [PubMed] [Google Scholar]
- Yerkes RM, Yerkes AW. The great apes. New Haven, CT: Yale University Press; 1929. [Google Scholar]
- Yoo JH, Lee SH, Lee KY, Song BR. Morphology and Distribution of Motoneurons in the Facial Nucleus Innervating the Orbicularis Oculi Muscle in the Cat: Retrograde Tracer Study Using Horseradish Peroxidase. Neuro-opthalmol Jpn. 2005;22:146–153. [Google Scholar]