Abstract
Background: A significant proportion of the average annual body weight (BW) gain in US adults (∼0.5–1 kg/y) may result from modest episodes of positive energy balance during the winter holiday season.
Objective: We tested whether holiday BW gain was reduced in participants with high baseline total energy expenditure (TEE) or whether it varied by BMI (in kg/m2).
Design: In a secondary analysis of previously published data, ΔBW normalized over 90 d from mid-September/mid-October 1999 to mid-January/early March 2000 was analyzed by sex, age, and BMI in 443 men and women (40–69 y of age). TEE was measured by doubly labeled water. High or low energy expenditure was assessed as residual TEE after linear adjustment for age, height, and BW.
Results: No correlations between ΔBW and TEE or TEE residuals were found. Sixty-five percent of men and 58% of women gained ≥0.5 kg BW, with ∼50% of both groups gaining ≥1% of preholiday BW. Obese men (BMI ≥30) gained more BW than did obese women.
Conclusions: A high preholiday absolute TEE or residual TEE did not protect against BW gain during the winter holiday quarter. It is not known whether higher than these typical TEE levels would protect against weight gain or if the observed gain may be attributed to increased food consumption and/or reduced physical activity during the holiday quarter.
INTRODUCTION
It is estimated that the average US adult gains ∼0.5–1.0 kg BW4 annually (1–3). Using population survey data from NHANES, Wang et al (4) estimated that if current trends continue, >80% of US adults will be considered overweight or obese, defined as a BMI (in kg/m2) ≥25, by 2030.
In 2000, Yanovski et al (5) examined BW change in 195 adults before, during, and after the winter holiday season. Compared with BW in late-September/early-October (preholiday), participants had a significant average net BW gain (0.5 ± 2.2 kg) in late-February/early-March (after the holiday). Interestingly, >75% of the net BW gain (0.4 ± 1.5 kg) occurred during the holiday period, which began just before Thanksgiving and ended shortly after New Year's Day. Also noteworthy, follow-up BW was measured from the postholiday period to the preholiday period of the following year in 165 of the original participants, which showed a trend for BW gain of 0.2 ± 2.3 kg, albeit nonstatistically significant (P = 0.13). Others have found similar results, because weight gain among students from the University of Oklahoma averaged ∼0.5 kg after a 2-wk period that included Thanksgiving, whereas a subset of students with a BMI ≥25 gained 1.0 kg (6). These results suggest that a significant percentage of the average annual BW gain in US adults occurs during the winter holiday quarter and is maintained throughout the following year.
The daily energy imbalance underlying these weight gains may be small on a daily basis (1, 7). The average weight gain in Yanovski et al's study was ∼40 kcal/d, assuming that the weight gained has an energy density of 7800 kcal/kg (8). A significant proportion of the average annual BW gain, however, may result from a few larger episodes of positive energy balance rather than a large number of small daily imbalances. This is illustrated by the University of Oklahoma study, where the average gain corresponds to an energy imbalance of almost 300 kcal/d. It is unknown, however, whether a person with high-energy expenditure is less susceptible to this seasonal weight gain.
Given the long-term negative health consequences of overweight and obesity, and understanding that the winter holiday period in the United States may contribute to annual BW gain, it is important to understand factors influencing this BW gain. To our knowledge, no one has investigated the effect of free-living daily TEE measured via DLW on BW change over the winter holiday. The purpose of this study was to determine whether adult men and women who burn more total daily calories than predicted for their age, height, and BW were protected against holiday BW gain. We hypothesized that BW gain over the winter holiday quarter would be lower in adults with a higher baseline TEE than predicted for their age, height, and BW.
SUBJECTS AND METHODS
In a secondary analysis of previously published data, baseline TEE and change in BW over the 1999–2000 winter holiday quarter was examined in 443 men and women (40–69 y of age) who participated in the OPEN Study (9). Briefly, the original purpose of the OPEN Study was to assess self-reported dietary measurement error by comparing results from self-reported dietary intake questionnaires with objective biomarkers: DLW for TEE, and urinary nitrogen for protein consumption. Study participants were recruited by contacting a random sample of 5000 households in the metropolitan area of Washington, DC (Montgomery County, MD). Data were available for 451 participants. Eight participants (4 men and 4 women) were excluded from the current analysis because of changes in BW outside ±3 SDs of their respective sex-specific mean. The OPEN Study was approved by the National Cancer Institute's Special Studies Institutional Review Board.
Body weight and height
BW and height were measured in a clinic setting after an overnight fast before the winter holiday quarter (mid-September to mid-October 1999) and again after the winter holiday quarter (mid-January to early-March 2000). The average interval between BW assessments was 107 ± 7 d. To normalize for differences in individual study interval days, each subject's ΔBW was divided by their respective number of days between BW assessments and then multiplied by 90 d.
Energy expenditure and PAL
The primary analysis was performed by using TEE. Baseline TEE was measured by DLW in all participants before the winter holiday quarter (mid-September to mid-October 1999). Details of TEE measurements are described elsewhere (9, 10). Briefly, DLW was dosed orally at ∼2 g of 10 atom percent 18O-labeled water and 0.12 g of 99.9 atom percent deuterium per 1 kg estimated total body water. A 5–urine specimen protocol was used to determine total body water measured by the plateau method (11). TEE from DLW was calculated according to Racette et al (12) and by using the modified Weir equation assuming a respiratory quotient of 0.86. FFM was determined from the total body water measurement from DLW with the use of a hydration constant of 0.73.
TEE residuals (TEEmeasured – TEEpredicted) were calculated after linear adjustment of TEE for age, height, and BW.
The positive intercepts in the above prediction equations appear counterintuitive; however, they reflect the nonlinear relation observed between physical characteristics and energy expenditure during the early years of life (13).
A second analysis was performed by using the traditional PAL expression of physical activity. RMR was not measured, but was estimated from BW, height, and age by using the Mifflin equations for adult men and women (14).
PAL was estimated by dividing TEE by calculated RMR. PAEE was estimated from TEE and RMR, assuming that the thermic effect of food was 10% of TEE:
Statistics
Unpaired t tests were used to test for differences in baseline measures of energy expenditure, PAL, and body composition between sexes. One-factor ANOVA was used to test for differences in ΔBW between quartiles of TEEresiduals within sex. Two-factor ANOVA was used to test for differences in absolute and relative (%) ΔBW between age and BMI categories within sex. If the main effect of age or BMI was significant, differences between means were assessed by using Tukey's multiple-comparison test. A 2 × 3 chi-square test was used to test for differences in the incidence of excessive weight gain, defined as >2.0 kg, between BMI categories (healthy, overweight, and obese) within sex. To assess the relation between ΔBW with measures of energy expenditure, linear (Pearson) regression was used to compare ΔBW with TEE, PAL, and TEEresiduals for both men and women. The Number Cruncher Statistical System (2007 version) was used for statistical analysis. All statistical tests were 2-sided, with α = 0.05. Results are presented as means ± SDs unless otherwise stated.
RESULTS
Baseline characteristics of study participants are presented in Table 1. Data were analyzed from 242 men and 201 women; approximately one-third of males and females were represented in each decade of age except for women aged 60–69 y (24%). The mean age for women was 53 ± 8 y and for men was 54 ± 9 y. The mean BMI was 27 ± 6 for women and 28 ± 4 for men.
TABLE 1.
Distribution of study population separated by sex, age, and BMI
| Men (n = 242) | Women (n = 201) | |
| Age [n (%)] | ||
| 40–49 y | 88 (36) | 78 (39) |
| 50–59 y | 80 (33) | 76 (38) |
| 60–69 y | 74 (31) | 47 (24) |
| BMI [n (%)] | ||
| ≤25.0 kg/m2 | 56 (23) | 78 (39) |
| 25.0 to <30.0 kg/m2 | 118 (49) | 67 (33) |
| ≥30.0 kg/m2 | 68 (28) | 56 (28) |
Men and women differed significantly in every measure of energy expenditure and body composition (Table 2). Men had a higher average TEE than did women; however, when TEE was adjusted for FFM, women had a significantly higher energy expenditure than did men. The average estimated PAL and PAEE were also significantly higher in men, but estimated PAEE was significantly higher in women after adjustment for FFM. FFM was significantly higher and percentage body fat was significantly lower in the men.
TABLE 2.
Baseline energy expenditure characteristics (mid-September to mid-October 1999)1
| Men (n = 242) | Women (n = 201) | P value2 | |
| TEE (kcal/d) | 2897 ± 522 | 2296 ± 376 | <0.001 |
| TEEFFM (kcal/d) | 2591 ± 346 | 2661 ± 262 | 0.021 |
| FFM (kg) | 59 ± 8 | 42 ± 6 | <0.001 |
| Fat (%) | 32 ± 6 | 41 ± 7 | <0.001 |
| RMR (kcal/d)3 | 1720 ± 184 | 1430 ± 135 | <0.001 |
| PAL | 1.69 ± 0.22 | 1.61 ± 0.20 | <0.001 |
| PAEE (kcal/d) | 892 ± 361 | 645 ± 237 | <0.001 |
All values are means ± SDs. FFM, fat-free mass; PAEE, physical activity energy expenditure = (TEE × 0.9 – RMR); PAL, physical activity level; RMR, resting metabolic rate; TEE, total energy expenditure; TEEFFM, total energy expenditure adjusted for FFM.
Men compared with women (2-tailed t test).
Estimated by using the Mifflin equation (14). Unpaired t tests were used to test for differences in baseline energy expenditure characteristics.
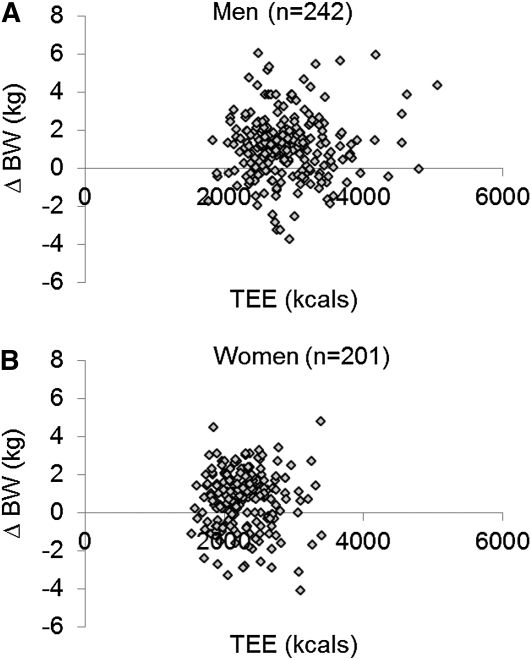
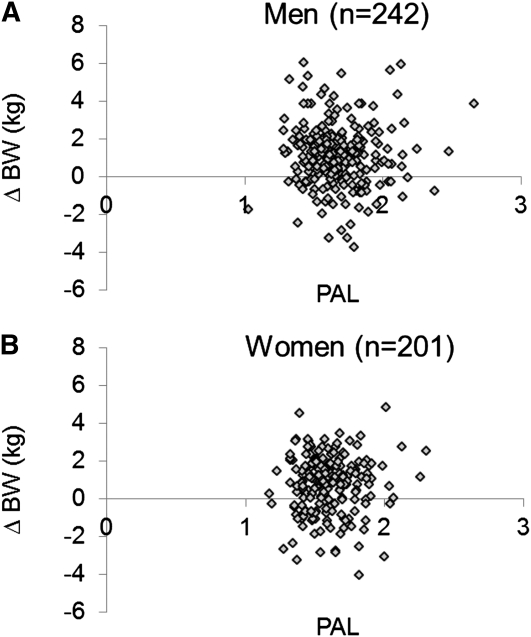
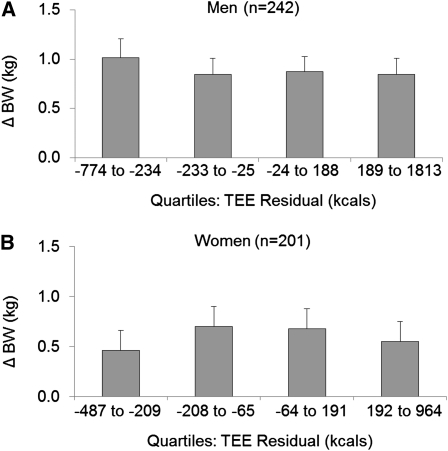
For both men and women, no relation was observed between ΔBW and baseline TEE (Figure 1; R2 < 0.01, NS) or between ΔBW and PAL (Figure 2; R2 < 0.01, NS). In addition, no difference in ΔBW between quartiles of TEE residuals was observed for either men or women (Figure 3).
FIGURE 1.
ΔBW versus baseline absolute TEE for men (A; n = 242) and women (B; n = 201). ΔBW was linearly normalized to change over 90 d. Linear (Pearson) regression was used to compare ΔBW with TEE for both men and women. No significant relations were found. TEE, total energy expenditure; ΔBW, change in body weight.
FIGURE 2.
ΔBW versus PAL for men (A; n = 242) and women (B; n = 201). PAL = baseline absolute total energy expenditure/resting metabolic rate. Resting metabolic rate was estimated by using the Mifflin equation (14). ΔBW was linearly normalized to change over 90 d. Linear (Pearson) regression was used to compare ΔBW with PAL for both men and women. No significant relations were found. PAL, physical activity level; ΔBW, change in body weight.
FIGURE 3.
Mean (±SE) ΔBW versus quartiles of baseline absolute TEE residuals for men (A; n = 242) and women (B; n = 201). ΔBW was linearly normalized to change over 90 d. One-factor ANOVA was used to test for differences in ΔBW between quartiles of TEE residuals within sex. No significant differences were found. TEE, total energy expenditure; ΔBW, change in body weight.
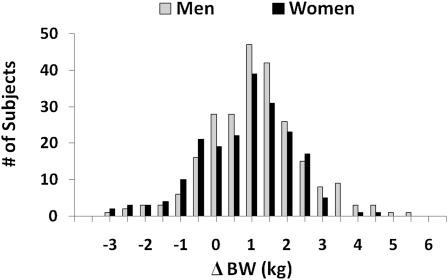
The distribution of ΔBW for all participants, linearly normalized to change over 90 d, is shown in Figure 4. Mean ΔBW was 0.9 ± 1.4 kg (range: −3.2–5.2 kg) in men and 0.6 ± 1.3 kg (range: −3.4–4.2 kg) in women (P < 0.05, men compared with women); however, the percentage change from preholiday BW averaged 1.0 ± 1.5% (range: −4.0–5.4%) in men and 0.9 ± 1.8% (range: −4.6–5.8%) in women (P > 0.05, men compared with women). A total of 157 men (65%) and 117 women (58%) gained ≥0.5 kg BW, whereas 40 men (17%) and 25 women (12%) gained ≥2.0 kg BW. Approximately 50% of both men and women gained ≥1% of their initial preholiday BW. No significant differences in the incidence of excessive weight gain, defined as >2.0 kg, between BMI categories (healthy, overweight, obese) within sexes.
FIGURE 4.
Distribution of ΔBW for men (n = 242) and women (n = 201). The average interval between BW assessments was 107 ± 7 d. To normalize for differences in individual study interval days, each subject's ΔBW was divided by their respective number of days between BW assessments and then multiplied by 90 d. ΔBW, change in body weight.
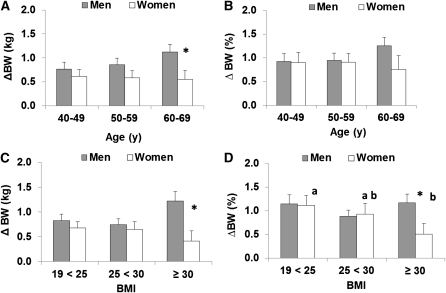
Men in the seventh decade of life (age 60–69 y) gained more BW (P < 0.05) than did women of the same age (Figure 5A), although this difference is not significant when ΔBW is expressed as the percentage of initial preholiday BW (P = 0.10; Figure 5B). ΔBW did not differ significantly by age decade within sex, but men aged 60–69 y showed a trend (P = 0.09) for increased BW gain compared with men aged 40–49 y. Obese men (BMI ≥30) gained more BW than did obese women, regardless of whether weight gain was expressed in absolute (kg) or relative (%) terms (P < 0.05; Figure 5, C and D). ΔBW did not differ significantly by BMI category in men. When expressed in absolute terms, ΔBW (kg) did not differ significantly by BMI category in women; however, when expressed as the percentage of initial preholiday BW, obese women gained less BW than did women in the healthy-weight BMI category (P < 0.05).
FIGURE 5.
Mean (±SE) absolute (kg) and relative (%) ΔBWs by age and BMI for men (n = 242) and women (n = 201). ΔBW was linearly normalized to change over 90 d. Repeated-measures ANOVA was used to test for differences in absolute and relative (%) ΔBW between age and BMI categories within sex. Bars with different lowercase letters represent significant differences within sex between BMI categories (P < 0.05). *Significant difference between sexes within age or BMI category (P < 0.05). There were no significant sex-by-age or sex-by-BMI interactions. ΔBW, change in body weight.
DISCUSSION
The primary findings from our secondary analysis of data from the OPEN Study (9) suggest that older men and women with higher baseline preholiday absolute or residual daily TEE are not protected from BW gain over the winter holiday quarter. We found no differences in BW gain between quartiles of TEE residuals. If high residual TEE at baseline was protective against BW gain during the time period studied, we would expect individuals in the lowest quartile of TEE residuals (those with a lower measured TEE than predicted for age, height, and BW) to gain more BW than individuals in the highest quartile, which was not observed.
Participants in the OPEN Study (9) were primarily white, educated, older adult men and women. Whereas this sample may not be representative of the US population, the mean weight gain observed in our study was similar, albeit slightly higher (0.8 kg compared with 0.5 kg) than that observed in Yanovski et al's (5) convenience sample of primarily white (67%) men and women ranging in age from 19 to 82 y. The average weight gain observed in the current study was also similar to the holiday weight gain in other populations. Andersson and Rossner (15) observed a significant increase in body weight (0.4 ± 0.8 kg) in 76 Swedish middle-aged men and women with a healthy BMI during a 3-wk period over the Christmas holiday, compared with a nonsignificant increase (0.6 ± 2.4 kg) in 46 obese men and women participating in weight-maintenance programs. In a study examining the role of conjugated linoleic acid in reducing body fat and preventing holiday weight gain, 18 men and women (32 ± 7 y of age) receiving a placebo gained 1.1 ± 3.2 kg over a 6-mo period between August-October and January-March (16). Almost all of the average weight gain occurred during the holiday season in November-December.
A primary assumption in the interpretation of our findings was that baseline PAL and TEE represent habitual levels of energy expenditure and thus remain the same for each individual throughout the winter holiday quarter. If this is true, then it is unlikely that our findings were the result of lower-than-average PALs or TEEs relative to other populations of similarly aged men and women. As a group, measured TEE was not different from TEE calculated by using the equations developed for the 2005 Dietary Reference Intakes to determine estimated energy requirements for weight maintenance (2624 ± 550 compared with 2657 ± 565 kcal, respectively), which are specific for age, sex, body size, and physical activity (17). In addition, mean baseline PALs for both men (1.69 ± 0.22) and women (1.61 ± 0.20) were similar to those of national population averages; however, it is possible that PAL decreased during the winter holiday quarter and could have contributed to a cumulative positive energy balance, which led to the observed weight gain.
On average, approximately two-thirds of the participants in this study gained ≥0.5 kg BW over the holiday period (normalized to change over 90 d). Assuming that excess BW gain was 80% fat and 20% FFM (8) and had a tissue energy density of 7.8 kcal/g, individuals who gained 0.5 kg BW would have accumulated a total positive energy balance of ∼3900 kcal, or 43 kcal/d. This is similar to the previously calculated positive energy balance attributed to the 12-wk holiday BW gain in the study by Yanovski et al (5); however, the energy imbalance associated with the winter holiday period probably does not reflect a constant daily imbalance. Racette et al (18) measured body mass daily in 48 men and women over an entire year and found that the daily BW gain averaged 3 g/d, but the average weekend daily BW gain was 60 g/d compared with a weekday average BW loss of 20 g/d. As previously calculated (19), the higher weekend rate of gain corresponds to an energy imbalance of considerably >43 kcal/d followed by weekday periods of negative energy balance. The assumptions regarding the composition of the tissue gained in the study by Racette et al, however, are less reliable than those for long-term weight gain. It is possible that a similar situation exists during the winter holiday period. Larger periods of positive energy balance may exist around the actual holiday dates, similar to the calculated energy imbalance associated with weekends. In contrast, the days in between actual holiday dates may represent smaller changes or possibly even negative energy-balance conditions. If holiday weight gain reflects the average weekday/weekend change in BW, as seen by Racette et al, it is conceivable that only 10–30 d of the holiday period contributed to the entire average winter holiday BW gain. More research is required to determine the exact time periods that contribute to net weight gain during the winter holiday quarter.
A limitation of our study was that we did not have an independent measure of RMR from which to calculate PAL for physical activity. Our study population, however, was similar to that studied by Mifflin et al (14), who examined a large group (n = 498) of individuals with a roughly even distribution of normal weight and obese men and women ranging in age from 19 to 78 y. RMR is largely determined by FFM, but it is also highly correlated with total BW. The addition of age, height, and sex strengthened the predictive value of BW in determining RMR in the equations developed. Therefore, the use of the Mifflin equation is likely applicable to our population. Also, we did not have a measure of changes in body composition over the holiday period and therefore assumed that BW gain was predominantly FM (8). Finally, we did not have an independent measure of activity energy expenditure during the holiday period. Future studies should include objective measures of activity energy expenditure, such as accelerometers or global positioning system devices to quantify changes in activity that might contribute to BW change over the holiday season.
In conclusion, our data do not provide evidence that a high baseline absolute or residual TEE after adjustment for weight, height, and sex provided protection against BW gain during the winter holiday quarter. Also, there was no evidence that a higher than expected level of TEE provided protection against holiday BW gain when estimated RMR was used to predict PAL. Decreased levels of physical activity during the holidays cannot be ignored, and baseline PAL may have been insufficient to prevent weight gain; however, baseline PAL and TEE were comparable, with similar populations suggesting that average weight gain over the winter holiday quarter may be attributed to excess food consumption above weight-maintenance requirements. Nonetheless, encouraging increased activity levels for health reasons is beneficial and may have led to less weight than might have been gained otherwise. To better understand the causes of weight gain during the winter holiday quarter, interventions are needed that objectively measure food intake, energy expenditure, and changes in body composition.
Acknowledgments
The authors’ responsibilities were as follows—CMC: data analysis, data interpretation, and manuscript preparation; RPT: conception and conduct of the OPEN Study and manuscript preparation; DAS: conception of the study, analysis of doubly labeled water data, data interpretation, and manuscript preparation; and AFS: conception and conduct of the OPEN Study and manuscript preparation. All authors read and approved the final manuscript. None of the authors had any financial or personal conflicts of interest.
Footnotes
Abbreviations used: BW, body weight; DLW, doubly labeled water; OPEN, Observing Protein and Energy Nutrition study; FFM, fat-free mass; FM, fat mass; PAEE, physical activity energy expenditure; PAL, physical activity level; RMR, resting metabolic rate; TEE, total energy expenditure.
REFERENCES
- 1.Hill JO, Wyatt HR, Reed GW, Peters JC. Obesity and the environment: where do we go from here? Science 2003;299:853–5 [DOI] [PubMed] [Google Scholar]
- 2.Flegal KM, Troiano RP. Changes in the distribution of body mass index of adults and children in the US population. Int J Obes Relat Metab Disord 2000;24:807–18 [DOI] [PubMed] [Google Scholar]
- 3.Ogden CL, Fryar CD, Carroll MD, Flegal KM. Mean body weight, height, and body mass index, United States 1960-2002. Adv Data 2004;347:1–17 [PubMed] [Google Scholar]
- 4.Wang Y, Beydoun MA, Liang L, Caballero B, Kumanyika SK. Will all Americans become overweight or obese? Estimating the progression and cost of the US obesity epidemic. Obesity (Silver Spring) 2008;16:2323–30 [DOI] [PubMed] [Google Scholar]
- 5.Yanovski JA, Yanovski SZ, Sovik KN, Nguyen TT, O'Neil PM, Sebring NG. A prospective study of holiday weight gain. N Engl J Med 2000;342:861–7 [DOI] [PMC free article] [PubMed] [Google Scholar]
- 6.Hull HR, Radley D, Dinger MK, Fields DA. The effect of the Thanksgiving holiday on weight gain. Nutr J 2006;5:29. [DOI] [PMC free article] [PubMed] [Google Scholar]
- 7.Schoeller DA. Insights into energy balance from doubly labeled water. Int J Obes (Lond) 2008;32(suppl 7):S72–5 [DOI] [PubMed] [Google Scholar]
- 8.Forbes GB, Kreipe RE, Lipinski B. Body composition and the energy cost of weight gain. Hum Nutr Clin Nutr 1982;36:485–7 [PubMed] [Google Scholar]
- 9.Subar AF, Kipnis V, Troiano RP, Midthune D, Schoeller DA, Bingham S, Sharbaugh CO, Trabulsi J, Runswick S, Ballard-Barbash R, et al. Using intake biomarkers to evaluate the extent of dietary misreporting in a large sample of adults: the OPEN study. Am J Epidemiol 2003;158:1–13 [DOI] [PubMed] [Google Scholar]
- 10.Trabulsi J, Troiano RP, Subar AF, Sharbaugh C, Kipnis V, Schatzkin A, Schoeller DA. Precision of the doubly labeled water method in a large-scale application: evaluation of a streamlined-dosing protocol in the Observing Protein and Energy Nutrition (OPEN) study. Eur J Clin Nutr 2003;57:1370–7 [DOI] [PubMed] [Google Scholar]
- 11.Schoeller D. Isotope dilution methods. : Björntorp P, Brodoff BN, Obesity. New York, NY: JB Lippincott Co, 1992:80–8 [Google Scholar]
- 12.Racette SB, Schoeller DA, Luke AH, Shay K, Hnilicka J, Kushner RF. Relative dilution spaces of 2H- and 18O-labeled water in humans. Am J Physiol 1994;267:E585–90 [DOI] [PubMed] [Google Scholar]
- 13.Zakeri IF, Adolph AL, Puyau MR, Vohra FA, Butte NF. Multivariate adaptive regression splines models for the prediction of energy expenditure in children and adolescents. J Appl Physiol 2010;108:128–36 [DOI] [PubMed] [Google Scholar]
- 14.Mifflin MD, St Jeor ST, Hill LA, Scott BJ, Daugherty SA, Koh YO. A new predictive equation for resting energy expenditure in healthy individuals. Am J Clin Nutr 1990;51:241–7 [DOI] [PubMed] [Google Scholar]
- 15.Andersson I, Rossner S. The Christmas factor in obesity therapy. Int J Obes Relat Metab Disord 1992;16:1013–5 [PubMed] [Google Scholar]
- 16.Watras AC, Buchholz AC, Close RN, Zhang Z, Schoeller DA. The role of conjugated linoleic acid in reducing body fat and preventing holiday weight gain. Int J Obes (Lond) 2007;31:481–7 [DOI] [PubMed] [Google Scholar]
- 17.Institute of Medicine Dietary Reference Intakes for energy, carbohydrate, fiber, fat, fatty acids, cholesterol, protein, and amino acids. Washington, DC: National Academies Press, 2005 [Google Scholar]
- 18.Racette SB, Weiss EP, Schechtman KB, Steger-May K, Villareal DT, Obert KA, Holloszy JO. Influence of weekend lifestyle patterns on body weight. Obesity (Silver Spring) 2008;16:1826–30 [DOI] [PMC free article] [PubMed] [Google Scholar]
- 19.Schoeller DA. The energy balance equation: looking back and looking forward are two very different views. Nutr Rev 2009;67:249–54 [DOI] [PubMed] [Google Scholar]


