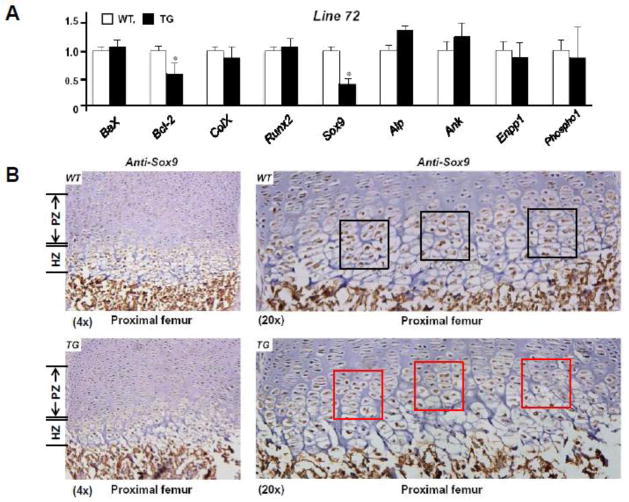
Fig 6. Relevant marker gene expression in Col10α1-TAP63α transgenic mice.
(A). Total RNAs from mouse hind limbs of both line 52 and line 72 were prepared and reverse transcribed for expression analysis using qRT-PCR approach. Illustrated is the relative mRNA level from representative line 72. Bax, Col10a1 and Runx2 in TG mice is similar to that of WT controls. Meanwhile, significant reduction of Bcl-2 (WT vs. TG: 1.00 ± 0.12 vs. 0.62 ± 0.20, n = 7, p < 0.05) and Sox9 (WT vs. TG: 1.00 ± 0.09 vs. 0.42 ± 0.11, n = 7, p < 0.05) transcripts were detected in TG mice compared to the WT littermates. Data ColX: Col10a1. (B). Sagittal sections of proximal femur from both TG and WT mouse limbs at the P1 stage were subjected to immunohistochemistry analysis using anti-Sox9 antibody. Decreased Sox9 expression was observed in the proliferative and hypertrophic zone in TG mice (bottom, left) compared to WT controls (top, left, 4x magnifications). Higher (20x) magnifications of the same panels of images clearly showed less brown staining and signal intensity indicating decreased Sox9 expression in cells of prehypertrophic and hypertrophic zone (bottom, right, red squares) of the TG mice compared to the littermate controls (top, right, black squares). PZ: proliferative zone; HZ: hypertrophic zone.

