Abstract
Footstrike patterns during running can be classified discretely into a rearfoot strike, midfoot strike and forefoot strike by visual observation. However, the footstrike pattern can also be classified on a continuum, ranging from 0–100% (extreme rearfoot to extreme forefoot) using the strike index, a measure requiring force plate data. When force data are not available, an alternative method to quantify the strike pattern must be used. The purpose of this paper was to quantify the continuum of foot strike patterns using an easily attainable kinematic measure, and compare it to the strike index measure. Force and kinematic data from twenty subjects were collected as they ran across an embedded force plate. Strike index and the footstrike angle were identified for the four running conditions of rearfoot strike, midfoot strike and forefoot strike, as well as barefoot. The footstrike angle was calculated as the angle of the foot with respect to the ground in the sagittal plane. Results indicated that the footstrike angle was significantly correlated with strike index. The linear regression model suggested that strike index can be accurately estimated, in both barefoot and shod conditions, in the absence of force data.
INTRODUCTION
There has been a growing interest in the mechanics associated with different footstrike patterns (FSP) during running, especially in light of the suggested relationship between FSP and injury [1–3]. FSPs can be classified into three groups. A rearfoot strike (RFS) is one where the heel hits the ground first, a midfoot strike (MFS) is one where the foot lands flat on the ground and forefoot strike (FFS) is where the ball of the foot first strikes the ground. It has been reported that about 75% of all shod runners are RFS, 24% are MFS, and the remaining 1% are FFS [4,5]. However, barefoot running is almost always associated with a FFS or MFS pattern [6,7].
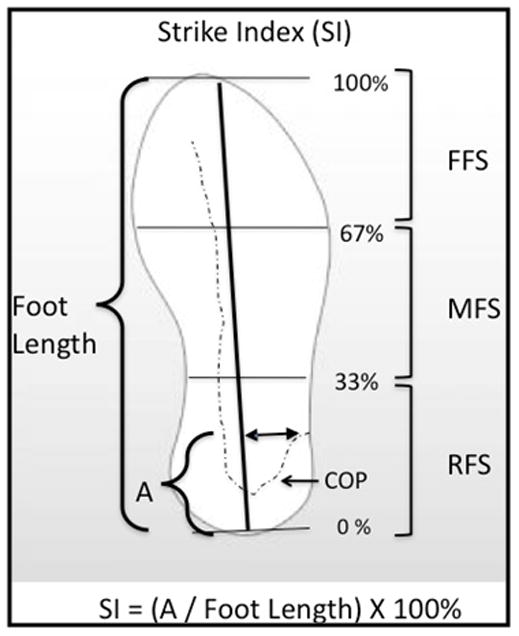
While FSP can be visually classified into one of the three types, it is quantified by the strike index (SI), using a force plate [6]. This is a measure of the location, at initial contact, of the center of pressure (COP) along the long axis of the foot as a percentage of the total foot length. The calculation is detailed in Figure 1. A SI of 0–33% indicates a RFS, 34–67% a MFS, and 68–100% a FFS. Unfortunately, force data are not always available, as in the natural running environment, or when running on a conventional treadmill. The advent of instrumented treadmills does allow the calculation of SI during continuous running. However, these force treadmills inherently introduce more noise to the force data than those force plates that are floor-embedded. This noise adds significant error to the COP calculation, and is especially troublesome when forces are low at initial contact. However, the location of the COP should be related to the orientation of the foot at contact, with a more dorsiflexed position associated with a lower SI. As a result, the angle of the foot segment in the sagittal plane at footstrike may be provide a surrogate measure of SI.
Figure 1.

Calculation of the SI. The location of the COP at initial contact along the longitudinal axis of the foot coordinate system (A), is normalized by the foot length and multiplied by 100 to obtain a percentage of the foot length.
Therefore, the purpose of this study was to determine whether SI can be estimated in the absence of force data, using the kinematic measure of the footstrike angle (FSA) of the foot. It was hypothesized that as FSA increased (towards more of a rearfoot strike) SI would decrease in both barefoot and shod runners across a range of FSP.
METHODS
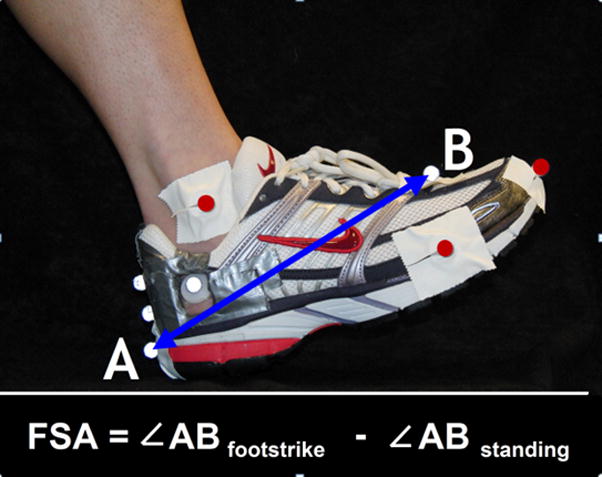
Twenty healthy runners (10 female, 10 male, aged 27.8 ± 8.9 yrs, running 20.7 ± 13.0 mi/week) with various natural FSPs were recruited from the University of Delaware and surrounding community. Each subject had markers placed on their right foot (Figure 2). After subject calibration, anatomical markers were removed. Subjects ran across a force plate (Bertec, Columbus, OH) until 5 trials were collected at 1000 Hz for each condition. Each subject ran utilizing RFS, MFS, FFS and barefoot (BFS) conditions. In the BFS condition, runners were asked to run comfortably, and were not instructed towards a particular FSP. Both kinetic and kinematic data were sampled at 1000 Hz using an 8 camera Nexus system (VICON, Oxford, UK). The high video frame rate was chosen to provide a high temporal resolution for determining FSP.
Figure 2.

Five anatomical (red) and 5 tracking (white) markers on the shoe. The calcaneal tracking markers were placed directly on the rearfoot, and can be seen through cutouts in the rear of the shoe. FSA was calculated as the angle between vector AB and anteroposterior axis in the lab coordinate system. The FSA in resting stance was subtracted from all values such that 0° corresponds with a flat foot.
Data were processed using Visual 3D (C-Motion, Rockville, MD). Marker data were low pass filtered at 8 Hz and force data at 50 Hz. The SI was calculated for each trial as shown in Figure 1, by representing the COP as a percentage of the foot length at footstrike. The FSA was defined as described in Figure 2, by taking the angle of the foot at footstrike and subtracting the angle of the foot during standing. A positive FSA indicated dorsiflexion. The median SI from the 5 trials from each subject was then determined. FSA was calculated at footstrike for each trial. The value from the trial corresponding with the trial containing the median SI was used for analysis. Linear regressions were then conducted between the SI and FSA. All statistics were performed using SPSS Software v.18 (IBM, Somers, NY) with and α ≤ 0.05 as significant. The criteria for determining the MFS pattern classification was established first. This was accomplished by calculating the mean, and standard error of the mean (SEM) of the FSA of the MFSs. Only those trials that were classified by the SI as MFS were used. A MFS was then defined as one that lies within ± 3 SEM. Those less than the mean, minus 3*SEM, were defined as FFS, and those greater than the mean plus 3*SEM were considered RFS.
RESULTS
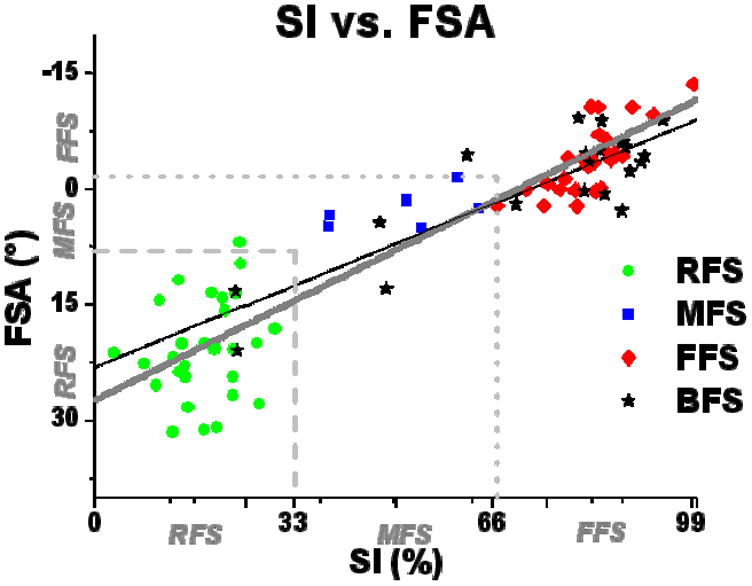
In the shod condition, FSA was strongly correlated with SI, R = 0.92 (p < 0.01). The linear regression model with FSA is shown in equation (1) and Figure 3.
Figure 3.

Regression model of SI vs. FSA. Each of the 20 subjects were tested in all 4 conditions, thus, there are 60 shod data points (20 RFS, 20 MFS and 20 FFS determined by visual inspection), and 20 barefoot data points.
| (1) |
FSA was again strongly correlated with SI in the barefoot condition (R = 0.86, p < 0.01). The linear regression model is shown in Equation (2) and Figure 3.
| (2) |
6 shod and 3 barefoot footstrikes were classified as MFS by the SI. These trials were used to determine criteria for FSP classification. The mean FSA of the 9 total MFS was 3.2°, and the SEM was 1.6°. Therefore, it was determined that a MFS = −1.6°<FSA < 8.0°, a RFS = FSA > 8.0°, and a FFS = FSA < −1.6°.
Of the total 60 shod footstrikes processed (20 RFS, 20 MFS, 20 FFS based on visual determination), the SI indicated that 29 were RFS, 6 were MFS, and 25 were FFS (Table 1). This indicated that 46/60 (77%) FSPs were correctly determined visually when compared to SI data. Using the SI as the gold standard, 28/29 (97%) of the RFS footstrikes, 5/6 (83%) of the MFS footstrikes, and 16/25 (64%) of the FFS were correctly identified with FSA. Overall, 49/60 (82%) of the shod footstrikes were identified correctly using the FSA. When comparing the FSA classifications to visual assessment, 20/20 RFS were correctly identified, 10/20 MFS, and 15/20 FFS. This Indicated that 45/60 (75%) FSA classifications were in agreement with visual classification.
Table 1.
Summary of the classifications using the different methods available for both shod and barefoot trials. Numbers in parentheses are those trials in agreement in terms of classification by SI and by FSA.
| RFS | MFS | FFS | ||
|---|---|---|---|---|
| Shod | Visual | 20 | 20 | 20 |
|
| ||||
| SI | 29 | 6 | 25 | |
|
| ||||
| FSA | 29 (28) | 15 (5) | 16 (16) | |
|
| ||||
| Barefoot | SI | 2 | 3 | 15 |
|
| ||||
| FSA | 0 (0) | 5 (1) | 15 (11) | |
For the barefoot condition, subjects were not instructed in how to land. However, the SI indicated that 2/20 were RFS, 3/20 were MFS, and 15/20 were FFS. When using the prescribed FSA criteria, 0/2 RFS, 1/3 MFS, and 11/15 FFS footstrikes were correctly identified. Overall, 12/20 (60%) of the barefoot footstrikes were identified correctly using the FSA.
DISCUSSION
The purpose of this study was to determine whether FSA could serve as a surrogate for the SI, an established measure of FSP. FSA was found to be a strong predictor of SI for both the shod and barefoot conditions. The FSA data appear to be appropriately partitioned into the correct ranges of SI, as the MFS are centered about 0°, corresponding to foot-flat, and RFS and FFS are in good agreement with the SI and visual determination. This is especially for the shod running. The explained variance by the model was slightly lower in the barefoot condition. The increased motion in the mid and forefoot in the absence of shoes may have added some error to the FSA measure.
Accuracy in visually identifying footstrike pattern was lowest for the MFS. Visual assessment suggested that 20 footstrikes utilized MFS landings. However, when utilizing the gold standard of the SI, only 6 subjects were truly landing with a MFS. This is likely due to the error in trying to visualize a flat landing. Runners with a slight RFS or slight FFS pattern may be deemed a MFS visually. However, it is likely that the overall accuracy of the visual assessment would be improved using slow motion video data easily obtained from a standard video camera. This type of assessment might lead to an even greater ability to determine if one is a RFS, MFS, or FFS runner compared with the FSA method.
The true strength of this FSA measure, however, is that it is an objective, quantifiable, continuous indication of FSP. This method provides the ability to assess gradations of strike patterns, not possible with a subjective visual analysis. In addition, this provides a practical alternative to FSP assessment when force data are not available. Finally, while a motion analysis system was used in this study, this method can be easily translated into community settings. Using only a high-speed video camera and a simple angle extraction program, the continuum of FSPs can be evaluated during races or on treadmills in the clinic.
CONCLUSION
FSA was significantly correlated with SI in both barefoot and shod conditions. These data suggest that FSA is an acceptable measure of FSP when force data are not available for both barefoot and shod runners.
Acknowledgments
Funding: Drayer Physical Therapy Institute, DOD W911NF-05-1-0097, and NIH 1 S10 RR022396.
Footnotes
CONFLICT OF INTEREST
Study sponsors were not involved in the study design, collection, analysis and interpretation of data, writing of the manuscripts or the decision to submit the manuscript for publication.
Publisher's Disclaimer: This is a PDF file of an unedited manuscript that has been accepted for publication. As a service to our customers we are providing this early version of the manuscript. The manuscript will undergo copyediting, typesetting, and review of the resulting proof before it is published in its final citable form. Please note that during the production process errors may be discovered which could affect the content, and all legal disclaimers that apply to the journal pertain.
Contributor Information
Allison R. Altman, Email: aaltman@udel.edu, Biomechanics and Movement Science Program, 301 McKinly Lab, University of Delaware, Newark, DE 19716, (302) 831-4646.
Irene S. Davis, Email: mcclay@udel.edu, Department of Physical Therapy, 301 McKinly Lab, University of Delaware, Newark, DE 19716, Drayer Physical Therapy Institute, 8205 Presidents Drive, Hummelstown, PA 17036, (302) 831-4263.
References
- 1.Williams DS, McClay IS, Manal KT. Lower extremity mechanics in runners with a converted forefoot strike pattern. J App Biomech. 2000;16:210–218. [Google Scholar]
- 2.Milner CE, Ferber R, Pollard CD, Hamill J, Davis IS. Biomechanical factors associated with tibial stress fracture in female runners. MSSE. 2006;38(2):323–328. doi: 10.1249/01.mss.0000183477.75808.92. [DOI] [PubMed] [Google Scholar]
- 3.Pohl MB, Hamill J, Davis IS. Biomechanical and anatomic factors associated with a history of plantar fasciitis in female runners. Clin J Sport Med. 2009;19(5):372–376. doi: 10.1097/JSM.0b013e3181b8c270. [DOI] [PubMed] [Google Scholar]
- 4.Hasegawa H, Yamauchi, Kraemer WJ. Foot strike patterns of runners at the 15-km point during an elite-level half marathon. J Strength Cond Res. 2007;21(3):888–893. doi: 10.1519/R-22096.1. [DOI] [PubMed] [Google Scholar]
- 5.Kerr BA, Beauchamp L, Fisher V, Neil R. Footstrike patterns in distance running. In: Nigg B, Kerr B, editors. Biomechanical aspects of sports shoes and playing surfaces. Calgary: University of Calgary; 1983. pp. 135–141. [Google Scholar]
- 6.Cavanagh PR, Lafortune MA. Ground reaction forces in distance running. J Biomech. 1980;13:397–406. doi: 10.1016/0021-9290(80)90033-0. [DOI] [PubMed] [Google Scholar]
- 7.Lieberman DE, Venkadesan M, Werbel WA, Daod AI, D’Andrea S, Davis IS, Mang’Eni RO, Pitsiladis Y. Foot strike patterns and collision forces in habitually barefoot versus shod runners. Nature. 2010;463(28):531–535. doi: 10.1038/nature08723. [DOI] [PubMed] [Google Scholar]
- 8.Robbins SE, Hanna AM. Running-related injury prevention through barefoot adaptations. Med Sci Sport Exer. 1987;19(2):148–156. [PubMed] [Google Scholar]
- 9.Altman AR, Davis IS. Is midfoot striking during running advantageous over rearfoot or forefoot striking? American Society of Biomechanics. Penn State University; State College, PA: Aug, 2009. [Google Scholar]


