

Abstract
Studies on the pathogenesis of osteoporosis and other metabolic bone diseases would be greatly facilitated by the development of approaches to assess changes in gene expression in osteoblast/osteoprogenitor populations in vivo without the potentially confounding effects of in vitro culture and expansion of the cells. While positive selection to identify a progenitor population in human marrow can be used to select for cells capable of osteoblast differentiation, each of the markers that have been used to identify marrow mesenchymal populations (alkaline phosphatase [AP], Stro-1, CD29, CD49a, CD73, CD90, CD105, CD166, CD44, CD146 and CD271) may be expressed on distinct subsets of marrow mesenchymal cells. Thus, positive selection with one or more of these markers could exclude a possibly relevant cell population that may undergo important changes in various clinical conditions. In the present report, we describe the isolation and characterization of human osteoprogenitor cells obtained by depletion of bone marrow cells of all hematopoietic lineage/hematopoietic stem cells and endothelial/endothelial precursor cells (lin−/CD34/CD31−). The yield of lin−/CD34/CD31− cells from ~10 mL of bone marrow (~ 80 million mononuclear cells) was ~80,000 cells (0.1% of mononuclear cells). While not selected on the basis of expression for the mesenchymal marker, Stro-1, 68% of these cells were Stro-1+. Using linear whole transcriptome amplification followed by quantitative polymerase chain reaction (QPCR) analysis, we also demonstrated that, compared to lin− cells (which are already depleted of hematopoietic cells), lin−/CD34/31− cells expressed markedly lower mRNA levels for the endothelial/hematopoietic markers, CD34, CD31, CD45, and CD133. Lin−/CD34/31− cells were also enriched for the expression of mesenchymal/osteoblastic markers, with a further increase in runx2, osterix, and AP mRNA expression following in vitro culture under osteogenic conditions. Importantly, lin−/CD34/31− cells contained virtually all of the mineralizing cells in human marrow: while these cells displayed robust calcium deposition in vitro, lin−/CD34/31+ cells demonstrated little or no mineralization when cultured under identical osteogenic conditions. Lin−/CD34/31− cells thus represent a human bone marrow population highly enriched for mesenchymal/osteoblast progenitor cells that can be analyzed without in vitro culture in various metabolic bone disorders, including osteoporosis and aging.
Keywords: osteoporosis, metabolic bone disease, bone marrow, bone biopsy, osteoblast
INTRODUCTION
While considerable progress has been made in recent years in the clinical investigation of osteoporosis and other metabolic bone diseases using sophisticated imaging technologies [1, 2] and serum bone biochemical markers [3], there remains an important need to better understand changes in gene expression in osteoblast/osteoblast progenitor populations in vivo in these various conditions. To this end, a number of approaches have been used, including assessment of mRNA expression in human bone biopsies [4] as well as analysis of bone marrow stromal cells following in vitro culture [5]. Each of these approaches has important strengths and limitations. For example, mRNA analysis of bone biopsy samples likely provides information on changes occurring in mature osteoblast/osteocyte populations but are confounded by the fact that the biopsy samples contain a heterogeneous population of cells, including not only osteoblasts and osteocytes, but also significant numbers of hematopoietic and endothelial cells. Bone marrow stromal cultures do represent a more homogeneous population, but the limitation of this approach is that even short term in vitro culture may alter the phenotype or gene expression profile of these cells.
In recent studies, we have used an alternate approach that involves obtaining human bone marrow aspirates followed first by a depletion of hematopoietic lineage cells using a cocktail of antibodies (to CD2, CD3, CD11b, CD14, CD15, CD16, CD19, CD56, CD123, and CD235a [glycophorin A]), thereby depleting the bone marrow cells of mature hematopoietic cells such as T cells, B cells, NK cells, dendritic cells, monocytes, granulocytes, and erythroid cells [6, 7]. Following this negative selection, the hematopoietic lineage negative (lin−) fraction was stained with an antibody to a mesenchymal marker, such as alkaline phosphatase (AP) [7] or Stro-1 [6]. The lin−/AP+ or lin−/Stro-1+ cells were then analyzed, without culturing, for expression of specific genes and pathways. Since the yields of RNA from these limited cell populations was relatively low for in-depth gene expression analyses, we coupled the cell isolation methods to a whole transcriptome linear amplification step that preserved the relative representation of each transcript species in the original sample during and after amplification [8, 9].
While the above approach was useful and provided us insights into effects of estrogen on lin−/Stro-1+ cells [6] and PTH effects on lin−/AP+ cells [7], we recognize several limitations of these isolation methods. First, the hematopoietic cocktail did not include antibodies to CD34 or CD31. These are markers for hematopoietic stem cells or endothelial progenitor cells (CD34) [10, 11] or for more mature endothelial populations (CD31) [12]. Moreover, neither AP nor Stro-1 expression is limited to mesenchymal cells [13–15]. Thus, the lin−/AP+ and the lin−/Stro-1 cells are likely still contaminated by immature hematopoietic and/or endothelial cells. Second, using positive selection to identify a progenitor population in human marrow has its own limitations, as each of the markers that have been used to identify marrow mesenchymal populations (AP, Stro-1, CD29, CD49a, CD73, CD90, CD105, CD166, CD44, CD146 and CD271 [for a review, see [16]) may be expressed on different (and sometimes mutually exclusive) subsets of marrow mesenchymal cells. Thus, positive selection with one or more of these markers may exclude a possibly relevant cell population that may undergo important changes in various clinical conditions.
Recognizing these concerns regarding positive selection for mesenchymal cells, Itoh et al. [17] recently described a method for purifying mesenchymal progenitor cells from mouse marrow using hematopoietic lineage depletion. These purified osteoprogenitors (HipOPs) were enriched for osteoblast differentiation markers and were able to differentiate into osteoblasts in vitro and in vivo. Importantly, however, ~17% of these cells expressed CD34, and the level of CD31 expression was not specified. Consistent with this, the HipOPs contained not only mesenchymal but also hematopoietic precursor cells, and it is possible that a sub-population of endothelial progenitor cells were also present in this population.
In the present report, we describe the isolation and characterization of human bone marrow lin−, CD34 and CD31 negative (lin−/CD34/31−) cells. These lin−/CD34/31− cells represent a population almost completely depleted of all hematopoietic/endothelial lineages and highly enriched for a mesenchymal progenitor population. Our results demonstrate that these cells can be isolated and analyzed without in vitro culture and may thus represent a useful population to employ in future clinical-investigative studies of osteoporosis, age-related bone loss, and other metabolic bone diseases.
MATERIALS AND METHODS
Experimental subjects
Bone marrow aspirates and small bone biopsies were obtained from healthy female volunteers between the ages of 29 and 83 years. For the aspirates, we used a 15 gauge needle, being careful to rotate the needle after every 2 mL of marrow aspiration in order to minimize contamination by peripheral blood. For the biopsies, we used an 8 gauge needle, attempting to obtain as much cortical bone as possible with associated trabecular elements. Exclusion criteria were: 1) use of bisphosphonates, estrogen (oral or transdermal), raloxifene, or PTH (or other bone-active drugs) in the past 3 years; 2) history of Paget’s disease, other metabolic bone disease, diabetes, or significant cardiac, renal, or liver disease; 3) history of any fracture within the past 5 years; 4) hysterectomy; 5) abnormalities in the screening laboratory studies. The study was approved by the Mayo Institutional Review Board and all subjects provided written, informed consent prior to the study.
Hematopoietic lineage depletion and isolation of lin−/CD34/31− cells
Bone marrow cells were initially subjected to Ficoll gradient centrifugation for mononuclear (MNC) cell enrichment. Depletion of mature hematopoietic cells such as T cells, B cells, NK cells, dendritic cells, monocytes, granulocytes, erythroid cells, and their committed precursors was accomplished by MACS (Miltenyi) using a lineage negative selection cocktail (Miltenyi) containing biotin-conjugated antibodies to CD2, CD3, CD11b, CD14, CD15, CD16, CD19, CD56, CD123, and CD235a (glycophorin A). The MACS sorted lin− cells were subsequently incubated with PE conjugated CD34 and CD31 antibodies (BD Biosciences) in the dark at 4C for 30 minutes. The two cell populations lin−/CD34/CD31− and lin−/CD34/CD31+ were isolated by fluorochrome activated cell sorting (FACS). The fluorescence threshold was set based on excluding the highly fluorescent CD34/CD31 population, and the same fluorescence threshold for CD34/CD31 was used in all of the analyses.
Costaining for CD45 and Stro-1
To determine the coexpression level of the hematopoietic cell marker CD45 in the different cell populations, lin−/CD34/CD31+ and lin−/CD34/CD31− cells were isolated as described above. In addtion, MACS sorted lin+ cells were used as a comparison. The cells were incubated with a FITC conjugated monoclonal CD45 antibody for 30 minutes in the dark at 4C. Coexpression for the osteoblastic marker, Stro-1, was determined by using a specific Stro-1-IgM antibody (R & D Systems) which was subsequently incubated with a FITC conjugated anti-IgM antibody (R & D Systems). The samples were run on BD FACScan and analyzed using CellQuest Pro. For CD45, the fluorescence threshold was set based on the lin+ cells, excluding the highly fluorescent CD45+ cells. Since Stro-1 did not identify a clearly distinct population of cells as positive, an IgM isotype control antibody (AbD Serotec) was used to set the fluorescence threshold.
Processing of bone biopsies
The bone biopsies were immediately placed in lysis buffer (QIAzol, Qiagen) and subjected to homogenization using a variable speed homogenizer (Tissue Tearor, Cole-Parmer).
Gene expression analysis
Total RNA from the various sorted cell populations and bone biopsies was isolated using microfuge columns (MicroColumns, Qiagen). DNase treatment to digest all genomic DNA that could lead to false positive gene expression results was done following RNA isolation using Turbo DNA-free DNase (Ambion). RNA quality and purity was confirmed with a Nanodrop spectrophomtometer (Thermo Scientific). Since the overall number of the various cell populations was limited (generally < 100,000 cells) for the performance of in-depth gene expression analyses, we used the WT-OvationTM Pico RNA whole transcriptome amplification system (NuGen Technologies, Inc) to synthesize μg quantities of amplified cDNA starting with total RNA input of ~50 ng. In this linear amplification system, the relative representation of each transcript species in the original sample is maintained during and after amplification [8, 9].
For the QPCR analyses, we designed primers using the Primer Express program (Applied Biosystems). Primer sequences for any of the genes analyzed in this report are available on request. The PCR reactions were run in the ABI Prism 7900HT Real time System (Applied Biosystems) using SYBR Green (Qiagen) as the detection method. Normalization for variations in input RNA was performed using a panel of 10 housekeeping genes (18S, G6PDH, GAPDH, HPRT, L13a, RPII, TBP, α-tubulin, β2-microglobulin, β-actin) with the geNorm algorithm (http://medgen.ugent.be/~jvdesomp/genorm/) [18, 19] used to select the 3–4 most stable housekeeping genes from the 10 on the plate. The PCR Miner algorithm [20] was used to correct for variations in amplification efficiencies.
μCT analysis of bone biopsies
The bone biopsy samples were frozen immediately in liquid nitrogen. μCT imaging was performed using a cryostatic μCT instrument (Kantor 2002) which allows for the tissue samples to be scanned while frozen (in order to allow subsequent RNA extractions). The entire length of the bone biopsies were scanned by placing them on a computer-controlled rotation stage. Samples were scanned with a cubic voxel size of 20 μm and analyzed using the ANALYZE © software package (ANALYZE 9.0).
In vitro mineralization assay
Post-Ficoll, MACS-sorted lin+ and lin− and FACS-sorted lin−/CD34/CD31− and lin−/CD34/CD31+ cells were cultured at a density of 1 × 10⁵ per 0.32 cm2 (96-well plates) in 100 μl of media containing phenol red-free αMEM, 15% FBS and 1% penicillin–streptomycin mixture (Growth media), all obtained from Invitrogen, for 3 days. Subsequently, 100 μl of 2x osteogenic differentiation media containing growth media, 100 μM ascorbic acid, 2 mM dexamethasone and 20 mM β-glycerolphosphate was added per well. At day 3, 6, and 9 following addition of differentiation media, 100 μl of media was removed per well and replaced with 100 μl of 2x osteogenic media. Complete media changes were performed on days 12, 15 and 18. Cells were fixed in 10% formalin and stained for calcium deposits using 2% alizarin red at day 21.
In vitro adipogenesis assay
FACS-sorted lin−/CD34/CD31− cells were cultured at a density of 1 × 10⁵ per 0.32 cm2 (96-well plates) in 200 μl of growth media for 10 days. A half the media was change was done every 3–4 days. Subsequently, half of the media was removed and replaced with 100 μl of 2x adipogenic differentiation medium containing growth media and 2 μM pioglitazone. Every 3 days thereafter, media was replaced with fresh 1x adipogenic media. At 21 days the cells were fixed in 10% formalin, and then stained for fat deposits using Oil Red O (Sigma).
In vitro cultures for gene expression analysis
Lin−/CD34/CD31− cells were cultured in growth media with media changes every 3 days until 70% confluency. Passage 2 cells were seeded a density of 2 × 10⁵ per 0.75 cm2 (48-well plates). The following day, growth media was replaced with 1x osteogenic differentiation media, and media was then changed every 3 days. Cells were trypsinized at day 10 and RNA was extracted and gene expression analysis preformed as described above.
Statistical Analyses
Data are presented either as mean ± SEM (Figure 7) or, when the data were not normally distributed (Tables 1 and 2) as median, interquartile range (25th–75th percentile). Parametric comparisons were performed using t-tests; non-parametric comparisons were performed using the rank sum test. P < 0.05 was considered significant.
Figure 7.

Expression of bone-related genes in lin−/CD34/31− cells cultured in osteogenic conditions for 10 days. Data are indicated as mean ± SEM (n = 3) and compared to the level of each transcript in freshly sorted lin−/CD34/CD31− cells (assigned a value of 1.0, dashed horizontal line). *P < 0.05 and **P < 0.01 versus freshly sorted lin−/CD34/CD31− cells.
Table 1.
Expression of hematopoietic/endothelial, mesenchymal, and osteoblast markers in lin−, lin−/CD34/CD31+, lin−/CD34/CD31− cells as well as in bone biopsy samples. Data are median, interquartile (25th–75th percentile) range of 9 independent subject samples (except for the bone biopsy data, which was available in a subset of 3 subjects).
| Gene | lin− | lin−/CD34/CD31+ | lin−/CD34/CD31− | Bone biopsy | |
|---|---|---|---|---|---|
| Hematopoietic/ | CD34 | 1.0 (0.57,2.52) | 0.46 (0.01,7.6) | 0.01 (0,0.01)** | 0.94 (0.88,1.63) |
| Endothelial | CD31 | 1.0 (0.85,1.13) | 0.97 (0.61,1.3) | 0.08 (0.05,0.20)** | 2.1 (2.0,2.3)* |
| CD45 | 1.0 (0.97,1.05) | 1.09 (1.0,1.4) | 0.26 (0.21,0.3)** | 3.3 (2.9,3.6)* | |
| CD133 | 1.0 (0.59,1.36) | 0.67 (0.29,2.8) | 0.02 (0.01,0.08)** | 0.44 (0.41,0.5)* | |
| Mesenchymal | VCAM1 | 1.0 (0.86,1.0) | 0.08 (0,0.17)** | 2.7 (1.1,5.0)# | 325 (294,361)* |
| CD71 | 1.0 (0.35,1.7) | 0.41 (0.31,1.2) | 1.9 (1.15,4.9) | 1.84 (1.48,3.64) | |
| CD73 | 1.0 (0.01,11) | 0.02 (0.01,10) | 12 (1.2,34) | 709 (572,975)* | |
| CD146 | 1.0 (0.67, 1.95) | 4.7 (0.83, 168) | 6.7 (1.1, 98.2) | 19,693 (17449,26396)* | |
| Osteoblast Markers | AP | 1.0 (0.01,16) | 0.01 (0,0.02) | 48 (0.02,105)# | 1,215 (752,1444)* |
| Col1α1 | 1.0 (0.02,2.0) | 0.14 (0,0.47) | 19 (15.3,23.8)* | 58,635 (33081,188139)* | |
| Col1α2 | 1.0 (0.65,2.0) | 0.08 (0,0.71) | 5.2 (4.3,26)* | 1,062 (751,2666)* | |
| Runx2 | 1.0 (0.8,1.1) | 1.04 (0.82,1.26) | 0.09 (0.08,0.34)** | 1.09 (1.04,1.39) | |
| Osterix | 1.0 (0.9, 1.33) | 0.99 (0.52, 1.2) | 7.3 (0.7, 1883) | 168,313 (104982,228269)* | |
| Osteocalcin | 1.0 (0.92,1.05) | 1.26 (0.83,2.53) | 0.95 (0.54,1.06)# | 38.7 (25.2,64.8)* |
P=0.055,
P<0.05,
P<0.01 versus lin− cells
Table 2.
Expression of hematopoietic/endothelial, mesenchymal, and osteoblast markers in lin−/CD34/CD31− (n = 5) versus lin−/Stro-1+ cells (n = 6). Data are median, interquartile (25th–75th percentile).
| Gene | lin−/CD34/CD31− | lin−/Stro-1+ | |
|---|---|---|---|
| Hematopoietic/ | CD34 | 1.0 (0.70, 2.04) | 177 (84, 310) |
| Endothelial | CD31 | 1.0 (0.75, 1.09) | 2.21 (2.11, 2.50) |
| CD45 | 1.0 (0.99, 1.29) | 3.05 (2.44, 4.14) | |
| CD133 | 1.0 (0.73, 6.11) | 30.7 (19.4, 38.7) | |
| Mesenchymal | VCAM1 | 1.0 (0.07, 1.24) | 0.11 (0.07, 0.13)* |
| CD71 | 1.0 (0.78, 1.28) | 0.26 (0.14, 0.37)** | |
| CD73 | 1.0 (0.03, 1.73) | 0.08 (0.03, 0.36)# | |
| CD146 | 1.0 (0, 36.2) | 0.04 (0, 0.93)* | |
| Osteoblast Markers | AP | 1.0 (0, 2.13) | 0.02 (0.01, 0.06)# |
| Col1α1 | 1.0 (0.05, 1.07) | 0.17 (0.04, 0.37)* | |
| Col1α2 | 1.0 (0.06, 1.15) | 0.07 (0.05, 0.13)* | |
| Runx2 | 1.0 (0.36, 1.17) | 1.58 (1.42, 1.73) | |
| Osterix | 1.0 (0.82, 98.2) | 0.66 (0.63, 0.70)** | |
| Osteocalcin | 1.0 (0.69, 2.45) | 1.72 (0.68, 2.05) |
P=0.055,
P<0.05,
P<0.01
RESULTS
Following lin depletion, the cells were first stained with a combination of CD34 and CD31−PE antibodies to select both lin−/CD34/CD31− and lin−/CD34/CD31+ populations (note that based on this selection, lin−/CD34/CD31− cells were negative for both CD34 and CD31, and the lin−/CD34/CD31+ cells were positive for either CD34 or CD31, Figure 1). The yield of lin−/CD34/CD31− cells from ~10 mL of bone marrow (~ 80 million mononuclear cells) was ~80,000 cells (0.1% of mononuclear cells). Next, the expression of the hematopoietic marker, CD45, was examined in lin+, lin−/CD34/CD31−, and lin−/CD34/CD31+ cells. As shown in Figure 2A, the majority (55.5%) of bone marrow lin+ cells expressed CD45. Previous studies [21] have shown that the lin+/CD45− cells (44.5% in Figure 2A) represent erythroid precursors that are glycophorin A+ and hence selected by the lin cocktail of antibodies (see Materials and Methods). Greater than 97% of the lin−/CD34/CD31− cells were CD45− (Figure 2B), whereas ~16% of lin−/CD34/CD31+ cells did express CD45 (Figure 2C).
Figure 1.

FACS for obtaining lin−/CD34/CD31− cells. Post-Ficoll bone marrow mononuclear cells were first subjected to hematopoietic lineage depletion using MACS (see Methods). The lin− cells were then stained with antibodies to CD34 and CD31, both labeled with PE. Shown is the PE fluorescence intensity versus forward scatter (a measure of cell size). The fluorescence threshold was set based on excluding the highly fluorescent CD34/CD31 population, and the same fluorescence threshold for CD34/CD31 was used in all of the analyses.
Figure 2.

(A) lin+, (B) lin−/CD34/CD31−, and (C) lin−/CD34/CD31+ cells stained with a CD45-FITC antibody. The fluorescence threshold was set based on the lin+ cells, excluding the highly fluorescent CD45+ cells.
Since Stro-1 is an established mesenchymal/osteoprogenitor marker [15], we further examined whether the lin−/CD34/CD31− cells expressed the Stro-1 epitope. As shown in Figure 3, 68% of the lin−/CD34/CD31− cells co-stained with the Stro-1 antibody. Interestingly, consistent with previous reports [22], the lin−/CD34/CD31−/Stro-1+ cells were relatively large cells (greater forward scatter) as compared to the lin−/CD34/CD31−/Stro-1− cells, suggesting that these may represent two distinct subpopulations of the lin−/CD34/CD31− cells.
Figure 3.
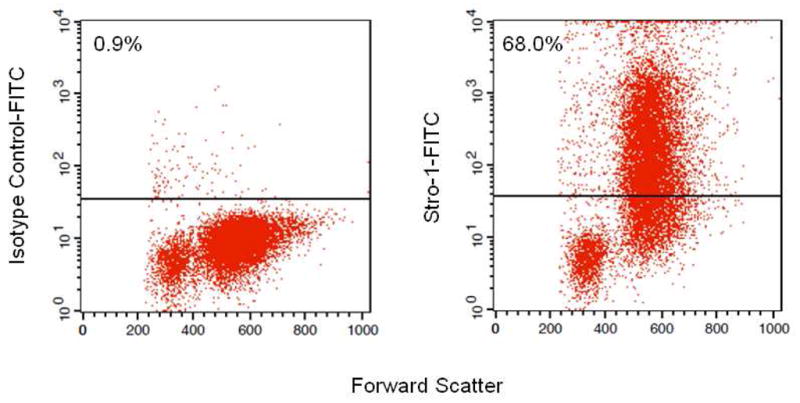
lin−/CD34/CD31− cells stained with either (A) an isotype control antibody or (B) the Stro-1 antibody.
In further studies, we assessed the expression of hematopoietic/endothelial, mesenchymal, and osteoblastic markers in bone marrow lin−, lin−/CD34/CD31+, and lin−/CD34/31− cells from 9 independent subjects (see Materials and Methods, Table 1). Consistent with the flow cytometry data, lin−/CD34/CD31− cells had markedly lower mRNA levels for the hematopoietic/endothelial markers, CD34, CD31, CD45, and CD133, as compared to the lin− cells. Expression of these markers was similar in lin− and lin−/CD34/CD31+ cells. The mesenchymal markers, VCAM1, CD71, CD73, and CD146 were expressed at higher levels in the lin−/CD34/CD31− cells as compared to the lin− cells, although this approached statistical significance (P = 0.055) only for VCAM1, which was also clearly suppressed in the lin−/CD34/CD31+ cells as compared to the lin− cells. The lin−/CD34/CD31− cells did express markedly higher mRNA levels of AP, col1α1, and col1α2 as compared to lin− cells, whereas all of these genes were suppressed in the lin−/CD34/CD31+ cells. Interestingly, despite the expression of these genes associated with the osteoblast phenotype in lin−/CD34/CD31− cells, the expression of runx2 in these cells was lower than in lin− or lin−/CD34/CD31+ cells, suggesting that runx2 mRNA levels in the lin−/CD34/CD31− cells may not reflect the activity of runx2 in these cells. Osterix mRNA levels were highly variable in the lin−/CD34/CD31− cells; thus, while the median level of osterix expression was over 7-fold higher in lin−/CD34/CD31− cells than in the lin− cells, this did not achieve statistical significance. Osteocalcin mRNA levels tended to be similar in the 3 groups of cells.
Table 1 also shows the expression levels of the various genes in bone biopsies obtained in a subset of 3 subjects where we obtained consent for the biopsies. These biopsies were much smaller than the traditional trephine bone biopsies commonly obtained [23], measuring ~2–3 mm in diameter and ~2 cm in length. Figure 4 shows a μCT image of one of the biopsies, which contained a mixture of cortical and trabecular bone. Since these bone samples were directly analyzed without attempting to sort for mesenchymal cells, as shown in Table 1, there was significant contamination of the samples with hematopoietic/endothelial cells. Thus, as compared to lin−/CD34/CD31− cells, mRNA levels in the biopsy samples for CD34, CD31, CD45, and CD133 were 94-fold, 26-fold, 13-fold, and 22-fold higher, respectively. Nonetheless, reflecting the much more mature osteoblastic cells present in the bone biopsies as compared to those present in the lin−/CD34/CD31− population, all of the osteoblast markers were markedly higher in the bone biopsy samples as compared to the lin−/CD34/CD31− cells (e.g., expression of col1α1 and col1α2 was >3000-fold and >200-fold higher in the bone biopsy samples as compared to the lin−/CD34/CD31− cells, Table 1).
Figure 4.

μCT analysis of a bone biopsy used in the present study. Please see Methods for details of the μCT analysis.
Since a significant proportion (68%) of the lin−/CD34−/CD31− cells were also Stro-1+, it was of interest to compare the expression of the above genes in the lin−/CD34−/CD31− cells from the present study to lin−/Stro-1+ from our recent study examining the effects of estrogen on the lin−/Stro-1+ cells [6]. Note that rather than further negative selection for CD34 and CD31 following lin depletion, the lin−/Stro-1+ cells were positively selected for Stro-1 expression [6]. As shown in Table 2, relative to the lin−/CD34/CD31− cells, lin−/Stro-1+ cells did express higher levels of the hematopoietic markers, CD34, CD31, CD45, and CD133, although due to the relative small sample size and variability in expression of these markers in the lin−/Stro-1+ cells, these differences were not statistically significant. However, lin−/Stro-1+ cells clearly expressed significantly lower levels of the mesenchymal and osteoblast markers as compared to the lin−/CD34/CD31− cells (Table 2).
Figure 5 shows results of a mineralization assay using the various cell populations from the same subject. At the seeding density used (100,000 cells per 0.32 cm2), there was virtually no mineralization evident in post-Ficoll bone marrow mononuclear cells. However, lin depletion resulted in clear mineralization in the lin− cells, with little or no mineralization evident in the lin+ cells. Further, robust mineralization was evident in the lin−/CD34/CD31− cells, with little or no mineralization present in the lin−/CD34/CD31+ cells. Figure 6A shows a higher power view of the mineral deposition by the lin−/CD34/CD31− cells cultured under osteogenic conditions. In addition, when cultured under adipogenic condition, lin−/CD34/CD31− cells were also able to differentiate into adipocytes (Figure 6B).
Figure 5.

Sequentially sorted cell populations (100,000 cells/well in a 96 well plate) from the same patient cultured for 21 days in osteogenic conditions and then stained with Alizarin Red.
Figure 6.

(A) Higher power view (20×) of lin−/CD34/CD31− cells cultured under osteogenic conditions for 21 days; (B) Oil-Red O staining of lin−/CD34/CD31− cells cultured in adipogenic conditions for 21 days.
We also examined changes in bone-related gene expression in lin−/CD34/CD31− cells cultured under osteogenic conditions. As shown in Figure 7, culture of lin−/CD34/31− under osteogenic conditions for 10 days resulted in significant upregulation of runx2 mRNA as well as the mRNAs for osterix and AP. Col1α1 mRNA levels decreased slightly, whereas col1α2 mRNA levels increased slightly, with no significant change in the osteocalcin mRNA levels. Collectively, these data demonstrate that the lin−/CD34/31− cells are CD45−, highly enriched for Stro-1+ cells, depleted of hematopoietic/endothelial markers, enriched for mesenchymal/osteoblast markers, and contain virtually all of the cells in human bone marrow capable of in vitro mineralization.
DISCUSSION
In the present study, we describe and validate a method for negative selection of human bone marrow cells to enrich for mesenchymal/osteoblast progenitor cells. This involves magnetic cell sorting to deplete hematopoietic lineage (lin) cells followed by FACS sorting to isolate lin−/CD34/31− cells, which are further depleted for endothelial precursor/endothelial cells as well as for hematopoietic stem cells. These lin−/CD34/31− cells (~80,000 cells from 10 mL of bone marrow) can then be used, without in vitro culture, for studies of gene expression either using QPCR directly or, if a larger number of genes/pathways need to be interrogated, by whole transcriptome linear amplification followed by QPCR analysis.
Lin−/CD34/CD31− cells were largely (>97%) negative for expression of the pan-hematopoietic marker, CD45, even though we did not use a CD45 depletion protocol. We chose to perform a lin depletion for mature hematopoietic markers rather than a CD45 depletion for several reasons. First, erythroid precursors are CD45−, and a simple CD45 depletion would not eliminate this population, whereas the lin cocktail contains a glycophorin A antibody that does deplete erythroid cells. More importantly, however, while human osteoprogenitor cells are clearly CD45− following in vitro culture, there is evidence that prior to culture, these precursor cells may express low levels of CD45 (described as having a CD45med,low phenotype) [21]. Thus, depending on how stringent of a CD45 depletion is performed, it is possible that a MACS or FACS step that removes cells expressing even low levels of CD45 would eliminate a subset of mesenchymal/osteoprogenitor cells.
Even though we did not select specifically for Stro-1+ cells, a high proportion (68%) of lin−/CD34/31− cells were Stro-1+. The Stro-1 antibody is produced by one of several hybridomas that were generated by immunizing mice intrasplenically with human bone marrow cells [15]. Additional studies defined the Stro-1 antibody as of the IgM isotype and reacting with marrow stromal cells in the adherent layer of long-term bone marrow cultures [15]. Stro-1 has been used predominantly for flow cytometry analysis and, to a much lessor extent, for immunocytochemical staining of candidate marrow stromal cells. Although the first report of the Stro-1 antibody was 20 years ago [15], the Stro-1 antigen remains unidentified, but this antibody is still one of the most widely recognized markers for MSCs [24]. It is important to note, however, that expression of Stro-1 is not limited to mesenchymal cells; thus, erythroid (glycophorin A+) cells also express Stro-1, as do a subset of bone marrow CD34+ as well as peripheral blood CD20+ cells (B-cells) [15]. In addition to Stro-1, as noted earlier, a number of other potential markers for mesenchymal/osteoprogenitor cells (AP, CD29, CD49a, CD73, CD90, CD105, CD166, CD44, CD146 and CD271 [for a review, see [16]) have been described, which may or may not overlap with Stro-1+ cells. The advantage, therefore, of the negative selection process described here is that it likely includes cells expressing these other markers. However, we did not examine the proportion of lin−/CD34/31− cells expressing each of the above markers, and further studies are needed to address this issue.
We also compared gene expression by lin−/CD34/CD31− cells with lin−/Stro-1+ cells from a subset of patients from a previous study [6]. It was of interest that negative selection using the hematopoietic/endothelial markers resulted in the lin−/CD34/CD31− cells having generally lower levels of expression of hematopoietic markers and higher levels of expression of mesenchymal and osteoblast markers as compared to lin−/Stro-1+ cells. These data suggest that the negative selection approach described here may provide a better enrichment for mesenchymal/osteoprogenitor cells than positive selection for Stro-1 expression, likely due to the further exclusion of contaminating hematopoietic/endothelial cells.
As compared to the lin− cells (which are already depleted of hematopoietic cells), lin−/CD34/31− cells expressed markedly lower mRNA levels of the endothelial/hematopoietic markers, CD34, CD31, CD45, and CD133. By contrast, lin−/CD34/31− cells were enriched for mRNAs for mesenchymal markers, particularly VCAM1. These findings are consistent with previous work by Gronthos and colleagues [25], who described a Stro-1+/VCAM1+ bone marrow population as being highly enriched for osteoprogenitor cells [25]. Relative to the lin− cells, lin−/CD34/31− cells also expressed high levels of mRNAs for AP, col1α1, and col1α2. Interestingly, runx2 mRNA levels were relatively low in the lin−/CD34/31− cells as compared to the lin− cells, suggesting that, as has been previously described, the level of runx2 mRNA expression may not reflect runx2 activity in these cells [26]. Nonetheless, following 10 days of in vitro culture under osteogenic conditions, there was a significant upregulation in the mRNAs for runx2, osterix, and AP in these cells. Finally, lin−/CD34/31− cells contained all of the cells in human marrow capable of subsequent mineralization. Our findings also demonstrate that in addition to mineralization, lin−/CD34/CD31− cells were also capable of adipocytic differentiation under the appropriate conditions.
In summary, using a negative selection method, we have characterized a lin−/CD34/31− cell population from human marrow that is highly enriched for mesenchymal/osteoprogenitor cells. Based on the yield of these cells, they can be used, without in vitro culture, for studies of gene expression either using QPCR directly or, if a larger number of genes/pathways need to be interrogated, by whole transcriptome linear amplification followed by QPCR analysis. Moreover, a similar approach could also be used to isolate enriched populations of mature osteoblast/osteocyte populations from human bone biopsies. Further studies applying these methods in patients with osteoporosis, age-related bone loss, or other metabolic bone diseases may provide novel insights into the pathogenesis of these conditions.
Highlights.
We describe the isolation and characterization of human osteoprogenitor cells using a negative selection protocol (hematopoietic lineage [lin] −/CD34/CD31− cells).
lin−/CD34/CD31− cells were enriched for expression of mesenchymal/osteoblast markers and capable of mineralization.
lin−/CD34/CD31− cells can be analyzed without in vitro culture in various metabolic bone disorders, including osteoporosis and aging.
Acknowledgments
Funding: This work was supported by NIH Grants AG004875 and UL1-RR24150 (Center for Translational Science Activities).
Footnotes
The authors have no conflicts of interest
Publisher's Disclaimer: This is a PDF file of an unedited manuscript that has been accepted for publication. As a service to our customers we are providing this early version of the manuscript. The manuscript will undergo copyediting, typesetting, and review of the resulting proof before it is published in its final citable form. Please note that during the production process errors may be discovered which could affect the content, and all legal disclaimers that apply to the journal pertain.
References
- 1.Genant HK, Engelke K, Prevrhal S. Advanced CT bone imaging in osteoporosis. Rheumatology (Oxford) 2008;47:iv9–16. doi: 10.1093/rheumatology/ken180. [DOI] [PMC free article] [PubMed] [Google Scholar]
- 2.Majumdar S. Magnetic resonance imaging for osteoporosis. Skeletal Radiol. 2008;37:95–97. doi: 10.1007/s00256-007-0412-5. [DOI] [PubMed] [Google Scholar]
- 3.Leeming DJ, Alexandersen P, Karsdal MA, Qvist P, Schaller S, Tanko LB. An update on biomarkers of bone turnover and their utility in biomedical research and clinical practice. Eur J Clin Pharmacol. 2006;62:781–792. doi: 10.1007/s00228-006-0174-3. [DOI] [PubMed] [Google Scholar]
- 4.Patsch JM, Kohler T, Berzlanovich A, Muschitz C, Bieglmayr C, Roscher P, Resch H, Pietschmann P. Trabecular bone microstructure and local gene expression in iliac creast biopsies of men with idiopathic osteoporosis. J Bone Miner Res. 2011;26:1584–1592. doi: 10.1002/jbmr.344. [DOI] [PubMed] [Google Scholar]
- 5.Zhou S, Greenberger JS, Epperly MW, Goff JP, Adler C, Leboff MS, Glowacki J. Age-related intrinsic changes in human bone marrow-derived mesenchymal stem cells and their differentiation to osteoblasts. Aging Cell. 2008;7:335–343. doi: 10.1111/j.1474-9726.2008.00377.x. [DOI] [PMC free article] [PubMed] [Google Scholar]
- 6.Modder UI, Roforth MM, Hoey K, McCready LK, Peterson JM, Monroe DG, Oursler MJ, Khosla S. Effects of estrogen on osteoprogenitor cells and cytokines/bone regulatory factors in postmenopausal women. Bone. 2011;49:202–207. doi: 10.1016/j.bone.2011.04.015. [DOI] [PMC free article] [PubMed] [Google Scholar]
- 7.Drake MT, Srinivasan B, Modder UI, Ng AC, Undale AH, Roforth MM, Peterson JM, McCready LK, Riggs BL, Khosla S. Effects of intermittent parathyroid hormone treatment on osteoprogenitor cells in postmenopausal women. Bone. 2011;49:349–355. doi: 10.1016/j.bone.2011.05.003. [DOI] [PMC free article] [PubMed] [Google Scholar]
- 8.Dafforn A, Chen P, Deng G, Herrler M, Iglehart D, Koritala S, Lato S, Pillarsietty S, Purohit R, Wang M, Wang S, Kurn N. Linear mRNA amplification from as little as 5ng total RNA for global gene expression. Biotechniques. 2004;37:854–857. doi: 10.2144/04375PF01. [DOI] [PubMed] [Google Scholar]
- 9.Nygaard V, Hovig E. Options available for profiling small samples: a review of sample amplification technology when combined with microarray profiling. Nucleic Acids Res. 2006;34:996–1014. doi: 10.1093/nar/gkj499. [DOI] [PMC free article] [PubMed] [Google Scholar]
- 10.Taichman RS. Blood and bone: two tissues whose fates are intertwined to create the hematopoietic stem-cell niche. Blood. 2005;105:2631–2639. doi: 10.1182/blood-2004-06-2480. [DOI] [PubMed] [Google Scholar]
- 11.Asahara T, Murohara T, Sullivan A, Silver M, van der Zee R, Li T, Witzenbichler B, Schatteman GC, Isner JM. Isolation of putative progenitor endothelial cells for angiogenesis. Science. 1997;275:964–967. doi: 10.1126/science.275.5302.964. [DOI] [PubMed] [Google Scholar]
- 12.Urbich C, Dimmeler S. Endothelial progenitor cells: characterization and role in vascular biology. Circ Res. 2004;95:343–353. doi: 10.1161/01.RES.0000137877.89448.78. [DOI] [PubMed] [Google Scholar]
- 13.Hossain A, Jung LK. Expression of bone specific alkaline phosphatase on human B cells. Cell Immunol. 2008;253:66–70. doi: 10.1016/j.cellimm.2008.05.001. [DOI] [PubMed] [Google Scholar]
- 14.Heinemann DE, Siggelkow H, Ponce LM, Viereck V, Wiese KG, Peters JH. Alkaline phosphatase expression during monocyte differentiation. Overlapping markers as a link between monocytic cells, dendritic cells, osteoclasts and osteoblasts. Immunobiology. 2000;202:68–81. doi: 10.1016/S0171-2985(00)80054-6. [DOI] [PubMed] [Google Scholar]
- 15.Simmons PJ, Torok-Storb B. Identification of stromal cell precursors in human bone marrow by novel monoclonal antibody, STRO-1. Blood. 1991;78:55–62. [PubMed] [Google Scholar]
- 16.Undale AH, Westendorf JJ, Yaszemski MJ, Khosla S. Mesenchymal stem cells for bone repair and metabolic bone diseases. Mayo Clin Proc. 2009;84:893–902. doi: 10.4065/84.10.893. [DOI] [PMC free article] [PubMed] [Google Scholar]
- 17.Itoh S, Aubin JE. A novel purification method for multipotential skeletal stem cells. J Cell Biochem. 2009;108:368–377. doi: 10.1002/jcb.22262. [DOI] [PubMed] [Google Scholar]
- 18.Radonic A, Thulke S, Mackay IM, Landt O, Siegert W, Nitsche A. Guideline to reference gene selection for quantitative real-time PCR. Biochem Biophys Res Commun. 2004;313:856–862. doi: 10.1016/j.bbrc.2003.11.177. [DOI] [PubMed] [Google Scholar]
- 19.Vandesompele J, De Preter K, Pattyn F, Poppe B, Van Roy N, De Paepe A, Speleman F. Accurate normalization of real-time quantitative RT-PCR data by geometeric averaging of multiple internal control genes. Genome Biol. 2002;3:research0034. doi: 10.1186/gb-2002-3-7-research0034. 1-0-34. 11. [DOI] [PMC free article] [PubMed] [Google Scholar]
- 20.Zhao S, Fernald RD. Comprehensive algorithm for quantitative real-time polymerase chain reaction. J Comput Biol. 2005;12:1047–1064. doi: 10.1089/cmb.2005.12.1047. [DOI] [PMC free article] [PubMed] [Google Scholar]
- 21.Deschaseaux F, Gindraux F, Saadi R, Obert L, Chalmers D, Herve P. Direct selection of human bone marrow mesenchymal stem cells using an anti-CD49a antibody reveals their CD45med, low phenotype. Br J Haematol. 2003;122:506–517. doi: 10.1046/j.1365-2141.2003.04469.x. [DOI] [PubMed] [Google Scholar]
- 22.Shi S, Gronthos S. Perivascular niche of postnatal mesenchymal stem cells in human bone marrow and dental pulp. J Bone Miner Res. 2003;18:696–704. doi: 10.1359/jbmr.2003.18.4.696. [DOI] [PubMed] [Google Scholar]
- 23.Hodgson SF, Johnson KA, Muhs JM, Lufkin EG, McCarthy JT. Outpatient percutaneous biopsy of the iliac crest: methods, morbidity, and patient acceptance. Mayo Clin Proc. 1986;61:28–33. doi: 10.1016/s0025-6196(12)61395-0. [DOI] [PubMed] [Google Scholar]
- 24.Kolf CM, Cho E, Tuan RS. Mesenchymal stromal cells biology of adult mesenchymal stem cells: regulation of niche, self-renewal and differentiation. Arthritis Res Ther. 2007;9:204. doi: 10.1186/ar2116. [DOI] [PMC free article] [PubMed] [Google Scholar]
- 25.Gronthos S, Zannettino ACW, Hay SJ, Shi S, Graves SE, Kortesidis A, Simmons PJ. Molecular and cellular characterisation of highly purified stromal stem cells derived from human bone marrow. J Cell Sci. 2003;116:1827–1835. doi: 10.1242/jcs.00369. [DOI] [PubMed] [Google Scholar]
- 26.Pregizer S, Baniwal S, Yan X, Borok Z, Frenkel B. Progressive recruitment of Runx2 to genomic targets despite decreasing expression during osteoblast differentiation. J Cell Biochem. 2008;105:965–970. doi: 10.1002/jcb.21900. [DOI] [PMC free article] [PubMed] [Google Scholar]