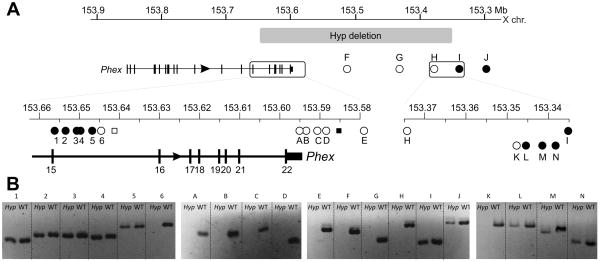
Figure 1.
(A) Mapping PCRs of Hyp deletion locus. Numbers (1 to 5) and letters (A to N) indicate PCRs in the telomeric (intron 15) and centromeric (intergenic) breakpoint regions respectively. Absence of a product for PCR 6 indicates a breakpoint between PCRs 5 and 6. Lack of a product for H denotes a breakpoint between H and I, which was narrowed to between K and L in a subsequent round of mapping PCR. (B) Summary of Hyp deletion mapping PCRs showing the extent of the Hyp deletion (grey box). Boxed regions are enlarged in the lower panels. Circles represent PCRs used in this study and squares denote results of Sabbagh et al for comparison (not to scale). Filled and unfilled shapes represent presence or absence of PCR products from male Hyp mouse DNA, respectively.

