

Abstract
Maladaptive changes in the carotid body (CB) induced by chronic intermittent hypoxia (IH) account for the pathogenesis of cardiovascular morbidity in patients with sleep-disordered breathing. We postulated that the proinflammatory cytokines, namely interleukin (IL)-1β, IL-6 and tumor necrosis factor (TNF)-α, and cytokine receptors (IL-1r1, gp130 and TNFr1) locally expressed in the rat CB play a pathophysiological role in IH-induced CB inflammation. Results showed increased levels of oxidative stress (serum 8-isoprostane and nitrotyrosine in the CB) in rats with 7-day IH treatment resembling recurrent apneic conditions when compared with the normoxic control. Local inflammation shown by the amount of ED1-containing cells (macrophage infiltration) and the gene transcripts of NADPH oxidase subunits (gp91phox and p22phox) and chemokines (MCP-1, CCR2, MIP-1α, MIP-1β and ICAM-1) in the CB were significantly more in the hypoxic group than in the control. In addition, the cytokines and receptors were expressed in the lobules of chemosensitive glomus cells containing tyrosine hydroxylase and the levels of expressions were significantly increased in the hypoxic group. Exogenous cytokines elevated the intracellular calcium ([Ca2+]i) response to acute hypoxia in the dissociated glomus cells. The effect of cytokines on the [Ca2+]i response was significantly greater in the hypoxic than in the normoxic group. Moreover, daily treatment of IH rats with anti-inflammatory drugs (dexamethasone or ibuprofen) attenuated the levels of oxidative stress, gp91phox expression and macrophage infiltration in the CB. Collectively, these results suggest that the upregulated expression of proinflammatory cytokine pathways could mediate the local inflammation and functional alteration of the CB under chronic IH conditions.
Keywords: Carotid body, Intermittent hypoxia, Proinflammatory cytokines, Oxidative stress, Sleep apnea
Introduction
Chronic exposure to episodic hypoxia (intermittent hypoxia, IH) is associated with recurrent apnea in patients suffering from central/obstructive sleep apnea (OSA). Clinical manifestations of the OSA patient are allied with the pathophysiological consequence of chronic IH, leading to cardiovascular morbidity including systemic hypertension and increased risk of stroke (Fletcher 2001; Lavie et al. 2000; Shamsuzzaman et al. 2003). In experimental animals, chronic IH induces increased activities in the carotid chemoreceptor and sympathetic outflow, which could raise the arterial blood pressure (Prabhakar et al. 2007a).
The carotid body (CB) is a paired oxygen-sensing organ located at the bifurcations of the carotid artery. Chemosensitive glomus cells in the CB respond to changes in arterial oxygen, carbon dioxide and acidity, and increase the intracellular calcium ([Ca2+]i) for the release of neurotransmitters including catecholamines and ATP to activate the chemoreflex for the regulation of cardiorespiratory performance during hypoxia (Gonzalez et al. 1994; Lahiri et al. 2001). Also, the CB plays an important role in the pathogenesis of cardiorespiratory changes induced by chronic IH, because denervation of the CB eliminates the hypertensive response to IH (Fletcher et al. 1992). In addition, it has been shown that chronic IH enhances the CB chemosensory and ventilatory responses to acute hypoxia in cats (Rey et al. 2004). In particular, episodes of IH could induce a prolonged enhancement of baseline chemoreceptor activity termed long-term facilitation (LTF), which might lead to the sympathetic activation in adult rats (Peng et al. 2003). An alteration in the CB function has also been reported in OSA patients (Narkiewicz et al. 1999).
Oxidative stress (Heitzer et al. 2001; Landmesser and Harrison 2001) and reactive oxygen species (ROS) are contributing factors in the pathogenesis of atherosclerosis, hypertension and OSA (Grieve and Shah 2003; Martinet and Kockx 2001; Sedeek et al. 2003; Shamsuzzaman et al. 2003). An emerging body of data indicates that specific extracellular stimuli including cytokines, neurotransmitters and hypoxia initiate signaling cascades leading to the production of ROS from mitochondria and NADPH oxidase (Chandel and Schumacker 2000; Thannickal and Fanburg 2000). Oxidative stress triggered by the increased production of ROS and nitrogen reactive species could mediate cellular damages in tissues such as in the heart, brain and liver (Goldbart et al. 2003; Haussinger and Schliess 2008; Joyeux-Faure et al. 2005). The chronic effect of IH resembling hypoxia–reperfusion could be mediated by increased ROS generation in the CB. In fact, the IH-induced LTF in the carotid chemoreceptor could be attenuated by superoxide dismutase mimetic, suggesting an involvement of ROS in the pathogenic cascades leading to the alteration of CB function (Peng et al. 2003). This could account for the pathogenic change in respiratory activities in the OSA patients (Prabhakar et al. 2007a).
Cytokines are diverse groups of non-antibody intercellular signaling proteins that regulate local and systemic immune and inflammatory responses in many physiological processes. Besides, cytokines may play an important role in the pathogenesis of the cardiovascular morbidity in OSA patients (Kapsimalis et al. 2008). Recent studies have demonstrated that levels of circulating proinflammatory cytokines such as interleukin (IL)-6 and tumor necrosis factor (TNF)α, soluble adhesion molecules such as intercellular adhesion molecule (ICAM)-1, and chemokines, such as monocyte chemoattractant protein (MCP)-1, are elevated in OSA patients (Chin et al. 2000; Entzian et al. 1996; Minoguchi et al. 2004; Ohga et al. 2003; Yokoe et al. 2003). A role of proinflammatory cytokines in the CB chemoreception has been proposed because receptors for IL-1β, IL-6 and TNFα are expressed in the rat CB (Lam et al. 2008a; Liu et al. 2009; Shu et al. 2007; Wang et al. 2002, 2006). We have also shown that the proinflammatory cytokines could enhance the [Ca2+]i response to hypoxia in the chemosensitive glomus cells (Lam et al. 2008a). In addition, the CB contains immunoreactivities against subunits of the phagocyte NADPH oxidase, gp91phox and p22phox (Kummer and Acker 1995; Youngson et al. 1997), which are expressed by macrophages found in the CB (Dvorakova et al. 2000). NADPH oxidase-dependent ROS generation has been shown to induce oxidative stress in local tissues, which could lead to increased expressions of IL-1β, TNFα and MCP-1 via the activation of transcriptional activity of nuclear factor kappa B (NFκB) (Bonizzi et al. 1999; Clark and Valente 2004; Ha and Lee 2005; Qin et al. 2005). However, there is a paucity of information on the effect of chronic IH on the local inflammation of the CB and the molecular mechanism involved in the local inflammatory response and functional alteration. In this study, we examined the hypothesis that the expressions of proinflammatory cytokines and cytokine receptors in the CB play a pathophysiological role in the local inflammation and functional alteration under chronic IH conditions resembling severe sleep apnea syndrome in OSA patients.
Materials and methods
Intermittent hypoxia
The animal model and experimental protocol for this study were approved by the Committee on the Use of Live Animals in Teaching and Research of The University of Hong Kong. Male Sprague–Dawley rats at age 28 days (ca. 70 g) were randomly divided into IH and normoxic (Nx) groups. The rat cages were kept in acrylic chambers under normobaric conditions and the rats had free access to water and chow. The Nx controls were kept in room air with maintenance matching the hypoxic group (Hung et al. 2008; Tipoe and Fung 2003; Tjong et al. 2008; Yeung et al. 2008). For the IH group, the fractional amount of oxygen levels inside the chamber was altered between 21 and 5 ± 0.5% per min, 60 cycles/h, 8 h per day diurnally (Hung et al. 2008; Tjong et al 2008; Yeung et al. 2008). As a result, the inspired oxygen level fell to 4–5% (nadir arterial oxygen saturation ca. 70%) for about 15 s per min, which mimics the recurrent episodic hypoxemia in OSA patients (Fletcher 2001). The desired oxygen level was established by a mixture of room air and nitrogen that was regulated and monitored by an oxygen analyzer (Vacumetrics Inc., CA, USA). The chamber was opened daily to clean the cages and replenish food and water. The rats were exposed to hypoxia for 3 and 7 days. For the drug treatment, IH rats were intraperitoneally injected with dexamethasone (0.1 mg/kg/day) or ibuprofen (4 mg/kg/day) daily 30 min before the hypoxic exposure for 7 days. The rats were immediately used in experiments after being taken out of the chamber.
Serum total 8-isoprostane (IPT) determination
The serum level of total IPT was measured by enzyme immunoassay (EIA) kit (Cayman Chemical Co., MI, USA). Total serum IPT determination requires an alkaline hydrolysis procedure prior to EIA. Briefly, 3 μl serum diluted with 12 μl EIA buffer was added to 15 μl 15% wt/vol KOH and incubated at 40°C for 5 min. Then, 30 μl KH2PO4 (1 M) and 90 μl EIA buffer were added to the sample to arrive at a final dilution of 1:50. To start the EIA assay, in a 96-well plate coated with mouse anti-rabbit IgG, 100 μl of the EIA buffer was added to the wells labeled as non-specific binding (NSB); 50 μl of EIA buffer was added to the well labeled as maximum binding (B0). Then, eight serially diluted standards were added to the plates in duplicates. The IPT competitor (tracer) was added to all the wells, except those labeled with total activity (TA, the activity of tracer), and blank. Antiserum of 50 μl was added followed by an addition of 50 μl tracer to each well except TA, NSB and blank. The plate was then incubated at room temperature for 18 h. After incubation, the content was discarded and rinsed with wash buffer for 5 min. Ellman’s reagent (200 μl) was added to each well and 5 μl of tracer to TA. The plate was then developed in the dark with gentle agitation for 60–90 min. A distinct yellow color developed and the absorbance was measured by a plate reader (Labsystem Multiskan, Helsiniki, Finland) at 412 nm. To determine the amount of IPT, a standard curve was plotted with the percentage of tracer binding (%B/B0) against IPT concentration. The %B/B0 was deduced by using the equation: %B/B0 = [X − NSB/B0]·100 where X is the absorbance of individual standards or tested serum samples, NSB the non-specific binding and B0 the maximum binding. The amount of IPT was determined by applying the standard curve and the concentration of IPT in each tested serum sample was expressed as picogram per milliliter (pg/ml).
Immunohistochemistry and quantitative measurement
Immunohistochemical staining was performed on deparaffinized formalin-fixed tissue sections of the carotid bifurcation following methods described in detail previously (Lam et al. 2008b; Tipoe and Fung 2003). Sections were incubated with primary antibodies to the following proteins: IL-1β (rabbit polyclonal antibody, 1:250 dilution, Cat # sc-7844, Santa Cruz, CA, USA); IL-6 (goat polyclonal antibody, 1:2000 dilution, Cat # sc-1265, Santa Cruz, CA, USA); TNFα (goat polyclonal antibody, 1:1000 dilution, Cat # sc-1350, Santa Cruz, CA, USA); IL-1r1 (rabbit polyclonal antibody, 1:1250 dilution, Cat # sc-689, Santa Cruz, CA, USA); gp130 (rabbit polyclonal antibody, 1:2500 dilution, Cat # sc-655, Santa Cruz, CA, USA); TNFr1 (rabbit polyclonal antibody, 1:1000 dilution, Cat # sc-7895, Santa Cruz, CA, USA); nitrotyrosine (NTR) (mouse monoclonal IgG antibody, 1:50 dilution, Cat # 321900, Zymed Laboratory Inc., CA, USA) and ED1 (mouse monoclonal antibody, 1:1000 dilution, Cat # sc-59103, Santa Cruz, CA, USA), in 0.05 M Tris–HCl buffer containing 2% bovine serum albumin at 4°C overnight. Detection was performed with streptavidin-biotinylated peroxidase-linked reagents (LSAB kit, Dako, USA) with diaminobenzidine. Control sections were prepared by substitution of primary antibodies with buffer or normal serum, and liquid-phase preadsorption of the used antibodies with excess blocking antigens (IL-1β: Cat # 12393, IL-6: Cat # 10406, TNF-α: Cat # T5944, Sigma, CA, USA) (Fig. 1). The immunoreactivities of tested cytokines and their corresponding receptors were measured using the Leica QWIN Imager Analyzer (Cambridge, UK). Immunostained sections were captured with a CCD JVC camera using a Zeiss Axiophot microscope at 100× objective. The luminance incident light passing through each section was calibrated using the setup menu where the gray pixel values were set to 0 and 1.00. Once the setup was ready, five fields per section from one CB of one animal were measured. The percent area of positive stain for the cytokine proteins was measured by detecting the positive brown stain divided by the sum areas of the reference field. A total of 20 fields for four CBs from four different animals at each time point, namely day 3 and 7, were determined. The mean value of the 20 fields was calculated to represent each time point.
Fig. 1.
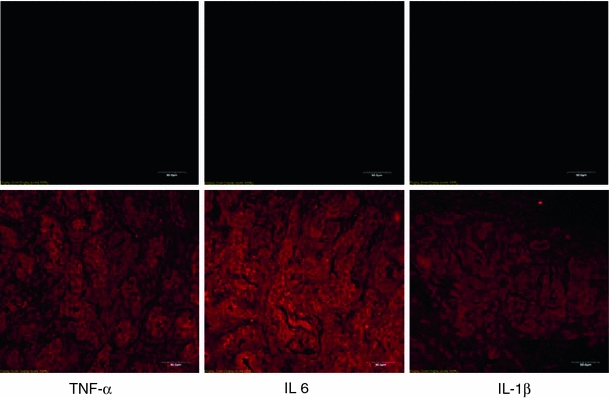
Photomicrographs show negative immunostaining of the carotid body sections with blocking antigens for the liquid-phase preadsorption (upper panels). Sections in the lower panels were positively stained with immunofluorescence (see “Methodology” for details). Bar 50 μm
Immunohistochemical localization of cytokines, receptors and macrophages
Immunofluorescent double-labeling technique was used to determine the immunohistochemical localization of cytokines and their receptors as well as macrophage infiltration (Fung et al. 2002; Lam et al. 2008a). Briefly, CB sections were incubated overnight at 4°C with seven sets of primary antibodies: (1) IL-1β and tyrosine hydroxylase (TH) (sheep IgG antibody, Cat # AB1542, Chemicon International Inc., CA, USA); (2) IL-6 and TH; (3) TNFα and TH; (4) IL-1r1 and TH; (5) gp130 and TH; (6) TNFr1 and TH; (7) ED1 and TH. After thorough washing with PBS, the primary antibodies were detected using anti-rabbit/goat Ig labeled with rhodamine for the cytokines and their corresponding receptors and anti-sheep Ig labeled with fluorescein isothiocyanate (FITC) for TH for 2 h at room temperature, respectively. Positive immunoreactivity for the cytokines, receptors and macrophage (red) and for TH (green) was examined with a confocal microscope equipped with a DC 200 digital camera (Leica Microsystems Ltd, Bannockburn, IL, USA). Control sections were prepared by substitution of primary antibodies with buffer or normal serum. To ensure no cross-reactivity between the primary antibodies and the unrelated second antibodies, sections were incubated with only one primary antiserum and followed by both secondary antisera.
Reverse transcription polymerase chain reaction
Eight CBs were pooled for the isolation of total RNA and RT-PCR. Isolated total RNA (5 μg), quantified by spectrophotometer, was subjected to first strand cDNA synthesis using random hexamer primers and Superscript II transcriptase (Invitrogen, USA) in a final volume of 20 μl. After incubation at 42°C for 1 h, the reaction mixture was treated with RNase H before proceeding to PCR analysis. The final mixture (2 μl) was directly used for PCR amplification. All RNA was shown to be free of DNA contamination by RT-PCR without addition of reverse transcriptase. The primer sequences and the PCR conditions for the tested cytokines, receptors, chemokines and NADPH oxidase subunits are listed in Table 1. Aliquots of the PCR products were electrophoresed on 2% agarose gels stained with ethidium bromide and photographed. The optical density of the bands was quantified by Image J (NIH, MD, USA) and the optical density of mRNA and internal control (β-actin or S16) was expressed as ratio represented by arbitrary units in the figures.
Table 1.
RT-PCR primers sequences and conditions
| Gene name | RT-PCR primers (5′ to 3′) | RT-PCR conditions | ||||
|---|---|---|---|---|---|---|
| Forward | Reverse | Denaturing | Annealing | Elongating | Cycle no. | |
| CCR2 | GGAATCCTCCACACCCTGTTTC | ACCCAACTGAGACTTCTTGCTCCC | 94°C, 90 s | 55°C, 1 m | 72°C, 2 m | 38 |
| gp130 | TCAACTTGTGGAACCATGTGG | TCCAACTGACACAGCATGTTC | 94°C, 1 m | 66°C, 1 m | 72°C, 1 m | 35 |
| gp91phox | CTGAGCGAATTGTACGTGG | GCTTATCACAGCCACAAGC | 95°C, 30 s | 55°C, 45 s | 72°C, 45 s | 35 |
| ICAM-1 | GCCGCTCATTTACACCTATTA | TTCCTTTTCTTCTCTTGCTTG | 94°C, 90 s | 55°C, 1 m | 72°C, 2 m | 38 |
| IL-1r1 | CGAAAGACTATCAGTTTTTGGAAC | GTAACCTCGATGGTATCTTCCC | 94°C, 1 m | 62°C, 1 m | 72°C, 1 m | 35 |
| IL-1β | AAAGAAGAAGATGGAAAAGCGGTT | GGAACTGTGCAGACTCAAACTC | 95°C, 15 s | 59°C, 1 m | 72°C, 30 s | 35 |
| IL-6 | GACTGATGTTGTTGACAGCCACTGC | TAGCCACTCCTTCTGTGACTCTAACT | 94°C, 1 m | 62°C, 1 m | 72°C, 1 m | 35 |
| MCP-1 | TCTACAGAAGTGCTTGAGGTGGTTG | CCTGTTGTTCACAGTTGCTGCC | 94°C, 1 m | 60°C, 2 m | 72°C, 2 m | 35 |
| MIP-1α | CCCTTGCTGTTCTTCTCTGCAC | GCATTCAGTTCCAGCTCAGTGATG | 94°C, 1 m | 60°C, 2 m | 72°C, 2 m | 35 |
| MIP-1β | TCTGCGATTCAGTGCTGTCAGC | GATTTGCCTGCCTTTTTTGGTC | 94°C, 1 m | 60°C, 2 m | 72°C, 2 m | 35 |
| p22phox | TTGTTGCAGGAGTGCTATC | AATGGGAGTCCACTGCTAC | 95°C, 30 s | 55°C, 45 s | 72°C, 45 s | 35 |
| S16 | TCCGCTGCAGTCCGTTCAAGTCTT | GCCAAACTTCTTGGATTCGCAGCG | 95°C, 30 s | 58°C, 30 s | 72°C, 45 s | 28 |
| TNFr1 | GAACACCGTGTGTAACTGCC | ATTCCTTCACCCTCCACCTC | 94°C, 1 m | 62°C, 1 m | 72°C, 1 m | 35 |
| TNFα | ATGAGCACAGAAAGCATGATC | TACAGGCTTGTCACTCGAATT | 94°C, 90 s | 55°C, 1 m | 72°C, 2 m | 38 |
Spectrofluorometric measurement
Following deep anesthesia with halothane, rats were decapitated and the carotid bifurcation was excised rapidly. The CB was carefully dissected free from the bifurcation in ice-cold rat Ringer’s (contained in mM: NaCl 125, KCl 3.1, NaHCO3 26, NaH2PO4 1.25, MgSO4 1.3, CaCl2 2.4, D-dextrose 10), oxygenated with 95% O2 and 5% CO2 (pH 7.4). The CB was then incubated in a tissue bath with collagenase (0.06%) and protease (0.02%) in oxygenated Ringer’s for 30 min at 35 ± 1°C (Fung et al. 2001). Following enzymatic treatment, cells in the CBs were dispersed by gently triturating with pipettes. Cells were incubated in 5 μM fura-2 acetoxymethyl ester (fura-2AM; Molecular Probes, Eugene, OR, USA) in Ringer’s for 30 min at room temperature. The cells were then centrifuged at 200g for 5 min and prepared for the spectrofluorometric measurement of [Ca2+]i. Glomus cells in clusters of five to ten cells were studied and the morphological criteria for their confirmation as glomus cells was according to the methods used in previous reports (Fung et al. 2001; Wasicko et al. 1999). The cells were seeded on a coverslip placed in the stage of an inverted microscope coupled with a dual-wavelength excitation spectrofluorometer (Photon Technology International, Lawrenceville, NJ, USA). The cells were perfused with Ringer’s buffer at a flow rate of 0.5 ml/min in a 0.5 ml chamber at physiological temperature (36 ± 1°C). The fluorescence intensity in the background was measured and subtracted from the signals. Fluorescent signals were obtained at 340 and 380 nm excitation wavelengths. The ratio of the fluorescence intensity (340–380 nm) was used to estimate [Ca2+]i in the cells. The [Ca2+]i was calculated by using the equation: [Ca2+]i = K d [(R o − R min)/(R max − R o)]β, where R o is the fluorescence ratio, R min is the fluorescence ratio at zero Ca2+, R max is the fluorescence ratio at saturated Ca2+, K d is the dissociation constant for fura-2 (224 nm) and β is the ratio of 380 nm fluorescence intensity at zero Ca2+ to 380 nm fluorescence intensity at saturated Ca2+. The chemosensitivity of the glomus cells was determined by the [Ca2+]i response to hypoxia, which was induced by switching the perfusate to the Ringer’s gassed with 5% CO2 in nitrogen for 2 min. Following recovery for 10–15 min, the cells were treated with drugs or vehicle before a second exposure to hypoxia. Concentration dependence was determined by the [Ca2+]i response to IL-1β, IL-6 and TNFα at 0.01, 0.1 and 1 nM. The cytokine was perfused for 5 min before the cells were exposed to hypoxia. For the blockade study, the antibodies (100 nM) used were IL-1β (rabbit polyclonal antibody, Cat # sc-7844, Santa Cruz, CA, USA); IL-6 (goat polyclonal antibody, Cat # sc-1265, Santa Cruz, CA, USA); TNFα (goat polyclonal antibody, Cat # sc-1350, Santa Cruz, CA, USA).
Data analysis and statistics
GraphPad Prism® software (GraphPad Software, Inc., San Diego, USA) was used to analyze the data. Statistic comparison between groups was done using the Mann–Whitney U test or the Kruskal–Wallis test followed by post hoc Dunn’s test to compare three or more groups. Results were expressed as box plots for the IH group and the Nx control. Statistical significance was set at a p value <0.05 versus the respective Nx control groups. For RT-PCR, the mRNAs expression for the tested cytokines was normalized in % control of the β-actin expression. For the [Ca2+]i, the resting and peak values of the fluorescence ratio of 340 and 380 nm or calibrated [Ca2+]i (nM) of the response to hypoxia with or without prior treatment of the drugs were calculated.
Results
Effect of chronic IH on oxidative stress and local inflammation in the carotid body
Study with ELISA was performed to determine the total 8-isoprostane (IPT) level in the serum. The IPT level was significantly increased in the 7-day IH group but not in the 3-day IH group, when compared with the Nx controls (Fig. 2a). In addition, immunohistochemical study showed that the immunoreactivity of nitrotyrosine (NTR) was present in the CB. Image analysis measuring the % CB area with positive immunostaining of NTR showed significant increases in the NTR expression in the 3- and 7-day IH groups when compared with the Nx controls (Fig. 2b). These results suggest an increased level of oxidative stress in the tissues during the first week of the IH treatment. Local inflammation was examined by assessing the amount of positive-staining cells with macrophage marker (ED1) and the expression of NADPH oxidase subunits, gp91phox and p22phox in the CB. The level of ED1-immunoreactivity was significantly elevated in 3- and 7-day IH groups when compared with the controls, indicating an increase in infiltration of macrophages in the CB in chronic IH (Fig. 2c). Besides, levels of mRNA expression of the NADPH oxidase subunits were significantly increased in the CB of rats treated with 7-day IH when compared with the control (Fig. 2d). Furthermore, studies with RT-PCR showed that the mRNA transcripts of chemokines were expressed in the CB. Levels of the mRNA expression of MCP-1, CCR2, MIP-1α, MIP-1β and ICAM-1 were significantly increased in the IH group by ca. 15–35% of the Nx control, whereas the β-actin expression remained unchanged (Fig. 2e). Results strongly support that chronic IH induced a local inflammation in the CB.
Fig. 2.
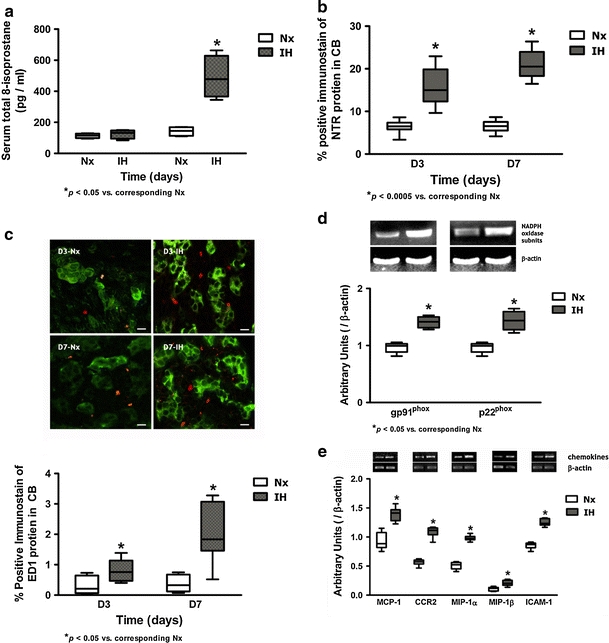
a Levels of total IPT in the serum of rats in IH and Nx for 3 (D3) and 7 days (D7). * p < 0.05 versus corresponding Nx (n = 4 for each group). b Protein expression of NTR in the CB of rats in IH and Nx for 3 (D3) and 7 days (D7). Data are presented in % positive immunostains with positive staining of NTR immunoreactivities. *p < 0.0005 versus corresponding Nx (n = 4 for each group). c Immunohistochemical localization of ED1 and TH in the CB of rats in IH and Nx for 3 (D3) and 7 days (D7). Distinct immunoreactivities for ED1 (red) were localized to the macrophages, while intense immunoreactivities for TH (green) were localized to the clusters of type I glomus cells in the CB. Bar 10 μm. The protein expressions of ED1 are presented in % positive immunostains with positive staining of ED1 immunoreactivities. *p < 0.05 versus corresponding Nx (n = 4 for each group). d RT-PCR analysis of the mRNA expression of the NADPH oxidase subunits (gp91phox and p22phox) in 7-day Nx and IH rat CB. The expected size of PCR products from gp91phox is 450 bp, p22phox is 275 bp and β-actin is 436 bp. The graph shows relative expressions of the NADPH oxidase subunits/β-actin mRNA (% of control). *p < 0.05 versus the corresponding Nx (n = 3 for each group). e RT-PCR analysis of the mRNA expression of chemokines in 7-day Nx and IH rat CB. The expected size of PCR products from MCP-1 is 396 bp, CCR2 is 409 bp, MIP-1α is 977 bp, MIP-1β is 1,100 bp, ICAM-1 is 413 bp and β-actin is 436 bp. The graph shows relative expressions of the chemokines/β-actin mRNA (% of control). *p < 0.005 versus the corresponding Nx (n = 7 for each group)
Expression and localization of proinflammatory cytokines and cytokine receptors
Immunohistochemical studies demonstrated the expression and localization of the proinflammatory cytokines (IL-1β, IL-6 and TNFα) and the cognate receptors (IL-1r1, gp130 and TNFr1) in the CB. Positive-staining cells with immunoreactivities of IL-1β, IL-6, TNFα, IL-1r1, gp130 and TNFr1 were found in all the CB sections (Figs. 3, 4, 5). Image analysis measuring the % CB area with positive immunostaining of IL-1β (Fig. 3a) and IL-1r1 (Fig. 3b); IL-6 (Fig. 4a) and gp130 (Fig. 4b); and TNFα (Fig. 5a) and TNFr1 (Fig. 5b) showed significant increases in the expression of the cytokines and receptors in the IH group when compared with their respective Nx controls. The proportional amount of the CB cells expressing positive immunoreactivities was increased at day 3 in IH and remained at elevated levels throughout the time course. Double-labeling immunohistochemical studies showed that immunoreactivities for the IL-1β (Fig. 3c) and IL-1r1 (Fig. 3f); IL-6 (Fig. 4c) and gp130 (Fig. 4f); TNFα (Fig. 5c) and TNFr1 (Fig. 5f) were mainly in the lobules of cell clusters containing TH-immunoreactivity, a cellular marker for chemosensitive type I glomus cells (Kameda et al. 1990) (Figs. 3d, g, 4d, g, 5d, g). The co-localization of IL-1β, IL-6, TNFα, IL-1r1, gp130 and TNFr1 with the TH-containing glomus cells was evidenced by the overlay of immunostaining for: IL-1β and TH (Fig. 3e); IL-1r1 and TH (Fig. 3h); IL-6 and TH (Fig. 4e); gp130 and TH (Fig. 4h); TNFα and TH (Fig. 5e); TNFr1 and TH (Fig. 5h). Specificity of the immunostaining was validated by negative control experiments, which were stained uniformly negative (Fig. 1). Moreover, results of RT-PCR studies showed that mRNA transcripts of the cytokines and their corresponding receptors were expressed in the CB (Figs. 3, 4, 5). There were significantly higher levels of mRNA expression of IL-1β and IL-1r1 (Fig. 3i); IL-6 and gp130 (Fig. 4i); and TNFα and TNFr1 (Fig. 5i) in the IH group than in the Nx control, whereas the expression levels of β-actin remained unchanged. The relative expression changes were increased by ca. 15–45% of the Nx control.
Fig. 3.
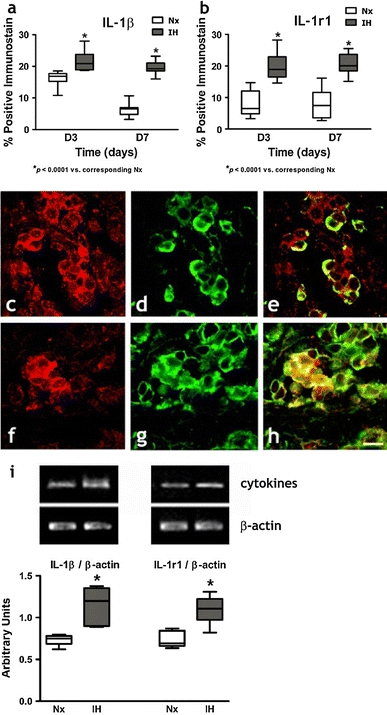
Protein expressions of a IL-1β and b IL-1r1 in the CB of rats in IH and Nx for 3 (D3) and 7 days (D7). Data are presented in % positive immunostains with positive staining of IL-1β and IL-1r1 immunoreactivities. *p < 0.0001 versus corresponding Nx (n = 4 for each group). Immunohistochemical co-localization of IL-1β and TH/IL-1r1 and TH in the CB of rats with 7-day IH treatment. Distinct immunoreactivities for c IL-1β and f IL-1r1 were localized to the glomus cell clusters (red) in the CB. d, g Intense immunoreactivities for TH were localized to the clusters of type I glomus cells (green) in the CB. Immunoreactivities for e IL-1β and h IL-1r1 were co-localized predominantly with that for TH in the cell clusters of the glomus cell (yellow) double immunostaining. Bar 10 μm. i RT-PCR analysis of the mRNA expression of IL-1β and IL-1r1 in 7-day Nx and IH rat CB. The expected size of PCR products from IL-1β is 100 bp, IL-1r1 is 100 bp and β-actin is 436 bp. The graph shows relative expressions of the IL-1β/β-actin or IL-1r1/β-actin mRNA (% of control). * p < 0.05 versus the corresponding Nx (n = 7 for each group)
Fig. 4.
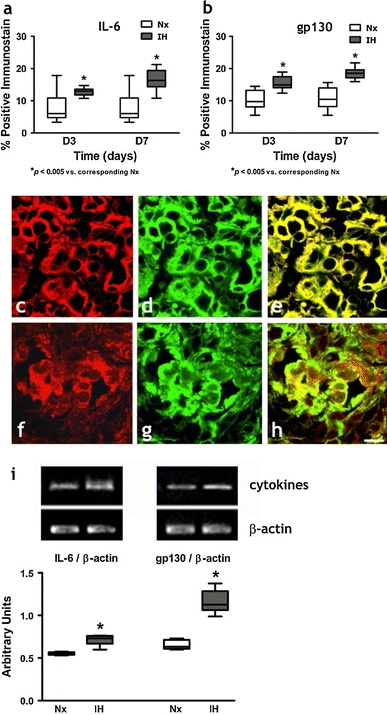
Protein expressions of a IL-6 and b gp130 in the CB of rats in IH and Nx for 3 (D3) and 7 days (D7). Data are presented in % positive immunostains with positive staining of IL-6 and gp130 immunoreactivities. *p < 0.005 versus corresponding Nx (n = 4 for each group). Immunohistochemical co-localization of IL-6 and TH/gp130 and TH in the CB of rats with 7-day IH treatment. Distinct immunoreactivities for c IL-6 and f gp130 were localized to the glomus cell clusters (red) in the CB. d, g Intense immunoreactivities for TH were localized to the clusters of type I glomus cells (green) in the CB. Immunoreactivities for e IL-6 and h gp130 were co-localized predominantly with that for TH in the cell clusters of the glomus cells (yellow) double immunostaining. Bar 10 μm. i RT-PCR analysis of the mRNA expression of IL-6 and gp130 in 7-day Nx and IH rat CB. The expected size of PCR products from IL-6 is 509 bp, gp130 is 375 bp and β-actin is 436 bp. The graph shows relative expressions of the IL-6/β-actin or gp130/β-actin mRNA (% of control). * p < 0.005 versus the corresponding Nx (n = 7 for each group)
Fig. 5.
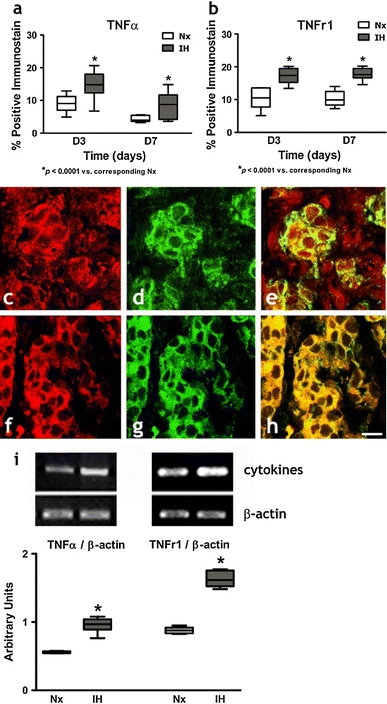
Protein expressions of a TNFα and b TNFr1 in the CB of rats in IH and Nx for 3 (D3) and 7 days (D7). Data are presented in % positive immunostains with positive staining of TNFα and TNFr1 immunoreactivities. * p < 0.0001 and # p < 0.005 versus corresponding Nx (n = 4 for each group). Immunohistochemical co-localization of TNFα and TH/TNFr1 and TH in the CB of rats with 7-day IH treatment. Distinct immunoreactivities for c TNFα and f TNFr1 were localized to the glomus cell clusters (red) in the CB. d, g Intense immunoreactivities for TH were localized to the clusters of type I glomus cells (green) in the CB. Immunoreactivities for e TNFα and h TNFr1 were co-localized predominantly with that for TH in the cell clusters of the glomus cell (yellow) double immunostaining. Bar 10 μm. i RT-PCR analysis of the mRNA expression of TNFα and TNFr1 in 7-day Nx and IH rat CB. The expected size of PCR products from TNFα is 276 bp, TNFr1 is 301 bp and β-actin is 436 bp. The graph shows relative expressions of the TNFα/β-actin or TNFr1/β-actin mRNA (% of control). * p < 0.005 versus the corresponding Nx (n = 7 for each group)
[Ca2+]i response to exogenous cytokines
Resting [Ca2+]i levels of the glomus cells were 99.7 ± 5.2 nM (n = 40). An elevated [Ca2+]i was observed in the dissociated glomus cells perfused with deoxygenated buffer. The peak [Ca2+]i level was reached shortly following acute hypoxia and the level gradually returned to the resting levels within 5 min (Figs. 6, 7, 8). The cytokines enhanced the [Ca2+]i response to hypoxia in both IH (Figs. 6a, 7a, 8a) and Nx groups (Figs. 6b, 7b, 8b). The [Ca2+]i responses were significantly increased in the IH, but not in the Nx group. The effects of cytokines on the [Ca2+]i response were comparable in studies with IL-1β, IL-6 and TNFα. On average, cytokines at 0.01–1 nM concentration dependently increased the [Ca2+]i response to hypoxia by 10–40% in comparison to the vehicle control for IL-1β (Fig. 6c), IL-6 (Fig. 7c) and TNFα (Fig. 8c). The [Ca2+]i responses for 0.1 nM of IL-1β (Fig. 6d), IL-6 (Fig. 7d) and TNFα (Fig. 8d) were increased significantly in the IH group by ca. 15–35% of the Nx control. The cytokine effects were largely diminished in the presence of antibody for IL-1β (Fig. 6c), IL-6 (Fig. 7c) and TNFα (Fig. 8c).
Fig. 6.
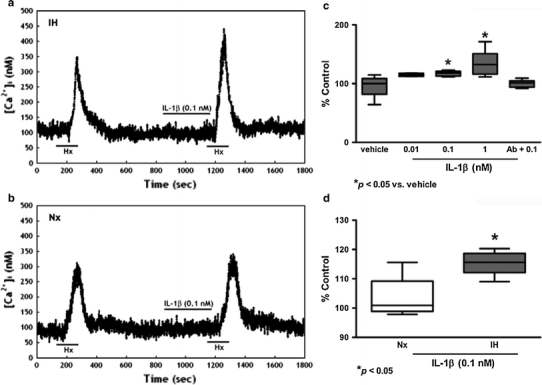
IL-1β increased [Ca2+]i response to acute hypoxia induced by perfusion of deoxygenated Ringer’s gassed with nitrogen balanced with 5% CO2 (Hx, 2 min) in dissociated glomus cells of the rat CB. Vehicle had no effect on the hypoxic response. IL-1β (0.1 nM) enhanced the [Ca2+]i response to Hx in a IH and b Nx. c IL-1β (0.01–1 nM) concentration dependently enhanced the peak [Ca2+]i responses to Hx. Treatment with excess antibody diminished the IL-1β-induced [Ca2+]i change. The [Ca2+]i response to Hx are presented as percent of the pretreatment control (% Control). * p < 0.05 versus the corresponding pretreatment control (n = 7 for each group). d The relative expression of IL-1β/vehicle (% of control) in Nx and IH. * p < 0.05 versus the corresponding Nx (n = 7 for each group)
Fig. 7.
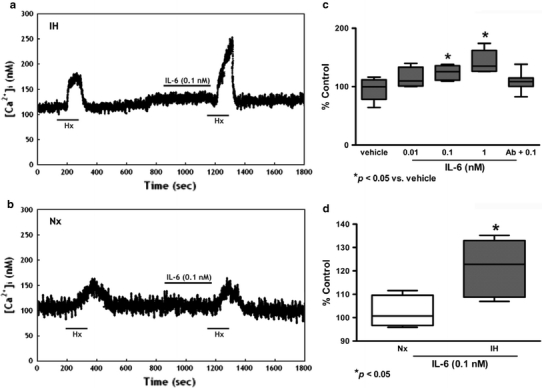
IL-6 increased [Ca2+]i response to acute hypoxia induced by perfusion of deoxygenated Ringer’s gassed with nitrogen balanced with 5% CO2 (Hx, 2 min) in dissociated glomus cells of the rat CB. Vehicle had no effect on the hypoxic response. IL-6 (0.1 nM) enhanced the [Ca2+]i response to Hx in a IH and b Nx. c On average, IL-6 (0.01–1 nM) concentration dependently enhanced the peak [Ca2+]i responses to Hx. Treatment with excess antibody diminished the IL-6-induced [Ca2+]i change. The [Ca2+]i response to Hx are presented as percent of the pretreatment control (% Control). * p < 0.05 versus the corresponding pretreatment control (n = 7 for each group). d The relative expression of IL-6/vehicle (% of control) in Nx and IH. * p < 0.05 versus the corresponding Nx (n = 7 for each group)
Fig. 8.
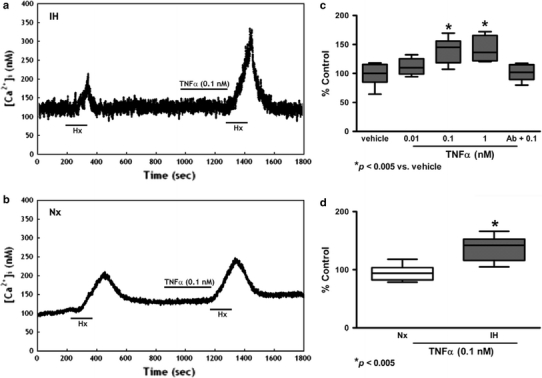
TNFα increased [Ca2+]i response to acute hypoxia induced by perfusion of deoxygenated Ringer’s gassed with nitrogen balanced with 5% CO2 (Hx, 2 min) in dissociated glomus cells of the rat CB. Vehicle had no effect on the hypoxic response. TNFα (0.1 nM) enhanced the [Ca2+]i response to Hx in a IH and b Nx. c TNFα (0.01–1 nM) concentration dependently enhanced the peak [Ca2+]i responses to Hx. Treatment with excess antibody diminished the TNFα-induced [Ca2+]i change. The [Ca2+]i response to Hx are presented as percent of the pretreatment control (% Control). * p < 0.005 versus the corresponding pretreatment control (n = 7 for each group). d The relative expression of TNFα/vehicle (% of control) in Nx and IH. * p < 0.005 versus the corresponding Nx (n = 7 for each group)
Effects of anti-inflammatory drugs on oxidative stress and local inflammation in the carotid body
Concomitant treatment of IH rats daily with anti-inflammatory drugs, dexamethasone or ibuprofen, significantly attenuated the levels of NTR expression (Fig. 9a), macrophage infiltration (Fig. 9b) and gp91phox expression (Fig. 9c) in the CB.
Fig. 9.
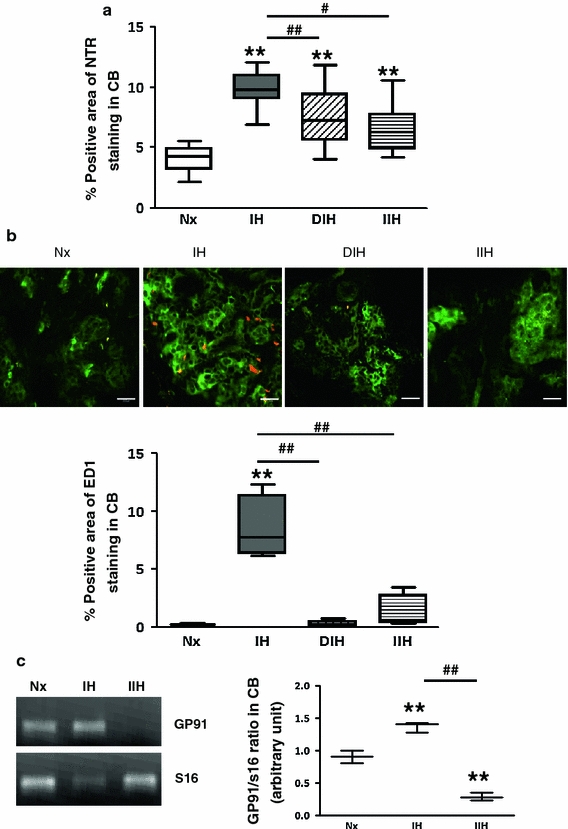
Effects of anti-inflammatory drugs on the levels of oxidative stress and local inflammation in the CB. a Protein expression of NTR in the CB of IH rats with or without treatment of dexamethasone (DIH) or ibuprofen (IIH). Data are presented in % positive immunostains with positive staining of NTR immunoreactivities. ** p < 0.005 versus the corresponding Nx; # <0.05, ## <0.005 versus the corresponding IH (n = 4 for each group). b Double-immunohistochemical localization of ED1 (red) and TH (green) in the CB of rats in Nx, IH, DIH and IIH groups. Bar 10 μm. The protein expressions of ED1 are presented in % positive immunostains with positive staining of ED1 immunoreactivities. ** p < 0.005 versus the corresponding Nx; ## <0.005 versus the corresponding IH (n = 4 for each group). c RT-PCR analysis of the mRNA expression of the NADPH oxidase subunit gp91phox (gp91) in the CB of Nx, IH and IIH groups. The graph shows relative expressions of gp91 and S16 mRNA level. The expected size of PCR product from S16 is 385 bp. ** p < 0.005 versus the corresponding Nx. # <0.05, ## <0.005 versus the corresponding IH (n = 3 for each group)
Discussion
This is the first report showing that chronic IH induces a local inflammation of the CB with functionally upregulated cytokine pathways. The CB plays an important role in the pathophysiological changes in the cardiorespiratory activities in chronic IH (Prabhakar et al. 2001). The chronic effect of IH involves an increase in the ROS generation, which could play an essential role in IH-induced alterations in the CB function in OSA patients (Peng et al. 2003; Prabhakar et al. 2007b). Indeed, our results demonstrated that levels of serum IPT and NTR in the CB were remarkably elevated in the IH rat, suggesting that chronic IH induces oxidative stress in the CB. In this context, an increase in ROS generation could be an important contributing factor in the IH-induced oxidative stress, leading to the local inflammation and functional alterations in the CB. In fact, our findings demonstrated that chronic IH induces macrophages infiltration and transcriptional upregulation of the expression of NADPH oxidase subunits in the CB, which could increase the local ROS generation. Besides, transcriptional upregulation of the chemokines in the CB could participate in the inflammatory processes. The IH-induced chemokine expression could be an inflammatory cascade to attract inflammatory cells to the CB as evidenced by the infiltration of macrophages, leading to an increased level of local ROS generation. Thus, the augmented expression of chemokines induced by chronic IH plays a role in the CB inflammation mediated by the oxidative stress.
It has been suggested that NADPH oxidase could play a unique role in modulating the activity of chemosensitive glomus cells, because both subunits of the phagocyte cytochrome b558, namely gp91phox and p22phox, were found in the CB (Kummer and Acker 1995; Youngson et al. 1997). In agreement with the previous observation, we found that mRNA transcripts of gp91phox and p22phox are present in the CB; notably, the expression levels were significantly increased by the IH treatment. It has been shown that macrophages are a major source of NADPH oxidase subunits in the CB (Dvorakova et al. 2000). Indeed, our results also showed that chronic IH elicits a significant increase in the amount of infiltrated macrophages in the CB. This could increase the levels of NADPH oxidase and ROS generation exaggerating the oxidative stress induced by chronic IH. Nonetheless, other subunits of NADPH oxidase subunits, p47phox and p67phox, have also been found in the glomus cells (Kummer and Acker 1995) and might play roles in the IH-induced ROS generation. It has been reported that hypoxia-induced ROS generation was absent in glomus cells derived from p47phox-decificent mice (He et al. 2005).
Proinflammatory cytokines (IL-1β, IL-6 and TNFα) and the cognate receptors (IL-1r1, gp130 and TNFr1) are locally expressed in the rat CB (Lam et al. 2008a; Liu et al. 2009; Wang et al. 2002, 2006). Increases in local cytokines expression might play a role in mediating the local inflammation and functional alterations of the CB in chronic IH. Importantly, here we showed that chronic IH induces a functional upregulation of the expression of cytokines and their receptors in the CB. Thus, there were increased levels of the mRNA expression for IL-1β and IL-1r1; IL-6 and gp130; and TNFα and TNFr1 in the IH group. In addition to the transcriptional upregulation, the amount of cells with the protein expression for IL-1β and IL-1r1; IL-6 and gp130; and TNFα and TNFr1 was found to be significantly more in the IH group, where the expressions were localized to the chemosensitive glomus cells containing TH in the CB. In addition, [Ca2+]i responses to acute hypoxia in the dissociated fura-2-loaded glomus cells were concentration dependently (0.01–1 nM) enhanced by proinflammatory cytokines (IL-1β, IL-6 and TNFα) and were significantly upregulated in the IH group. The diminishing effect of the [Ca2+]i responses in the presence of antibody for the proinflammatory cytokines suggests the effects of which of the cascade response in CB are likely to be mediated by their corresponding receptors (IL-1r1, gp130 and TNFr1) expressed in the CB glomus cells. Indeed, IL-1 receptor antagonist attenuated the CB response to IL-1β stimulation in the anaesthetized rat in vivo (Shu et al. 2007). These findings strongly suggest that the hypoxic response of chemosensitive glomus cells is influenced by the proinflammatory cytokines, via cognate receptors, and is more prominently in IH with an upregulation of the local expression of the cytokines and receptors. As a result, these could increase the local cytokine level and the CB sensitivity to cytokines under hypoxic conditions.
The repetitive short cycle of oxygen desaturation followed by rapid reoxygenation is likely to play a significant role in the pathogenesis of cardiovascular complications in OSA patients (Prabhakar et al. 2001). It has been suggested that the transcription factor, hypoxia-inducible factor (HIF)-1α, plays an important role in the CB response to IH (Lam et al. 2008b), which could be important for the transcriptional regulation of HIF-target genes as an adaptive mechanism in tissue hypoxia. Additionally, there is increasing evidence showing that IH leads to a preferential activation of inflammatory over adaptive pathways, which promotes activation of various inflammatory cells, particularly lymphocytes and monocytes (Ryan and McNicholas 2008; Yamauchi and Kimura 2008). In this context, proinflammatory cytokine pathways could be activated by tissue hypoxia, because the expression of cytokines and cognate receptors in the CB chemosensitive cells are increased in chronically hypoxic rats (Lam et al. 2008a; Liu et al. 2009). In addition to the chemosensitive cells, the infiltrated macrophages may also express the cytokines and/or cognate receptors, which could contribute to the inflammatory cascade in the CB. More importantly, increased levels in the ROS and oxidative stress are unique pathophysiological features of chronic IH (Prabhakar et al. 2007b). Oxidative stress has been known to be involved in the activation of redox-sensitive transcription factors including NFκb, which regulates downstream gene products, inflammatory cytokines, chemokines and adhesion molecules (Barnes and Karin 1997). As a result, the increase in ROS generation and the upregulated cytokine pathways demonstrated in the CB may contribute to the IH-induced local inflammation. Moreover, proinflammatory cytokines, including TNFα and IL-1β, and HIF-1α also cause the activation of NFκb (Rius et al. 2008; Sakon et al. 2003; Taylor 2008). The interplay of these molecules could lead to a positive regulatory loop that may further amplify and perpetuate the local inflammatory response in the CB. In fact, we showed that concomitant treatment of the hypoxic rats with anti-inflammatory drugs, dexamethasone or ibuprofen, could attenuate the levels of oxidative stress and macrophage infiltration in the CB. Thus, the activation of proinflammatory cytokine pathway may play mechanistic roles in mediating the local inflammation and in contributing to the functional alteration of the CB in chronic IH, leading to the pathogenesis of cardiovascular morbidity in OSA patients.
In summary, our results suggest that chronic IH induces a local inflammation of the CB with functionally upregulated cytokine pathways. Local inflammation in the CB with macrophages infiltration and upregulated expression of NADPH oxidase during IH could contribute to the increased generation of ROS. Transcriptional upregulation of the chemokines could further amplify the local inflammatory cascade. In addition, the increased expressions of proinflammatory cytokines play a functional role in the enhancement of CB excitability during IH. The elevation of cytokine levels could alter the hypoxic response of the chemosensitive glomus cells, which may be one of the cellular mechanisms underlying the alteration of CB functions relevant to the cardiopulmonary control under IH. Furthermore, the chemosensitive glomus cells appear to play an important role in the local inflammation because of the expression of the cytokines and the cytokine receptors. Thus, the upregulated expression of the local proinflammatory cytokine pathways could mediate the local inflammation and functional alteration of the CB in chronic IH associated with OSA conditions.
Acknowledgments
We thank Mr. W.B. Wong, Mr. Y.M. Lo and Ms. K.M. Leung for their technical assistance. This work was supported by research grants from the University of Hong Kong (200811159058, HKU765509M) and the Research Grants Council, Hong Kong (HKU766110M, HKU7510/06M).
Open Access
This article is distributed under the terms of the Creative Commons Attribution Noncommercial License which permits any noncommercial use, distribution, and reproduction in any medium, provided the original author(s) and source are credited.
References
- Barnes PJ, Karin M. Nuclear factor-kappaB: a pivotal transcription factor in chronic inflammatory diseases. N Engl J Med. 1997;336:1066–1071. doi: 10.1056/NEJM199704103361506. [DOI] [PubMed] [Google Scholar]
- Bonizzi G, Piette J, Schoonbroodt S, Greimers R, Havard L, Merville MP, Bours V. Reactive oxygen intermediate-dependent NF-kappaB activation by interleukin-1beta requires 5-lipoxygenase or NADPH oxidase activity. Mol Cell Biol. 1999;19:1950–1960. doi: 10.1128/mcb.19.3.1950. [DOI] [PMC free article] [PubMed] [Google Scholar]
- Chandel NS, Schumacker PT. Cellular oxygen sensing by mitochondria: old questions, new insight. J Appl Physiol. 2000;88:1880–1889. doi: 10.1063/1.1303764. [DOI] [PubMed] [Google Scholar]
- Chin K, Nakamura T, Shimizu K, Mishima M, Nakamura T, Miyasaka M, Ohi M. Effects of nasal continuous positive airway pressure on soluble cell adhesion molecules in patients with obstructive sleep apnea syndrome. Am J Med. 2000;109:562–567. doi: 10.1016/S0002-9343(00)00580-5. [DOI] [PubMed] [Google Scholar]
- Clark RA, Valente AJ. Nuclear factor kappa B activation by NADPH oxidases. Mech Ageing Dev. 2004;125:799–810. doi: 10.1016/j.mad.2004.08.009. [DOI] [PubMed] [Google Scholar]
- Dvorakova M, Hohler B, Vollerthun R, Fischbach T, Kummer W. Macrophages: a major source of cytochrome b558 in the rat carotid body. Brain Res. 2000;852:349–354. doi: 10.1016/S0006-8993(99)02156-3. [DOI] [PubMed] [Google Scholar]
- Entzian P, Linnemann K, Schlaak M, Zabel P. Obstructive sleep apnea syndrome and circadian rhythms of hormones and cytokines. Am J Respir Crit Care Med. 1996;153:1080–1086. doi: 10.1164/ajrccm.153.3.8630548. [DOI] [PubMed] [Google Scholar]
- Fletcher EC. Invited review: physiological consequences of intermittent hypoxia: systemic blood pressure. J Appl Physiol. 2001;90:1600–1605. doi: 10.1063/1.1368868. [DOI] [PubMed] [Google Scholar]
- Fletcher EC, Lesske J, Culman J, Miller CC, Unger T. Sympathetic denervation blocks blood pressure elevation in episodic hypoxia. Hypertension. 1992;20:612–619. doi: 10.1161/01.hyp.20.5.612. [DOI] [PubMed] [Google Scholar]
- Fung ML, Lam SY, Chen Y, Dong X, Leung PS. Functional expression of angiotensin II receptors in type-I cells of the rat carotid body. Pflugers Arch. 2001;441:474–480. doi: 10.1007/s004240000445. [DOI] [PubMed] [Google Scholar]
- Fung ML, Lam SY, Dong X, Chen Y, Leung PS. Postnatal hypoxemia increases angiotensin II sensitivity and up-regulates AT1a angiotensin receptors in rat carotid body chemoreceptors. J Endocrinol. 2002;173:305–313. doi: 10.1677/joe.0.1730305. [DOI] [PubMed] [Google Scholar]
- Goldbart A, Row BW, Kheirandish L, Schurr A, Gozal E, Guo SZ, Payne RS, Cheng Z, Brittian KR, Gozal D. Intermittent hypoxic exposure during light phase induces changes in cAMP response element binding protein activity in the rat CA1 hippocampal region: water maze performance correlates. Neuroscience. 2003;122:585–590. doi: 10.1016/j.neuroscience.2003.08.054. [DOI] [PubMed] [Google Scholar]
- Gonzalez C, Almaraz L, Obeso A, Rigual R. Carotid body chemoreceptors: from natural stimuli to sensory discharges. Physiol Rev. 1994;74:829–898. doi: 10.1152/physrev.1994.74.4.829. [DOI] [PubMed] [Google Scholar]
- Grieve DJ, Shah AM. Oxidative stress in heart failure. More than just damage. Eur Heart J. 2003;24:2161–2163. doi: 10.1016/j.ehj.2003.10.015. [DOI] [PubMed] [Google Scholar]
- Ha H, Lee HB. Reactive oxygen species amplify glucose signalling in renal cells cultured under high glucose and in diabetic kidney. Nephrology (Carlton) 2005;10(Suppl):S7–S10. doi: 10.1111/j.1440-1797.2005.00448.x. [DOI] [PubMed] [Google Scholar]
- Haussinger D, Schliess F. Pathogenetic mechanisms of hepatic encephalopathy. Gut. 2008;57:1156–1165. doi: 10.1136/gut.2007.122176. [DOI] [PubMed] [Google Scholar]
- He L, Dinger B, Sanders K, Hoidal J, Obeso A, Stensaas L, Fidone S, Gonzalez C. Effect of p47phox gene deletion on ROS production and oxygen sensing in mouse carotid body chemoreceptor cells. Am J Physiol Lung Cell Mol Physiol. 2005;289:L916–L924. doi: 10.1152/ajplung.00015.2005. [DOI] [PubMed] [Google Scholar]
- Heitzer T, Schlinzig T, Krohn K, Meinertz T, Munzel T. Endothelial dysfunction, oxidative stress, and risk of cardiovascular events in patients with coronary artery disease. Circulation. 2001;104:2673–2678. doi: 10.1161/hc4601.099485. [DOI] [PubMed] [Google Scholar]
- Hung MW, Tipoe GL, Poon AM, Reiter RJ, Fung ML. Protective effect of melatonin against hippocampal injury of rats with intermittent hypoxia. J Pineal Res. 2008;44:214–221. doi: 10.1111/j.1600-079X.2007.00514.x. [DOI] [PubMed] [Google Scholar]
- Joyeux-Faure M, Stanke-Labesque F, Lefebvre B, Beguin P, Godin-Ribuot D, Ribuot C, Launois SH, Bessard G, Levy P. Chronic intermittent hypoxia increases infarction in the isolated rat heart. J Appl Physiol. 2005;98:1691–1696. doi: 10.1152/japplphysiol.01146.2004. [DOI] [PubMed] [Google Scholar]
- Kameda Y, Amano T, Tagawa T. Distribution and ontogeny of chromogranin A and tyrosine hydroxylase in the carotid body and glomus cells located in the wall of the common carotid artery and its branches in the chicken. Histochemistry. 1990;94:609–616. doi: 10.1007/BF00271988. [DOI] [PubMed] [Google Scholar]
- Kapsimalis F, Basta M, Varouchakis G, Gourgoulianis K, Vgontzas A, Kryger M. Cytokines and pathological sleep. Sleep Med. 2008;9:603–614. doi: 10.1016/j.sleep.2007.08.019. [DOI] [PubMed] [Google Scholar]
- Kummer W, Acker H. Immunohistochemical demonstration of four subunits of neutrophil NAD(P)H oxidase in type I cells of carotid body. J Appl Physiol. 1995;78:1904–1909. doi: 10.1152/jappl.1995.78.5.1904. [DOI] [PubMed] [Google Scholar]
- Lahiri S, Rozanov C, Roy A, Storey B, Buerk DG. Regulation of oxygen sensing in peripheral arterial chemoreceptors. Int J Biochem Cell Biol. 2001;33:755–774. doi: 10.1016/S1357-2725(01)00042-5. [DOI] [PubMed] [Google Scholar]
- Lam SY, Tipoe GL, Liong EC, Fung ML. Chronic hypoxia upregulates the expression and function of proinflammatory cytokines in the rat carotid body. Histochem Cell Biol. 2008;130:549–559. doi: 10.1007/s00418-008-0437-4. [DOI] [PubMed] [Google Scholar]
- Lam SY, Tipoe GL, Liong EC, Fung ML. Differential expressions and roles of hypoxia-inducible factor-1alpha, -2alpha and -3alpha in the rat carotid body during chronic and intermittent hypoxia. Histol Histopathol. 2008;23:271–280. doi: 10.14670/HH-23.271. [DOI] [PubMed] [Google Scholar]
- Landmesser U, Harrison DG. Oxidant stress as a marker for cardiovascular events: ox marks the spot. Circulation. 2001;104:2638–2640. [PubMed] [Google Scholar]
- Lavie P, Herer P, Hoffstein V. Obstructive sleep apnoea syndrome as a risk factor for hypertension: population study. Bmj. 2000;320:479–482. doi: 10.1136/bmj.320.7233.479. [DOI] [PMC free article] [PubMed] [Google Scholar]
- Liu X, He L, Stensaas L, Dinger B, Fidone S. Adaptation to chronic hypoxia involves immune cell invasion and increased expression of inflammatory cytokines in rat carotid body. Am J Physiol Lung Cell Mol Physiol. 2009;296:L158–L166. doi: 10.1152/ajplung.90383.2008. [DOI] [PMC free article] [PubMed] [Google Scholar]
- Martinet W, Kockx MM. Apoptosis in atherosclerosis: focus on oxidized lipids and inflammation. Curr Opin Lipidol. 2001;12:535–541. doi: 10.1097/00041433-200110000-00009. [DOI] [PubMed] [Google Scholar]
- Minoguchi K, Tazaki T, Yokoe T, Minoguchi H, Watanabe Y, Yamamoto M, Adachi M. Elevated production of tumor necrosis factor-alpha by monocytes in patients with obstructive sleep apnea syndrome. Chest. 2004;126:1473–1479. doi: 10.1378/chest.126.5.1473. [DOI] [PubMed] [Google Scholar]
- Narkiewicz K, van de Borne PJ, Pesek CA, Dyken ME, Montano N, Somers VK. Selective potentiation of peripheral chemoreflex sensitivity in obstructive sleep apnea. Circulation. 1999;99:1183–1189. doi: 10.1161/01.cir.99.9.1183. [DOI] [PubMed] [Google Scholar]
- Ohga E, Tomita T, Wada H, Yamamoto H, Nagase T, Ouchi Y. Effects of obstructive sleep apnea on circulating ICAM-1, IL-8, and MCP-1. J Appl Physiol. 2003;94:179–184. doi: 10.1152/japplphysiol.00177.2002. [DOI] [PubMed] [Google Scholar]
- Peng YJ, Overholt JL, Kline D, Kumar GK, Prabhakar NR. Induction of sensory long-term facilitation in the carotid body by intermittent hypoxia: implications for recurrent apneas. Proc Natl Acad Sci USA. 2003;100:10073–10078. doi: 10.1073/pnas.1734109100. [DOI] [PMC free article] [PubMed] [Google Scholar]
- Prabhakar NR, Fields RD, Baker T, Fletcher EC. Intermittent hypoxia: cell to system. Am J Physiol Lung Cell Mol Physiol. 2001;281:L524–L528. doi: 10.1152/ajplung.2001.281.3.L524. [DOI] [PubMed] [Google Scholar]
- Prabhakar NR, Dick TE, Nanduri J, Kumar GK. Systemic, cellular and molecular analysis of chemoreflex-mediated sympathoexcitation by chronic intermittent hypoxia. Exp Physiol. 2007;92:39–44. doi: 10.1113/expphysiol.2006.036434. [DOI] [PubMed] [Google Scholar]
- Prabhakar NR, Kumar GK, Nanduri J, Semenza GL. ROS signaling in systemic and cellular responses to chronic intermittent hypoxia. Antioxid Redox Signal. 2007;9:1397–1403. doi: 10.1089/ars.2007.1732. [DOI] [PubMed] [Google Scholar]
- Qin L, Liu Y, Qian X, Hong JS, Block ML. Microglial NADPH oxidase mediates leucine enkephalin dopaminergic neuroprotection. Ann N Y Acad Sci. 2005;1053:107–120. doi: 10.1196/annals.1344.009. [DOI] [PubMed] [Google Scholar]
- Rey S, Del Rio R, Alcayaga J, Iturriaga R. Chronic intermittent hypoxia enhances cat chemosensory and ventilatory responses to hypoxia. J Physiol. 2004;560:577–586. doi: 10.1113/jphysiol.2004.072033. [DOI] [PMC free article] [PubMed] [Google Scholar]
- Rius J, Guma M, Schachtrup C, Akassoglou K, Zinkernagel AS, Nizet V, Johnson RS, Haddad GG, Karin M. NF-kappaB links innate immunity to the hypoxic response through transcriptional regulation of HIF-1alpha. Nature. 2008;453:807–811. doi: 10.1038/nature06905. [DOI] [PMC free article] [PubMed] [Google Scholar]
- Ryan S, McNicholas WT. Intermittent hypoxia and activation of inflammatory molecular pathways in OSAS. Arch Physiol Biochem. 2008;114:261–266. doi: 10.1080/13813450802307337. [DOI] [PubMed] [Google Scholar]
- Sakon S, Xue X, Takekawa M, Sasazuki T, Okazaki T, Kojima Y, Piao JH, Yagita H, Okumura K, Doi T, Nakano H. NF-kappaB inhibits TNF-induced accumulation of ROS that mediate prolonged MAPK activation and necrotic cell death. EMBO J. 2003;22:3898–3909. doi: 10.1093/emboj/cdg379. [DOI] [PMC free article] [PubMed] [Google Scholar]
- Sedeek MH, Llinas MT, Drummond H, Fortepiani L, Abram SR, Alexander BT, Reckelhoff JF, Granger JP. Role of reactive oxygen species in endothelin-induced hypertension. Hypertension. 2003;42:806–810. doi: 10.1161/01.HYP.0000084372.91932.BA. [DOI] [PubMed] [Google Scholar]
- Shamsuzzaman AS, Gersh BJ, Somers VK. Obstructive sleep apnea: implications for cardiac and vascular disease. Jama. 2003;290:1906–1914. doi: 10.1001/jama.290.14.1906. [DOI] [PubMed] [Google Scholar]
- Shu HF, Wang BR, Wang SR, Yao W, Huang HP, Zhou Z, Wang X, Fan J, Wang T, Ju G. IL-1beta inhibits IK and increases [Ca2+]i in the carotid body glomus cells and increases carotid sinus nerve firings in the rat. Eur J Neurosci. 2007;25:3638–3647. doi: 10.1111/j.1460-9568.2007.05586.x. [DOI] [PubMed] [Google Scholar]
- Taylor CT. Interdependent roles for hypoxia inducible factor and nuclear factor-kappaB in hypoxic inflammation. J Physiol. 2008;586:4055–4059. doi: 10.1113/jphysiol.2008.157669. [DOI] [PMC free article] [PubMed] [Google Scholar]
- Thannickal VJ, Fanburg BL. Reactive oxygen species in cell signaling. Am J Physiol Lung Cell Mol Physiol. 2000;279:L1005–L1028. doi: 10.1152/ajplung.2000.279.6.L1005. [DOI] [PubMed] [Google Scholar]
- Tipoe GL, Fung ML. Expression of HIF-1alpha, VEGF and VEGF receptors in the carotid body of chronically hypoxic rat. Respir Physiol Neurobiol. 2003;138:143–154. doi: 10.1016/S1569-9048(03)00188-5. [DOI] [PubMed] [Google Scholar]
- Tjong YW, Li M, Hung MW, Wang K, Fung ML. Nitric oxide deficit in chronic intermittent hypoxia impairs large conductance calcium-activated potassium channel activity in rat hippocampal neurons. Free Radic Biol Med. 2008;44:547–557. doi: 10.1016/j.freeradbiomed.2007.10.033. [DOI] [PubMed] [Google Scholar]
- Wang X, Wang BR, Duan XL, Zhang P, Ding YQ, Jia Y, Jiao XY, Ju G. Strong expression of interleukin-1 receptor type I in the rat carotid body. J Histochem Cytochem. 2002;50:1677–1684. doi: 10.1177/002215540205001213. [DOI] [PubMed] [Google Scholar]
- Wang X, Zhang XJ, Xu Z, Li X, Li GL, Ju G, Wang BR. Morphological evidence for existence of IL-6 receptor alpha in the glomus cells of rat carotid body. Anat Rec A Discov Mol Cell Evol Biol. 2006;288:292–296. doi: 10.1002/ar.a.20310. [DOI] [PubMed] [Google Scholar]
- Wasicko MJ, Sterni LM, Bamford OS, Montrose MH, Carroll JL. Resetting and postnatal maturation of oxygen chemosensitivity in rat carotid chemoreceptor cells. J Physiol. 1999;514(Pt 2):493–503. doi: 10.1111/j.1469-7793.1999.493ae.x. [DOI] [PMC free article] [PubMed] [Google Scholar]
- Yamauchi M, Kimura H. Oxidative stress in obstructive sleep apnea: putative pathways to the cardiovascular complications. Antioxid Redox Signal. 2008;10:755–768. doi: 10.1089/ars.2007.1946. [DOI] [PubMed] [Google Scholar]
- Yeung HM, Hung MW, Fung ML. Melatonin ameliorates calcium homeostasis in myocardial and ischemia–reperfusion injury in chronically hypoxic rats. J Pineal Res. 2008;45:373–382. doi: 10.1111/j.1600-079X.2008.00601.x. [DOI] [PubMed] [Google Scholar]
- Yokoe T, Minoguchi K, Matsuo H, Oda N, Minoguchi H, Yoshino G, Hirano T, Adachi M. Elevated levels of C-reactive protein and interleukin-6 in patients with obstructive sleep apnea syndrome are decreased by nasal continuous positive airway pressure. Circulation. 2003;107:1129–1134. doi: 10.1161/01.CIR.0000052627.99976.18. [DOI] [PubMed] [Google Scholar]
- Youngson C, Nurse C, Yeger H, Curnutte JT, Vollmer C, Wong V, Cutz E. Immunocytochemical localization on O2-sensing protein (NADPH oxidase) in chemoreceptor cells. Microsc Res Tech. 1997;37:101–106. doi: 10.1002/(SICI)1097-0029(19970401)37:1<101::AID-JEMT10>3.0.CO;2-V. [DOI] [PubMed] [Google Scholar]