

Abstract
Motivation: RNA-seq is a powerful technology for the study of transcriptome profiles that uses deep-sequencing technologies. Moreover, it may be used for cellular phenotyping and help establishing the etiology of diseases characterized by abnormal splicing patterns. In RNA-Seq, the exact nature of splicing events is buried in the reads that span exon–exon boundaries. The accurate and efficient mapping of these reads to the reference genome is a major challenge.
Results: We developed PASSion, a pattern growth algorithm-based pipeline for splice site detection in paired-end RNA-Seq reads. Comparing the performance of PASSion to three existing RNA-Seq analysis pipelines, TopHat, MapSplice and HMMSplicer, revealed that PASSion is competitive with these packages. Moreover, the performance of PASSion is not affected by read length and coverage. It performs better than the other three approaches when detecting junctions in highly abundant transcripts. PASSion has the ability to detect junctions that do not have known splicing motifs, which cannot be found by the other tools. Of the two public RNA-Seq datasets, PASSion predicted ∼ 137 000 and 173 000 splicing events, of which on average 82 are known junctions annotated in the Ensembl transcript database and 18% are novel. In addition, our package can discover differential and shared splicing patterns among multiple samples.
Availability: The code and utilities can be freely downloaded from https://trac.nbic.nl/passion and ftp://ftp.sanger.ac.uk/pub/zn1/passion
Contact: y.zhang@lumc.nl; k.ye@lumc.nl
Supplementary information: Supplementary data are available at Bioinformatics online.
1 INTRODUCTION
Global transcriptome analyses provide important insights in the qualitative and quantitative aspects of gene expression. A few years ago, transcriptome composition was mainly measured using microarrays. With the development of next-generation sequencing, a massively parallel transcriptome sequencing technology called RNA-Seq has been developed and widely applied in transcriptome profiling. Compared with microarrays, RNA-Seq measures the transcriptome without prior knowledge of genome sequence and enables the detection of previously unknown transcripts. Moreover, RNA-seq is more sensitive toward changes in low abundant transcripts, and has a much broader dynamic range ('t Hoen et al., 2008; van Iterson et al., 2009).
One of the opportunities offered by RNA-seq is the detection of (novel) splice isoforms. Splicing is a process in which introns are excised and the flanking exons are joined to form the mature mRNA. In eukaryotes, almost all multi-exonic genes undergo alternative splicing (Pan et al., 2008; Wang et al., 2008). Recent studies have revealed that variations in splicing patterns are associated with Alzheimer's (Twine et al., 2011) and other complex diseases (Wang and Cooper, 2007). Detection of splicing patterns will therefore not only contribute to the characterization of transcript structures but also help to understand cellular and disease phenotypes.
Discovery of splice junctions using RNA-Seq is mainly achieved by aligning the reads that span exon–exon junctions to the reference genome. Current fast aligners such as Bowtie (Langmead et al., 2009) and BWA (Li and Durbin, 2009) can efficiently map reads to the exon region, but are less efficient in the mapping of reads across splice junctions.
Recently, many dedicated tools for detection of splice junctions have been developed. ALEXA-seq (Griffith et al., 2010) uses an exon–exon junction database of all possible pairwise connections of the known exons from Ensembl to assess the expression, differential expression and alternative expression of known and predicted transcript isoforms. The obvious limitation is that ALEXA-seq can only detect junctions between known exons but is not able to detect alternative transcripts including yet unknown exons.
Other algorithms do not rely on existing transcript annotations. TopHat (Trapnell et al., 2009) is one of the pioneers in this field. It first builds exon islands and connects the potential exons using the known splicing motifs (GT–AG, GC–AG, AT–AC), and finally realigns previously unmapped reads to the joined parts. MapSplice (Wang et al., 2010) first splits reads into smaller segments and then aligns these to the reference genome individually. A potential junction is detected, if a missing segment can be reconstructed by the extension of neighboring exonic segments. All the potential junctions are finally evaluated by a score based on anchor significance and entropy. HMMSplicer (Dimon et al., 2010) first splits the reads into two fragments and aligns them separately to the reference genome. Once a fragment is aligned, a Hidden Markov Model (HMM) is used to detect the most probable splice position, and finally all junctions are scored, filtered and divided into canonical and non-canonical junction sets.
However, these methods have limitations. TopHat cannot detect junctions with novel splicing motifs since it requires the guidance of known splice sites to join exons. Both MapSplice and HMMSplicer divide reads into small segments, and therefore potentially work better for long reads than for short reads. Both studies showed that they perform well on lowly expressed genes but are less accurate on highly abundance transcripts (Dimon et al., 2010; Wang et al., 2010). Moreover, while MapSplice and HMMSplicer are designed to handle both single-end and paired-end reads, neither of them exploit the paired information in their algorithms.
Here we introduce PASSion, a pattern growth-based splice site detection pipeline developed only for the analysis of paired-end RNA-Seq reads. PASSion uses the mapped read in a pair as anchor and then uses a high-resolution algorithm, pattern growth, to remap the proximal and distal fragments of the unmapped read to a local region of the reference indicated by the mate. It is capable of identifying both known and novel canonical and non-canonical junctions with SNP or sequencing error tolerance.
2 METHODS
PASSion computes the precise breakpoints of splice junctions in five stages: initial mapping, building exon islands, high-resolution remapping, filtering and detection of canonical and non-canonical junctions, as shown in Figure 1. In this section, we will first explain the principle of pattern growth. After that, PASSion's different stages are explained. In addition, we will describe how PASSion detects shared and sample specific junctions between multiple samples.
Fig. 1.
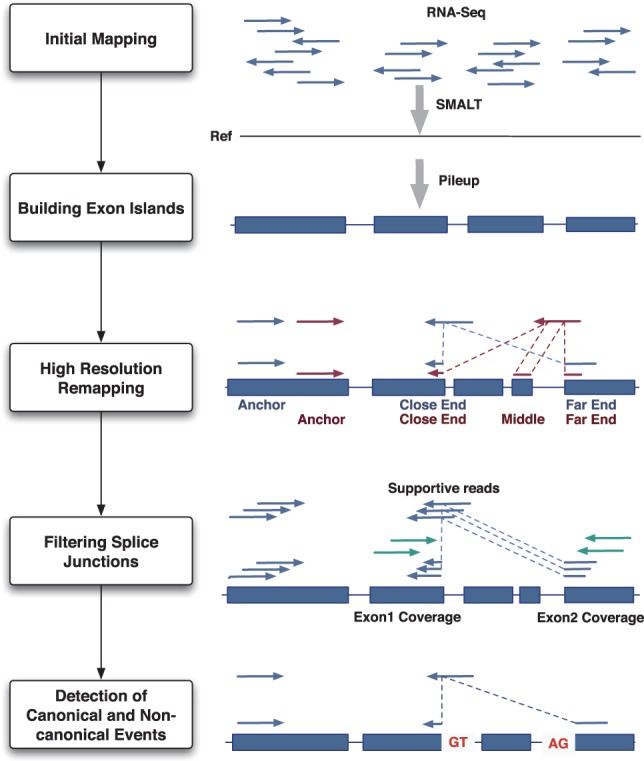
The overview of the PASSion pipeline. Initially, a fast aligner is applied to align the RNA-Seq reads to the reference genome. The exonic reads are then piled up to build the exon islands. Pairs with one exonic read and one unmapped read are then used to identify junctions. For each pair, the location and direction of the exonic read determines the anchor point on the reference genome and the direction in which the unmapped read will be searched for. Knowing the anchor, search direction, exonic region and user-defined maximum insert size, the reads will be remapped to a defined region in the genome from two terminals (and the middle if necessary). A splice junction is reported if the unique substrings from both ends can reconstruct the original split read and has a sufficiently high number of supportive reads. For splice sites with microhomology, canonical and non-canonical motifs are used to finalize the breakpoints. For the junction without splicing motifs, the leftmost breakpoint will be reported.
2.1 Pattern growth
Pattern growth is an approach that can mine various frequent patterns from large databases (Pei et al., 2004). Recently, this algorithm has been implemented for the discovery of protein motif sequences (Ye et al., 2007) and the detection of breakpoints of large deletions and medium-sized insertions in the genome (Ye et al., 2009). Inspired by these applications, we apply pattern growth to the analysis of RNA-Seq data.
Pattern growth can detect the minimum and maximum unique substrings of a given pattern from a sequence. The inputs are a pattern and a reference sequence; while the outputs consist of all unique substrings together with their locations. In theory, the unique substrings can be searched from either the leftmost or the rightmost base of the pattern. Here, we briefly demonstrate how to find the unique substrings starting from the leftmost position of a pattern. The procedure is also illustrated in Table 1.
Table 1.
An example of pattern growth
| i | Subpattern (SPi) | Θ | Feature |
|---|---|---|---|
| 1 | A | 1, 4, 5, 8, 14 | |
| 2 | AT | 2, 9 | |
| 3 | ATG | 10 | SPmin |
| 4 | ATGC | 11 | |
| 5 | ATGCT | 12 | SPmax |
| 6 | ATGCTA | ϕ |
The inputs are a pattern ‘ATGCTA’ and a reference ‘ATCAAGTATGCTTAGC’.
Let a reference sequence R be ‘ATCAAGTATGCTTAGC’ and pattern P be ‘ATGCTA’. The variable i is the growth index starting from 1. Θ is the set of locations where SPi, the substring of pattern starting from position 1 to i, appears in R. First, SP1 is ‘A’, and the locations of ‘A’ in R, which is (1, 4, 5, 8, 14), are stored in Θ . In the second loop, the algorithm will search for SP2 ‘AT’ in the reference and update Θ to (2, 9). As the procedure continues, the minimum unique substring SPmin=SPi when SPi is the first unique substring. Later on, if SPi is unique and SPi+1 is not, then SPi is the maximum substring SPmax. In our example, SPmin = ‘ATG’ and SPmax = ‘ATGCT’. The pattern growth algorithm is implemented in high-resolution remapping stage of the pipeline.
2.2 Pipeline
2.2.1 Initial mapping
PASSion starts with mapping the RNA-Seq reads to the reference genome using SMALT (H. Ponstingl and Z. Ning, manuscript in preparation; http://www.sanger.ac.uk/resources/software/smalt/). SMALT is a recently developed, fast aligner employing a hashing concept similar to SSAHA (Ning et al., 2001). With default settings, it reports the optimal unique mapping for each read. The output format is set to samsoft (‘-f samsoft’) with which the full sequence of read is also included in the SAM (Li et al., 2009) format (so-called ‘soft clipping’). By applying SMALT, reads which have a unique mapping position in the reference (perfect match is not necessary) are referred to as mapped reads.
2.2.2 Building exon islands
All the read alignments detected by SMALT are piled up to the reference genome using SAMtools (Li et al., 2009). The regions covered by at least one read are defined as exon islands, which are the potential search regions. Restricting read remapping to the exon islands will dramatically decrease the search area and thus increase the speed of our algorithm and lead to more unique hits. Some of the reads spanning exon–exon boundaries will be discarded or reported as soft clipping, hence exon boundary region may not be optimally covered. To account for this, exon islands are extended with one insert size on both sides. For PASSion, we do not use the option SMALT offers for the detection of junction boundaries due to sensitivity issues in small exons and system performance reasons (option ‘-p’; H.Ponstingl, personal communication). Alternatively, PASSion can also restrict junction calls to the user-defined regions.
2.2.3 High-resolution remapping
Based on the initial mapping, the paired-end sequences with one mapped and one unmapped reads are utilized for remapping using pattern growth. We apply a local search strategy using the mapped end as an anchor and finding all the unique substrings starting from the leftmost and rightmost position of unmapped reads. Depending on the direction of the anchor, the search area is either downstream or upstream of the exon region of the anchor with the distance of the maximum intron size which is a user-defined parameter. Finally, a junction will be reported when the combination of substrings from the leftmost and rightmost ends makes up the original read. In case both reads in a pair are the mapped reads but the mapping is imperfect, each of them will be used as an anchor and its mate will be remapped accordingly. Due to the existence of small (≤100 nt) exons, some reads may span two splice junctions. These reads should be mapped to the genome as three fragments. Therefore in this stage, we first detect junctions by remapping the reads as two fragments. Reads failing to report junctions will be passed to the second round, in which they will be divided into three fragments.
2.2.3.1 Round 1: aligning reads spanning a single junction
—suppose we have a pair of reads with one read mapped to the reference as anchor, Ranchor, and one unmapped read, Rum, with its potential alignment located downstream of the anchor, as illustrated in Figure 2. Read length is r. First we examine whether the close (relative to the anchor position) fragment of the unmapped read uniquely exists in the reference or not. The search region comprises exonic sequences within the maximum intron size downstream from the anchor. If the minimum substring of the close end is sufficiently long, the close end is then used as an anchor to search for the far end in a similar manner. Finally, we join the substrings of both ends which are Rum[1:i] (close end) and Rum[r−p+1:r] (far end) to construct a read R′um using Equation (1):
| (1) |
where k, j, m and n represent the length of the minimum and maximum substring of Rum starting from the proximal and distal end, respectively; i is the length of a unique substring from the proximal end which is between k and j; p is the length of a unique substring from the distal end which is between m and n. A junction is reported when R′um=Rum.
Fig. 2.

Reconstruct unmapped reads using pattern growth. Using the mapped read as anchor, pattern growth is applied to find the minimum and maximum substrings from the close end of unmapped read, denoted as Cmin and Cmax, respectively in the figure. If succeed, the location of the close end is used as anchor, the far end of unmapped read is searched to find Fmin and Fmax in a similar fashion. If the unique substrings of proximal and distal ends make up the original read, a junction is reported.
2.2.3.2 Round 2: aligning reads spanning a small exon
—when an unmapped read spans a short exon (as showed as the red reads in Fig. 1), the maximum substring of the close and far ends, Rum[1:j] and Rum[r−n+1:r], cannot reconstruct the original read. In this circumstance, the middle string will be extracted and remapped to the genome using pattern growth. The constructed R′um is then the combination of maximum close end Rum[1:j], middle arge≤q≤f Rum[j+1:j+q] and the maximum far end Rum[r−n+1:r], as shown in Equation (2):
| (2) |
where j and n are the length of the maximum substrings of proximal and distal ends; e and f represent the length of the minimum and maximum substring of the middle fragment in Rum; q is the length of a middle string which is between e and f . Two junctions will be reported when R′um=Rum with one between the proximal end and middle, the other between the middle and distal end.
2.2.4 Filtering splice junctions
Since reads are very short fragments and the entire genome contains repetitive regions, it is possible that each step takes false positives into the next steps, eventually generating spurious splice junctions. In our approach, we use a read depth-based strategy to filter out spurious splice junctions.
For each junction, the average expression of the flanking exons is calculated using the read coverage of the donor and acceptor exons divided by the frequency of their splice site, respectively. If the number of supportive reads for a junction is <10% of the average coverage of the more deeply covered flanking exon, the junction is discarded. The user can adjust this cutoff.
2.2.5 Detection of canonical and non-canonical events
We report junctions with length, breakpoint and breakpoint range due to the presence of microhomology (Lee-Theilen et al., 2011). The canonical motif (GT-AG) and two non-canonical motifs (AT-AC, GC-AG) are applied to finalize the breakpoint within the microhomology range with priority order of GT–AG, AT–AC and GC–AG in the forward strand and their reverse complement motifs CT–AC, GT–AT and CT–GC in the reverse strand. For those without motifs, the leftmost breakpoints are used as the final location. The strand of the splicing motifs is used to decide the strand of the junctions.
2.3 Detection of differential and shared splicing patterns
In the package, we provide an additional module to identify the shared and sample specific splice junctions between multiple samples. First, it retrieves all raw junctions (before filtering) and exon coverage from each sample. Then each junction is labeled by a tag indicating in which sample it occurs. After this, junctions are merged and exon coverage are stacked. At the end, the final junctions are reported by applying the filtering scheme to the combined data. As we add a tag to each individual junction, we are able to report per junction how many reads from each sample support it. By merging the raw junctions and then setting the cutoff according to the overall exon coverage, we are aiming at improving sensitivity for shared junctions and to increase specificity for the sample-specific junctions.
2.4 Simulated data
We used human chromosome 17 as the reference and extracted 4837 transcripts >350 bp resulting in 14 654 known splice junctions from Ensembl database. To test the read length effect, short, medium and long libraries were constructed in silico with read lengths and insert sizes of (50 and 200 bp), (75 and 300 bp) and (100 and 500 bp), respectively. Insert size is the length of the two reads together with the non-sequenced part. As gene expression levels in the cell display a broad dynamic range, reads are simulated at different coverage. For each transcript, the reads are simulated at an average coverage of 0.1×, 1×, 5×, 10×, 20×, 30×, 40×, 50×, 60×, 80× and 100× resulting in the overall coding region coverage ranging from 0.2× to 200×. The simulated data are generated using wgsim from SOAPSplice package (http://soap.genomics.org.cn/soapsplice.html) with base error rate and mutation rate of 0.02 and 0.001.
2.5 Real RNA-Seq data
Two RNA-Seq datasets (Accession SRR065497 and SRR065533), which were parts of the ENCyclopedia Of DNA Elements (ENCODE) project, were obtained from EMBL-EBI Sequence Read Archive. SRR065497 is the RNA-Seq data from HepG2 liver carcinoma cells, whereas SRR065533 is from human embryonic stem cells. Both sets are generated by Illumina Genome Analyzer II paired-end sequencing with read lengths of 75 bp and insert sizes of 200 bp, resulting in 17.2M and 17.7M pairs of reads, respectively.
3 RESULTS
3.1 Implementation
PASSion is an RNA-Seq analysis package. The pipeline is written in shell scripts. The key component that utilizes pattern growth to detect the precise splice junction site is implemented in C++ with parallelization. The other elements are implemented in Perl. Currently, it runs on Linux system and requires gcc≥4.3, SMALT and SAMtools to be pre-installed.
3.2 Performance on simulated data
PASSion and three other splice junction detection approaches, TopHat (v1.3.1), MapSplice (v1.15.2) and HMMSplicer (v0.9.5), were first evaluated on the simulated datasets. The minimum and maximum intron sizes were set to 20 bp and 409 600 bp for all approaches. In this range, ∼99% of splice junctions in human are covered (Supplementary Fig. S1b). For the optional parameters, the default values were used. The performance of the four methods on the short, medium and long libraries is displayed in Figure 3. The sensitivity (true positive rate) and specificity (1 − false positive rate) are shown in subfigure (a, b, c) and (d, e, f). Since HMMSplicer separates the predictions into canonical and non-canonical sets, we use HMMSplicer1 to indicate the canonical predictions and HMMSplicer2 to indicate the result of both canonical and non-canonical junctions.
Fig. 3.

Sensitivity and specificity of PASSion, TopHat, HMMSplicer and MapSplice on simulated data. Since HMMSplicer provides two sets of results, we refer to HMMSplicer1 as the results where only canonical junctions are included, while HMMSplicer2 contains both canonical and non-canonical junctions. The performance tested in short, median and long libraries are shown in (a and d), (b and e) and (c and f). For each library, a different read depth is simulated, ranging from an average coverage (x-axis) of 0.2× to 200×.
In general, the sensitivity curves of all the approaches display similar trends, and the main difference is the increasing speed with read coverage. Each of the four methods can detect almost all the true junctions when coverage is >100× fold. In detail, TopHat is less sensitive to the short read library compared with other approaches (Fig. 3a). MapSplice detects the lowest number of junctions when applied to libraries with long reads (Fig. 3c). In all the datasets, the true positive rate of PASSion has the quickest growth rate along with the read coverage and it is the most sensitive method overall. As for HMMSplicer, the sensitivity curves did not differ very much among three libraries but they are slightly lower than those of PASSion.
Upon further inspection of Figure 3a–c, we noticed that at the highest read coverage in each library, the average sensitivities of all approaches reach 94.5, 94.6 and 91.1%, respectively. The decrease in sensitivity for 100 bp library may be due to the existence of small exons. In human, ∼25% of exons are <100 bp (Supplementary Fig. S1a). Therefore, special attention should be paid to the multiple-junction spanning reads when read length is around or >100 bp.
The prediction accuracy is clearly different for the four algorithms as shown in Figure 3d–f. In general, the specificity of TopHat, MapSplice and HMMSplicer drops with the read coverage, where PASSions specificity remains high with specificities >97%. And the high specificity of PASSion is not affected by either read length or coverage. The specificity of HMMSplicer2 (canonical and non-canonical junction sets) is much worse than HMMSplicer1 (canonical junction set). This indicates that the non-canonical junction set contains a high number of false positive predictions. The accuracy of TopHat is not affected by read length. As for MapSplice and HMMSplicer1, their specificities decrease with the increase of coverage; this phenomenon is more dramatical in the 50 bp library (Fig. 3d) than that in 100 bp library (Fig. 3f), indicating that MapSplice and HMMSplicer are more suitable for long reads.
3.3 Prediction of splice junctions for real data
We apply PASSion, TopHat, HMMSplicer and MapSplice to predict junctions for the real data using the same parameter settings as in the simulated data. For convenience, data SRR065497 and SRR065533 are represented by S1 and S2. The results are shown in Table 2. In the predictions, the splice junctions annotated in Ensembl database are labeled as Known. Since RNA-Seq has the ability to detect the novel junctions, the unconfirmed junctions can be novel. We use Unknown.2exons representing the junctions which are not recorded in the database but of which both the donor and acceptor sites are at the known exon boundaries retrieved from Ensembl; Unknown.1exon represents the unknown junctions with either the donor or acceptor sites locates at a known exon boundary; Unknown.0exon are the those which link between two novel exon boundaries. Confirmed ratio is the fraction of the annotated splicing to total number of predictions. Since we noticed that there are too much false junctions in the non-canonical set predicted by HMMSplicer, only the canonical set, HMMSplicer1, is used to compare with the other results.
Table 2.
Predicted splice junctions using PASSion, TopHat, MapSplice and HMMSplicer on two real datasets, SRR065497 and SRR065533 which are represented by S1 and S2
| PASSion |
TopHat |
MapSplice |
HMMSplicer1 |
|||||
|---|---|---|---|---|---|---|---|---|
| S1 | S2 | S1 | S2 | S1 | S2 | S1 | S2 | |
| Prediction | 136 664 | 172 568 | 134 226 | 165 656 | 160 058 | 211 641 | 131 793 | 172 293 |
| Known | 114 884 | 138 594 | 111 681 | 134 067 | 118 720 | 142 306 | 110 961 | 136 313 |
| Confirmed ratio (%) | 84.1 | 80.3 | 83.2 | 80.9 | 74.2 | 67.2 | 84.2 | 79.1 |
| Unknown.2exons | 3760 | 5975 | 4318 | 6323 | 4922 | 7757 | 3724 | 6503 |
| Unknown.1exon | 10 679 | 16 088 | 10 749 | 15 811 | 14 599 | 22 318 | 11 733 | 19 149 |
| Unknown.0exon | 7341 | 11 911 | 7478 | 9455 | 21 817 | 39 260 | 5375 | 10 328 |
From this table, we can observe that PASSion displays a good performance with both a high number of predictions and high confirmed ratios. Known represents the splice junctions annotated in Ensembl database; Unknown.2exons, Unknown.1exon and Unknown.0exon represent the junctions which are not recorded in the database but of which the splice sites are at 2, 1, 0 known exon boundaries, respectively. Confirmed ratio is the fraction of the annotated junctions and the total number of detected junctions; HMMSplicer1 refers to the canonical junctions predicted by HMMSplicer.
Real data are more complicated than the simulated data due to the uneven read coverage induced by the broad dynamic range of gene expression levels. As shown in Table 2, PASSion predicted 136 664 and 172 568 splicing events for the two datasets, of which 84.1 and 80.3% are known junctions annotated in Ensembl database. In general, PASSion displays a balanced performance with both a high number of predictions and high confirmed ratios. Compared with PASSion, TopHat predicted a similarly high percentage of confirmed splice junctions but it predicted slightly less events. HMMSplicer has a similar performance as TopHat, but only when the non-canonical junctions are not included. As for MapSplice, although it gave the highest number of predictions, the fractions of known exon junctions in the prediction, which are 74.2 and 67.2%, are lower than other algorithms, indicating that there are more false positive splice junctions detected.
We further created Venn diagrams showing the overlaps and difference among the four methods for sample S1 (Fig. 4). In the group of Known predictions, showed in Figure 4a, we found that the majority of junctions, that is 97 887, are detected by all four methods; 2157, 744, 2583 and 1282 junctions are PASSion, HMMSplicer, MapSplice and TopHat specific. We then categorized these known junctions by splicing motifs. As can be seen in Table 3, while the other methods cannot find junctions with unknown motifs, PASSion detects 78 junctions in this category (one example is shown in the Supplementary Fig. S4).
Fig. 4.

Venn diagram showing the overlaps in detected splice junctions between PASSion, TopHat, HMMSplicer and MapSplice for sample S1. The overlaps in different category of the predictions are displayed in the subfigures. (a) Known; (b) Unknown.2exons; (c) Unknown.1exon; (d) Unknown.0exon
Table 3.
The detected known splice junctions categorized by splice site motifs
| Known | Total | GT-AG | CT-AC | GC-AG | CT-GC | AT-AC | GT-AT | Unknown motifs | |
|---|---|---|---|---|---|---|---|---|---|
| PASSion | All | 114 884 | 57 501 | 56 236 | 449 | 493 | 55 | 72 | 78 |
| Unique | 2157 | 1018 | 982 | 28 | 35 | 5 | 11 | 78 | |
| TopHat | All | 111 681 | 55 623 | 55 045 | 424 | 469 | 55 | 65 | 0 |
| Unique | 1282 | 578 | 672 | 9 | 14 | 5 | 4 | 0 | |
| MapSplice | All | 118 720 | 60 032 | 58 688 | 0 | 0 | 0 | 0 | 0 |
| Unique | 2583 | 1305 | 1278 | 0 | 0 | 0 | 0 | 0 | |
| HMMSplicer1 | All | 110 961 | 55 660 | 54 394 | 434 | 473 | 0 | 0 | 0 |
| Unique | 744 | 358 | 364 | 9 | 13 | 0 | 0 | 0 |
CT–AC, CT–GC and GT–AT are the reverse complement motifs of GT–AG, GC–AG and AT–AC, respectively.
Moreover, we found that the proportion of the commonly detected junctions to the ones detected by just a single method in the Known group is 82–88%. For junctions in the Unknown.2exons, Unknown.1exon and Unknown.0exon groups, this overlap is considerably lower at 38–45%, 28–39 and 7–29%, respectively, demonstrating that the confidence decreases with less database information support. Again, MapSplice predicts 21 817 junctions in the lowest confidence group, in which 17402 are MapSplice specific, indicative of a high number of false positives.
The CPU running time and memory usage of four methods are listed in the Supplementary Table S1. When we run PASSion, TopHat, MapSplice and HMMSplicer on two sets of real data, all the jobs are submitted to the farm cluster of Welcome Trust Sanger Institute. As can be seen in the Table, Mapsplice is the fastest; TopHat uses the least memory, PASSion consumes the most memory and HMMSplicer is the slowest.
3.4 Detection of shared and sample-specific junctions
To assess PASSion's ability to report junctions from different samples, we applied the multi-sample module to predict the shared and sample specific exon–exon junctions for the real RNA-Seq data S1 and S2. As shown in Figure 5a, we detected 109 130 exon–exon junctions supported by the reads from both samples. Each junction has 22 reads for support in median; 28 927 splice events only appeared in S1 and 63 889 junctions exclusively occur in S2. As for the sample-specific junctions, the median number of supportive reads is 1 and 2 for S1 and S2, respectively. This gives an indication that many genes are lowly expressed. The coverage of the junctions unique to one of the two cell lines and those shared are plotted in Supplementary Figure S2.
Fig. 5.

PASSion predicted the shared and sample specific exon–exon junctions for the real RNA-Seq samples S1 and S2. (a) Venn diagram, (b) junctions located at chr17: 48 600 000–48 770 000 visualized by UCSC browser in which PASSion track is on the top of the UCSC gene track. The unique junctions in S1 and S2 are depicted in red and green, respectively; The splice events that occur commonly in S1 and S2 are showed in black.
Different categories are recorded with different colors in the final BED file. Figure 5b illustrated the junctions located at chr17:48 600 000–48 770 000 visualized by the UCSC genome browser. As can be seen, almost all the splice junctions existing in gene ABCC3 are from sample S1 (depicted in red) indicating that gene ABCC3 is only expressed in HepG2 liver carcinoma cells; while at upper stream of gene ABCC3, all the exon–exon junctions of gene CACNA1G are sample S2 specific showing this gene is exclusively expressed in the human embryonic stem cells. We also found that gene SPATA20 is expressed in both samples since the majority of the splicing events occurred both in S1 and S2 (showed in black). However, there also exist three S1 specific (red) and two S2 specific (green) junctions, indicating that each sample may have different transcript isoforms of gene SPATA20.
4 DISCUSSION
We have presented PASSion, a package that is capable of capturing both annotated and novel splice junctions with high accuracy. Instead of using the popular data structures applied in next-generation sequencing analysis, e.g. suffixarray and hash table, the key component of PASSion is based on pattern growth which has not been applied in RNA-Seq analysis before. In addition, PASSion currently can facilitate the discovery of differential and shared splicing patterns from multiple samples.
One unique advantage distinguishing PASSion from TopHat, MapSplice and HMMSplicer is that PASSion can detect the splice junctions with unknown motifs, which are missed by the other tools. In PASSion, splicing motifs are not used in the main stages of junction detection, which are building exon islands, high-resolution remapping and filtering. Only in the last step of the pipeline, canonical and non-canonical motifs are applied to finalize the breakpoint within the microhomology range. For those without motifs, they also will be reported with the leftmost breakpoint as the final location.
Another advantage is that PASSion is very accurate for highly abundant transcripts. It is shown that in sample S1, a small fragment of genes, ∼3%, are highly expressed with read coverage >100× (Supplementary Fig. S3). In the case of pooling RNA-Seq datasets, more transcripts will be highly covered. Currently, many algorithms can accurately analyze low abundance transcripts, but are less efficient for detecting junctions in highly expressed genes. However, PASSion has a high true positive rate for both low and high abundance transcripts. First, the application of a local search strategy helped to rule out potential false locations. Secondly, we used pattern growth, a high-resolution algorithm which can be accurate to a single nucleotide level. Together with the aid of splice site motifs, PASSion is able to predict precise breakpoints of exon–exon junctions without any nucleotide shift. The third and most important factor is the read depth-dependent cutoff filtering. By default, PASSion reports junctions where the depth of supportive reads is >10% of the average coverage of the more highly expressed flanking exon. It seems quite simple but effective. This filtering scheme is similar to the minimum minor isoform frequency parameter in TopHat, in which junctions are reported if the abundance of the supportive reads is at least 15% of the depth of more deeply covered exons. MapSplice and HMMSplicer use very complicated scores to remove the spurious junctions but are less effective for highly abundant transcripts.
As for the memory usage, PASSion consumes ∼9 GB memory for 17.2M pairs of 75 bp long reads with the default settings. The memory usage can be improved by setting a smaller bin size parameter, since reads are processed per bin. Theoretically, reducing the bin size will increase the frequency of file reading and writing, but it will not significantly increase the CPU processing time. Currently, PASSion is the third fastest method according to the CPU processing time. The wall time can be decreased by setting up to eight parallel threads at initial mapping and high-resolution remapping, which are the most time-consuming steps. Moreover, with computer resources becoming cheaper and cheaper and more computer clouds and clusters becoming available, memory and CPU running time will not be the bottleneck for computing. Accuracy should be the more important concern in data analysis.
Nevertheless, we still missed some rare splicings mediating cross chromosome gene fusion, because we assume that both reads in a pair are mapped to the same chromosome. It will be one of the tasks to tackle in the near future. Besides, we are also interested in detecting allele-specific expression and RNA editing events. Quantification of these post-transcriptional modifications will contribute to study imprinting, regulation of differential expression and differential stability of genes or transcripts. Eventually such detailed analysis will increase our understanding of cell and disease phenotypes.
Currently, more and more labs prefer to sequence RNA using the paired-end protocol due to the obvious advantages provided by paired-end reads over single-end reads. PASSion's ability to take advantage of paired-end reads together with its overall high performance will make PASSion a valuable tool for RNA-Seq data analysis in the future.
Supplementary Material
ACKNOWLEDGEMENTS
We thank Dr Hannes Ponstingl for his advices on the use of SMALT and Erik van den Akker for his comments on the manuscript.
Funding: Netherlands Consortium for Healthy Ageing in the framework of the Netherlands Genomics Initiative/Netherlands Organization for Scientific Research (Grant no. 05060810); European Union's Seventh Framework Programme (FP7/2007-2011) under grant agreement (no. 259679), IDEAL; Netherlands Organization for Scientific Research VENI (Grant no. 639.021.125) (in part); European Commission 7th Framework Program Project (no. 261123), GEUVADIS (in part); Centre for Medical Systems Biology within the framework of the Netherlands Genomics Initiative/Netherlands Organisation for Scientific Research (in part).
Conflict of Interest: none declared.
REFERENCES
- Dimon M.T., et al. HMMSplicer: a tool for efficient and sensitive discovery of known and novel splice junctions in RNA-seq data. PLoS One. 2010;5:e13875. doi: 10.1371/journal.pone.0013875. [DOI] [PMC free article] [PubMed] [Google Scholar]
- Griffith M., et al. Alternative expression analysis by RNA sequencing. Nat. Methods. 2010;7:843–847. doi: 10.1038/nmeth.1503. [DOI] [PubMed] [Google Scholar]
- Langmead B., et al. Ultrafast and memory-efficient alignment of short DNA sequences to the human genome. Genome Biol. 2009;10:R25. doi: 10.1186/gb-2009-10-3-r25. [DOI] [PMC free article] [PubMed] [Google Scholar]
- Lee-Theilen M., et al. CtIP promotes microhomology-mediated alternative end joining during class-switch recombination. Nat. Struct. Mol. Biol. 2011;18:75–79. doi: 10.1038/nsmb.1942. [DOI] [PMC free article] [PubMed] [Google Scholar]
- Li H., Durbin R. Fast and accurate short read alignment with Burrows Wheeler transform. Bioinformatics. 2009;25:1754–1760. doi: 10.1093/bioinformatics/btp324. [DOI] [PMC free article] [PubMed] [Google Scholar]
- Li H., et al. The sequence Alignment/Map format and SAMtools. Bioinformatics. 2009;25:2078–2079. doi: 10.1093/bioinformatics/btp352. 1000 Genome Project Data Processing Subgroup. [DOI] [PMC free article] [PubMed] [Google Scholar]
- Ning Z., et al. SSAHA: a fast search method for large DNA databases. Genome Res. 2001;11:1725–1729. doi: 10.1101/gr.194201. [DOI] [PMC free article] [PubMed] [Google Scholar]
- Pan Q., et al. Deep surveying of alternative splicing complexity in the human transcriptome by high-throughput sequencing. Nat. Genet. 2008;40:1413–1415. doi: 10.1038/ng.259. [DOI] [PubMed] [Google Scholar]
- Pei J., et al. Mining sequential patterns by pattern-growth: the PrefixSpan approach. Trans. Knowl. Data Eng. 2004;16:1424–1440. [Google Scholar]
- Trapnell C., et al. TopHat: discovering splice junctions with RNA-seq. Bioinformatics. 2009;25:1105–1111. doi: 10.1093/bioinformatics/btp120. [DOI] [PMC free article] [PubMed] [Google Scholar]
- Twine N.A., et al. Whole transcriptome sequencing reveals gene expression and splicing differences in brain regions affected by Alzheimer's disease. PLoS One. 2011;6:e16266. doi: 10.1371/journal.pone.0016266. [DOI] [PMC free article] [PubMed] [Google Scholar]
- 't, Hoen P.A., et al. Deep sequencing-based expression analysis shows major advances in robustness, resolution and inter-lab portability over five microarray platforms. Nucleic Acids Res. 2008;36:e141. doi: 10.1093/nar/gkn705. [DOI] [PMC free article] [PubMed] [Google Scholar]
- van Iterson M., et al. Relative power and sample size analysis on gene expression profiling data. BMC Genomics. 2009;10:439. doi: 10.1186/1471-2164-10-439. [DOI] [PMC free article] [PubMed] [Google Scholar]
- Wang E.T., et al. Alternative isoform regulation in human tissue transcriptomes. Nature. 2008;456:470–476. doi: 10.1038/nature07509. [DOI] [PMC free article] [PubMed] [Google Scholar]
- Wang G.-S., Cooper T.A. Splicing in disease: disruption of the splicing code and the decoding machinery. Nat. Rev. Genet. 2007;8:749–761. doi: 10.1038/nrg2164. [DOI] [PubMed] [Google Scholar]
- Wang K., et al. MapSplice: accurate mapping of RNA-seq reads for splice junction discovery. Nucleic Acids Res. 2010;38:e178. doi: 10.1093/nar/gkq622. [DOI] [PMC free article] [PubMed] [Google Scholar]
- Ye K., et al. An efficient, versatile and scalable pattern growth approach to mine frequent patterns in unaligned protein sequences. Bioinformatics. 2007;23:687–693. doi: 10.1093/bioinformatics/btl665. [DOI] [PubMed] [Google Scholar]
- Ye K., et al. Pindel: a pattern growth approach to detect break points of large deletions and medium sized insertions from paired-end short reads. Bioinformatics. 2009;25:2865–2871. doi: 10.1093/bioinformatics/btp394. [DOI] [PMC free article] [PubMed] [Google Scholar]
Associated Data
This section collects any data citations, data availability statements, or supplementary materials included in this article.