

Abstract
Neurodegeneration observed in lentiviral-associated encephalitis has been linked to viral-infected and -activated central nervous system macrophages. Wehypothesized that lentivirus, macrophages, or both lentivirus and macrophages within distinct microenvironments mediate synaptic damage. Using the simian immunodeficiency virus (SIV)-infected macaque model, we assessed the relationship between virus, macrophages, and neurological damage in multiple brain regions using laser confocal microscopy. In SIV-infected macaques with SIV encephalitis (SIVE), brain tissue concentrations of SIV RNA were 5 orders of magnitude greater than that observed in nonencephalitic animals. In SIVE, staining for postsynaptic protein microtubule-associated protein-2 was significantly decreased in the caudate, hippocampus, and frontal cortical gray matter compared to nonencephalitic controls, whereas staining for presynaptic protein synaptophysin was decreased in SIV-infectedmacaques with and without encephalitis. These data suggest that presynaptic damage occurs independent of pathological changes associated with SIVE, whereas postsynaptic damage is more tightly linked to regional presence of both activated and infected macrophages.
Approximately 25% of human immunodeficiency virus (HIV)-infected patients develop human immunodeficiency virus encephalitis (HIVE).1-4 A more variable percentage of simian immunodeficiency virus (SIV)-infected macaques develop SIVE, depending on macaque species and viral strain.5-12 HIVE, the pathological substrate of HIV-associated dementia, generally develops in AIDS patients with advanced immunosuppression.13-15 Pathologically, HIV-associated dementia is characterized by the presence of microglial nodules, multinucleated giant cells, and abundant HIV-infected macrophages as determined by immunocytochemistry, in situ hybridization, or quantitative HIV RNA assessment.16,17 Clinically, patients experience cognitive, motor, and behavioral deficits18 that are attributed to neuronal damage and loss.15,19-24
Despite the absence of convincing evidence of neuronal infection, neurodegeneration has been reported in both HIV and SIV infection.5,6,9,16,25 Some studies suggest neural damage can occur even in the absence of significant infection within the brain. SIVmac251-infected cynomolgus monkeys exhibit dendritic damage even in the absence of encephalitis or detectable central nervous system (CNS) virus.26 However, the majority of studies link profuse activated and lentiviral-infected brain macrophages to neurodegeneration.5,8,12,15,17,21,24,27-32 It is unclear whether neurodegeneration is caused by direct effects of the virus, indirect effects of infection, or both. Many studies have suggested the secreted products of activated macrophages might directly act on neurons or indirectly act on supporting glial cells initiating synaptic damage and neuronal death.33-44
Both presynaptic and postsynaptic damage have been reported during HIVE.19-24,26,45,46 This suggests that there is disruption in neuronal circuitry that could cause neurological deficits and lead to neuronal loss. Synaptophysin (SYN), a 38-kd calcium-binding protein associated with membranes of neuronal presynaptic vesicles and involved in neurotransmitter release, is widely used to mark presynaptic terminals and to approximate synaptic density.22,47-51 Loss of synaptophysin immunoreactivity has been interpreted as morphological evidence of presynaptic neuronal damage and is closely associated with signs and symptoms observed in several chronic dementias.45,52-58 Similarly, microtubule-associated protein-2 (MAP-2), a high molecular weight protein found in neuronal cell bodies and dendrites, is widely used to mark postsynaptic elements.26,56,57,59,60 MAP proteins are involved in the polymerization of tubulin into microtubules and help provide physical stability to microtubule formations. Loss of MAP-2 immunoreactivity has been interpreted as morphological evidence of dendritic pathology.59,60 The universal response of CNS tissue to any nonspecific damage is gliosis. Gliosis is readily identified by immunohistochemical staining for glial fibrillary acidic protein (GFAP), a 52-kd intermediate filament protein found in astrocytes.
There is substantial controversy regarding the relative role of virus and activated macrophages in mediating lentiviral-associated neurodegeneration. Using the SIV-infected macaque model, we assessed the relationship between virus and macrophages and neurological damage by laser confocal microscopy. We found that some regions of the CNS in infected macaques showed presynaptic damage during systemic infection independent of the presence of encephalitis. However, we observed that lentiviral encephalitis was distinctly associated with severe synaptic damage and tightly linked with the presence of both activated and infected macrophages. The microscopic multifocality of the infectious process was similarly reflected in the focality of the neurological damage.
Materials and Methods
Animals
Rhesus macaques (Macaca mulatta) were housed and maintained according to strict American Association of Laboratory Animal Care standards. Macaque infection parameters are described in Table 1▶ . Six rhesus macaques derived from vaccine trials, challenged with viral swarm SIVdeltaB670 (SIV/dB670), and sacrificed were used in this study. Two macaques were involved in vaccine studies. Two macaques were administered PMPA [9-R-(2-phosphonomethoxypropyl)adenine] 24 hours before inoculation with SIV. Macaques were infected intravenously with SIV/deltaB670 (n = 4), via bronchoscope with bronchial alveolar lavage from an animal infected with SIV/dB670 (n = 1), or rectally with SIV/dB670 and a subsequent infection via bronchoscope with bronchoalveolar lavage from an animal infected with SIV/dB670 (n = 1). Because the focus of this study was on CNS manifestations due to CNS SIV infection, the divergent routes of infection and clinical history in this group of animals does not impact directly on the final outcome of CNS disease. Ages of the macaques used in this study ranged from 33 to 100 months. Length of infection varied from 37 to 379 days. Macaques were sacrificed when moribund with AIDS (Table 2)▶ . Only two macaques (macaques 603 and 221) exhibited neurological signs consisting of decreased feeding, decreased spontaneous movement, neglect of novel environmental stimuli, lethargic response to physical stimulation, and variable focal neurological signs. Two noninfected macaques served as controls. Complete necropsies were performed after humane sacrifice.
Table 1.
Macaque Infection Parameters
| Monkey group* | Monkey number | Sex | Age, months | Virus | Inoculation route† | Length of infection, days |
|---|---|---|---|---|---|---|
| Severe SIVE | 604 | F | 33 | SIV/dB670 | i.v. | 116 |
| 603 | M | 75 | SIV/dB670 | i.v. | 81 | |
| 221 | M | 70 | SIV/dB670 | BAL | 37 | |
| SIV without encephalitis | 9221 | M | 100 | SIV/dB670 | Rectal/BAL | 379 |
| 234 | M | 44 | SIV/dB670 | i.v. | 360 | |
| 236 | F | 42 | SIV/dB670 | i.v. | 367 | |
| Control | 421 | F | 66 | NA | NA | NA |
| 422 | M | 53 | NA | NA | NA |
*Severe SIVE is defined as the histopathological presence of abundant SIV-infected microglial nodules and multinucleated giant cells. Rare/no microglial nodules and no multinucleated giant cells were observed in SIV-infected macaques without encephalitis. Each macaque used in this study showed no histopathological abnormalities outside those associated with SIV encephalitis/infection. Control noninfected macaques showed no gross or microscopic pathological changes.
†Some macaques were inoculated by intravenous (i.v.) routes. Macaque 221 was inoculated via bronchoscope with the bronchial alveolar lavage (BAL) from another macaque infected with SIV/dB670. Macaque 9221 was initially infected by rectal inoculation followed by another infection with the BAL from a SIV/dB670-infected macaque via bronchoscope.
NA, not applicable; SIV/dB670, SIV/deltaB670.
Table 2.
Clinical Symptoms and Peripheral Blood Studies
| Monkey group | Monkey number | Peripheral viral load* | Lymphocytes, % | Total % CD4 cells | Clinical symptoms† |
|---|---|---|---|---|---|
| Severe SIVE | 604 | 6.00 × 10⁷ | 21 | 47 | Anorexia, weight loss, electrolytes deteriorating |
| 603 | 5.30 × 10⁸ | 37 | 37 | Anorexia, weight loss, neurological signs | |
| 221 | 1.90 × 10⁸ | 14 | 32 | Weight loss, neurological signs | |
| SIV without encephalitis | 9221 | 6.40 × 10⁵ | 34 | 20 | Weight loss, upper respiratory symptoms |
| 234 | 2.06 × 10⁵ | 43 | 39 | No symptoms | |
| 236 | 4.70 × 10² | 32 | 33 | No symptoms | |
| Control | 421 | NA | NA | NA | No symptoms |
| 422 | NA | NA | NA | No symptoms |
*Numbers reflect the total SIV/RNA copies/ml plasma at time of death.
†Neurological signs are described in the Material and Methods section.
NA, not applicable.
CD4+ Cell Counts
Buffy coats from peripheral blood obtained from SIV-infected macaques immediately before euthanasia were labeled with fluorochrome-conjugated monoclonal antibodies against CD4 (OKT4; Coulter, Hialeah, FL). Two-parameter light-scatter profiles were used to gate the lymphocyte population and to determine the percentage of CD4+ lymphocytes. Absolute CD4+ cell numbers were calculated using percent CD4+ lymphocytes and differential cell counts from the blood as previously described.61
Tissue
Brains were removed immediately after euthanasia and processed for analysis. The left hemisphere was cut into regional blocks and stored at −80°C. The right hemisphere was fixed in 10% buffered formalin (Fisher Scientific, Pittsburgh, PA). Coronal sections were made, and tissue blocks were paraffin-embedded. Six-μm sections were made for pathological analysis.
Quantitation of SIV RNA in Brain Tissue
For real-time polymerase chain reaction (PCR) analysis, total RNA was isolated from ∼100 mg of frozen (−80°C) brain tissue from frontal neocortical gray and white matter, occipital neocortical gray and white matter, caudate, putamen, globus pallidus, hippocampus, and cerebellum. RNA isolation was performed using Trizol reagent (Life Technologies, Inc., Rockville, MD) according to the manufacturer’s recommendations. Pelleted total RNA isolated from brain tissue was dissolved in molecular biology grade water and SIV gag-encoding sequences quantified by real time PCR in an Applied Biosystems Prism 7700 (Applied Biosystems, Foster City, CA) as previously described.62 The threshold sensitivity of this method was 10 copy Eq/reaction, typically corresponding to 1 μg of input total RNA, or the equivalent of ∼0.9 mg of brain tissue. The RNA assay was normalized based on input RNA but reported here as copy Eq/mg tissue. The RNA yield from animal to animal was very consistent at 0.87 μg of RNA/mg tissue ± 0.15 (mean ± SD). Region to region RNA yield varied as expected (0.6 to 1.4 μg of RNA/mg tissue) with cerebellum > neocortical gray matter > caudate = putamen = globus pallidus = hippocampus > neocortical white matter.
Quantitation of SIV RNA in Plasma
Quantitation of virion-associated RNA in plasma was performed by real-time PCR in a Prism 7700 (ABI). Virions were pelleted from 1 ml of plasma by centrifugation at 14,000 × g for 1 hour. Total RNA was extracted from the virus pellet using Trizol (Life Technologies, Inc.) and 20 μl of each sample was analyzed in a 96-well plate. Synthesis of cDNA was accomplished in triplicate reactions containing 5.0 nmol/L MgCl2, 1× PCR buffer II, 0.75 mmol/L of each dNTP, RNase inhibitor, 1.2 U MULV reverse transcriptase, 2.5 μmol/L random hexamers, and 10% of total viral RNA. Samples were mixed and incubated at room temperature for 10 minutes followed by 42°C for 12 minutes and the reaction terminated by heating at 99°C for 5 minutes then cooling to 4°C for 5 minutes. The PCR reaction was then initiated by adding 30 μl of a PCR master mix containing 1× PCR buffer A, 5.5 mmol/L MgCl2, 2.5 U of AmpliTaq Gold, 200 mmol/L of each dNTP, 450 nmol/L of each primer, and 200 nmol/L of probe. The primers and probe used were: forward primer U5/LTR, 5′AGGCTGGCAGATTGAGCCCTGGGAGGTTTC3′; reverse primer 5′ R region of LTR, 5′CCAGGCGGCGACTAGGAGAGATGGGAACAC3′; andprobe 6FAM, 5′TTCCCTGCTAGACTCTCACCAGCACTTGG-3′TAMRA. The amplification was performed by heating at 95°C for 10 minutes to activate AmpliTaq Gold (Perkin Elmer), followed by 40 cycles of 95°C for 15 seconds, 55°C for 15 seconds, and 72°C for 30 seconds. Serial dilutions of RNA ranging from 108 to 100 copies/reaction obtained by in vitro transcription of a plasmid containing the target LTR region were subjected to RT-PCR reaction in triplicate along with the samples to generate the standard curve with a sensitivity threshold of 100 copies/reaction. RNA copy numbers from the unknown plasma samples were calculated from the standard curve and expressed as RNA copies/ml plasma.
Histology
Paraffin sections of brain tissue containing putamen, caudate, neocortical gray and white matter, and hippocampus were stained with hematoxylin and eosin (H&E) and assessed for the presence of SIVE. SIVE was empirically defined as the presence of microglial nodules and multinucleated giant cells, and profuse perivascular mononuclear infiltrates. To assess the distribution and abundance of macrophages and SIV morphologically, we used a monoclonal antibody against a macrophage/microglia-associated protein CD68 (clone KP1;DAKO, Carpinteria, CA) and a polyclonal antibody against the SIV envelope gp110 (generously provided by Dr. Kelly Stefano Cole and Dr. Ron Montelaro, University of Pittsburgh, Pittsburgh, PA), respectively. Three of the infected macaques showed histological findings of SIVE. The remaining three SIV-infected macaques did not show histopathological features of SIVE, however, neuropathological findings in these three SIV-infected macaques included rare perivascular infiltrates. Each SIV-infected macaque used in this study showed no histopathological abnormalities outside those associated with SIV encephalitis/infection. The noninfected control macaque brains showed no histopathological abnormalities.
Immunofluorescent Histochemistry
Paraffin sections containing putamen, caudate, neocortical gray and white matter, and hippocampus were deparaffinized in Histoclear (3 × 5 minutes) (National Diagnostics, Atlanta, GA). Sections were rehydrated as follows: 100% ethanol (2 × 5 minutes), 95% ethanol (1 × 5 minutes), 70% ethanol (1 × 5 minutes), and H2O (1 × 5 minutes). Rehydrated sections were immersed in 3% H2O2 (Sigma, St. Louis, MO) in 70% methanol (J. T. Baker, Phillipsburg, NJ) (1 × 30 minutes) to block endogenous peroxidase activity. To unmask antigens, sections were incubated in Target Retrieval Solution (DAKO) at 97°C for 1 hour. Sections were cooled (1 × 30 minutes, room temperature) and blocked with 10% normal goat serum (DAKO). Sections were incubated with mouse-monoclonal antibody against a macrophage lysosomal-associated protein CD68 and rabbit polyclonal antibody to the SIV envelope protein SIV-gp110 (1:50,000 and 5 μg/ml dilutions, respectively, at 4°C overnight). The mouse monoclonal antibody CD68 could not be detected by Cy3-conjugated goat anti-mouse IgG at the concentration used in this staining protocol, so the CD68 signal was amplified using the commercially available Tyramide Signal Amplification kit (NEN Life Science Products, Boston, MA).63 Sections were incubated with biotinylated goat anti-mouse IgG serum (Jackson ImmunoResearch Laboratories, Inc., West Grove, PA) (1:200, room temperature, 1 hour). After being washed with 0.5% Tween-20 buffer, sections were incubated with blocking buffer (room temperature, 30 minutes) followed by horseradish peroxidase-conjugated streptavidin (1:500 in blocking buffer, room temperature, 30 minutes). Sections were washed with 0.5% Tween-20 buffer and incubated with fluorescein-conjugated tyramide (1:100 in 1× Amplification Diluent, room temperature, 10 minutes). After washing with 0.5% Tween-20 buffer, sections were incubated with one of the following mouse monoclonal antibodies: MAP-2 (1:1500, SMI 52; Sternberger Monoclonals Inc., Lutherville, MD), synaptophysin (1:100, SY 38; DAKO), or GFAP (1:500, 6F2; DAKO). Sections were incubated with Cy5-conjugated goat anti-mouse IgG and Cy3-conjugated goat anti-rabbit IgG (Jackson ImmunoResearch Laboratories, Inc.) (1:200, room temperature, 1 hour).
The fluorogen tags used to detect synaptic proteins are noted in the figure legends. Slides were mounted in gelvatol64 and fluorescence quantified as described below in the laser confocal microscopy quantification section.
Peroxidase Immunohistochemical Staining
Paraffin-embedded tissue sections were deparaffinized by incubation at 60°C for 15 minutes, immersion in xylenes twice for 8 minutes each, and dehydration in graded ethanols. Tissues were pretreated by microwaving at 2-minute intervals for a total of 10 minutes at settings between 60 to 20% maximal power in 0.01 mol/L of citrate buffer (pH 6.0). The buffer was replenished as needed to ensure that the tissue sections did not dry out. Slides were then blocked in 5% nonfat dry milk in 1× phosphate-buffered saline (PBS) for 1 hour. Tissue sections were then incubated with a CD68-specific monoclonal antibody at a 1:50 dilution for 45 minutes and washed with 1× PBS three times, 5 minutes each. The bound monoclonal antibody was then detected using the avidin-biotin complex approach with the Vectastain Elite System (Vector Laboratories, Burlingame, CA). Sections were incubated with biotinylated goat anti-mouse secondary antibody for 30 minutes and washed as before. They were then incubated with an avidin/horseradish peroxidase conjugate for 30 minutes and again washed as before. All incubations were performed at room temperature. Immunohistochemical signal (brown staining) was provided by the action of horseradish peroxidase on the substrate 3,3′-diaminobenzidine. Slides were counterstained with propidium iodide to stain the nuclei by incubating in 1× PBS containing 10 mg/ml of propidium iodide for 30 minutes at room temperature in the dark. Slides were then washed by rinsing in 1× PBS and double-distilled water, dehydrated in graded ethanols, cleared in xylenes, and mounted with Permount (Fisher).
Laser Confocal Microscopy Quantification
Consecutive sections were stained with H&E or immunohistochemically stained as described above. A dissecting microscope was used to identify anatomical regions on the H&E-stained section. Five regions of the SIV-infected macaque brains containing putamen, caudate, neocortical frontal gray and white matter, and hippocampus were identified on the immunofluorescent stained slides. The marked H&E tissue section was matched with the consecutive, immunostained tissue section, and the marked regions were traced on the immunofluorescent section. Immunohistochemically stained sections containing regions of interest were analyzed by laser confocal microscopy (Molecular Dynamics, Sunnyvale, CA). The illumination was provided by an argon/krypton laser with 488-, 568-, and 647-nm primary emission lines. Each image was scanned along the z-axis and the middle sectional plane was found (262,144 pixels per plane; 1 pixel, 0.25 μm2). Images were collected on a Silicon Graphics Inc. computer (Operating System Release 5.3, Farmington, MI) and analyzed using the Image Space software (Version 3.2, Molecular Dynamics). All multiple-label immunofluorescent images are 10-section projections.
Each brain region from every macaque was randomly scanned in 10 microscopic areas (40×). The specimen was first scanned for fluorescein isothiocyanate (FITC) and Cy3 signals. Subsequently, the specimen was rescanned for Cy5 signal in the same sectional plane. All specimens were scanned at the same laser power aperture, gain, and photomultiplier tube settings for each wavelength. The number of pixels emitted by each signal was counted using the same collection parameters. Each area scanned encompasses an area of 67,600 μm2.
For quantification of SIV-gp110 or CD68 pixels, pixel counts were obtained from 10 microscopic areas within five brain regions. To compare the pixel counts collected in each brain region, the average pixel count was determined for each brain region within the three SIV-infected macaques without encephalitis. Then for every macaque, each pixel value in a brain region was divided by the average pixel count in the analogous brain region of the SIV-infected macaques. The means of the normalized values were then calculated for each brain region in the SIV-infected macaques with and without encephalitis and control macaques and reported as fold difference in pixel counts. The fold difference in pixel counts for SIV-infected macaques with and without encephalitis each represent three macaques in which 10 areas in each brain region/macaque were scanned, giving a fold pixel count from 30 total areas. Fold difference in pixel counts for control macaques represent two macaques in which 10 areas in each brain region/macaque were scanned, giving a fold pixel count from 20 total areas.
For quantification of MAP-2, synaptophysin, or GFAP pixels, pixel counts were obtained from 10 microscopic areas within five brain regions. To compare the pixel counts collected in each brain region, the average pixel count was determined for each brain region within the three SIV-infected macaques without encephalitis. Then for every macaque, each pixel value in a brain region was divided by the average pixel count in the analogous brain region of the normal, control macaques. The medians of the normalized values were then determined for each brain region in the SIV-infected macaques with and without encephalitis and control macaques, averaged, and reported as fold difference in pixel counts. The fold difference in pixel counts for SIV-infected macaques with and without encephalitis each represent three macaques in which 10 areas in each brain region/macaque were scanned, giving a fold pixel count from 30 total areas. Fold difference in pixel counts for control macaques represent two macaques in which 10 areas in each brain region/macaque were scanned, giving a fold pixel count from 20 total areas.
Image Capture and Peroxidase Immunohistochemistry Quantitation
Quantitation of the CD68-specific immunoreactivity of stained tissue sections was performed by capturing bright-field microscopic images in five random fields for each microanatomic location. Images were captured with a Spot RT Camera mounted on a Nikon E600 fluorescence microscope using a 60× Plan Apochromat objective. Image capture and analysis was performed using the Metaview software package (Universal Imaging Corporation). Each image was subjected to red, green, and blue color separation and the green signal was converted to monochrome. The image was then thresholded to highlight immunoreactive areas of the field and the percentage of surface area that was CD68-immunoreactive was measured. For each image the corresponding propidium iodide-stained image was captured using a FITC filter cube and the number of nuclei in each field was counted manually.
Statistical Analysis
Comparisons of pixel count, SIV RNA, and clinical parameter variances among groups were analyzed by two-way, unpaired Student’s t-test. A P value of <0.05 was considered significant. Correlation coefficients and t-tests were determined using Microsoft Excel:Mac 2001.
Results
Total CD4+ T Cell Counts Were Not Different in SIV-Infected Macaques with and without Encephalitis, However, Plasma SIV RNA Concentrations Were Higher in Macaques with SIVE
Tables 1 and 2▶ ▶ summarize clinical data from the six SIV-infected and two noninfected rhesus macaques evaluated in this study. Macaques that developed neurological signs had to be euthanized because of declining health after shorter periods of infection (P = 0.004) (Table 1)▶ . The two macaques (macaques 603 and 221) with neurological signs had SIVE, however, we had no direct means of determining how long they had encephalitis. The plasma viral loads at time of sacrifice for each macaque in the severe SIVE group were 2 to 5 orders of magnitude higher than those measured in SIV-infected macaques without encephalitis (P = 0.2) (Table 2▶ , Figure 1B▶ ). Absolute CD4 counts between SIV-infected macaques with and without encephalitis were similar (Table 2)▶ . However, because of the heterogeneity of the peripheral infection in these macaques (eg, length of infection) these observations have no direct reflection on the CNS infection in these macaques.
Figure 1.
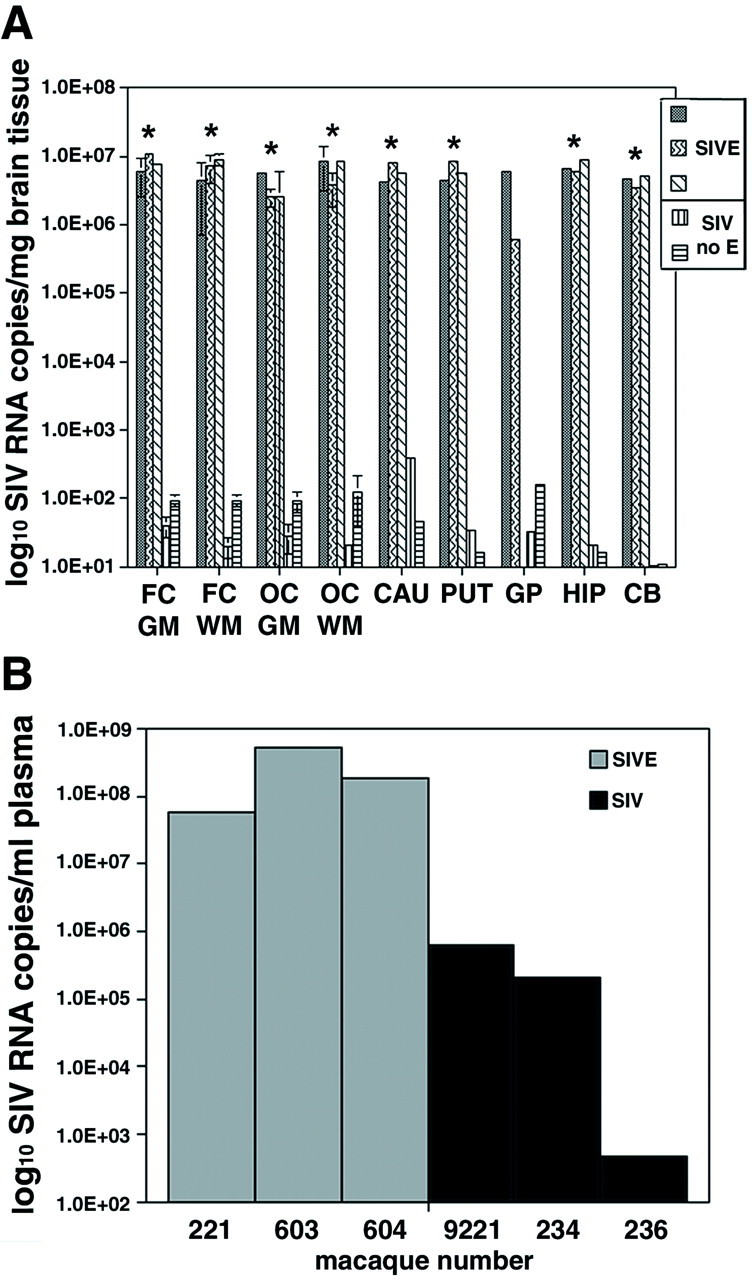
Macaques with histological evidence of SIVE had brain SIV RNA
concentrations 5 orders of magnitude greater than macaques without
SIVE. A: The number of SIV RNA copies/mg tissue extracted
from different brain regions is shown for three macaques with SIVE
(▒,  , ▧) and two SIV-infected macaques without encephalitis
(▥, ▤).
Tissue from the globus pallidus for macaque 604 was not available.
Quantitation of SIV RNA copies was determined by RT-PCR as described in
the Materials and Methods. SIV-infected macaques without encephalitis
contained <200 SIV RNA copies/mg tissue in each brain region
(average of 67 and median of 35 SIV RNA
copies/mg tissue for all regions analyzed).
Error bars for FC GM, FC WM, OC GM, and OC WM indicate the SD of the
average of two separate brain areas for each region.
Asterisks indicate statistically significant differences in
number of SIV RNA copies/mg brain tissue between SIVE macaques with and
without encephalitis. *, P < 0.05. B:
Peripheral SIV load in the plasma at time of death. The number of SIV
RNA copies/ml plasma for each macaque was determined by RT-PCR. The
gray bars represent animals with SIVE, whereas the
black bars correspond to SIV-infected macaques without
encephalitis. On average, macaques with encephalitis had 3 orders of
magnitude greater concentrations of plasma SIV RNA than SIV-infected
macaques without encephalitis. (The individual
macaque number is shown on the x
axis.) Abbreviations: SIVE, simian
immunodeficiency virus encephalitis; MGN, microglial nodule; MGNC,
multinucleated giant cell; FC GM, frontal neocortical gray matter; FC
WM, frontal neocortical white matter; OC, occipital cortex; CAU,
caudate; PUT, putamen; GP, globus pallidus; HIP, hippocampus; CB,
cerebellum.
, ▧) and two SIV-infected macaques without encephalitis
(▥, ▤).
Tissue from the globus pallidus for macaque 604 was not available.
Quantitation of SIV RNA copies was determined by RT-PCR as described in
the Materials and Methods. SIV-infected macaques without encephalitis
contained <200 SIV RNA copies/mg tissue in each brain region
(average of 67 and median of 35 SIV RNA
copies/mg tissue for all regions analyzed).
Error bars for FC GM, FC WM, OC GM, and OC WM indicate the SD of the
average of two separate brain areas for each region.
Asterisks indicate statistically significant differences in
number of SIV RNA copies/mg brain tissue between SIVE macaques with and
without encephalitis. *, P < 0.05. B:
Peripheral SIV load in the plasma at time of death. The number of SIV
RNA copies/ml plasma for each macaque was determined by RT-PCR. The
gray bars represent animals with SIVE, whereas the
black bars correspond to SIV-infected macaques without
encephalitis. On average, macaques with encephalitis had 3 orders of
magnitude greater concentrations of plasma SIV RNA than SIV-infected
macaques without encephalitis. (The individual
macaque number is shown on the x
axis.) Abbreviations: SIVE, simian
immunodeficiency virus encephalitis; MGN, microglial nodule; MGNC,
multinucleated giant cell; FC GM, frontal neocortical gray matter; FC
WM, frontal neocortical white matter; OC, occipital cortex; CAU,
caudate; PUT, putamen; GP, globus pallidus; HIP, hippocampus; CB,
cerebellum.
SIV-Infected Macaques with Encephalitis Had Concentrations of SIV RNA in Multiple Brain Regions that Were Five Orders of Magnitude Greater than Macaques without Encephalitis
Most brain regions analyzed in macaques with SIVE contained 106 to 107 copies of SIV RNA/mg brain tissue (Figure 1A)▶ . Nonencephalitic SIV-infected macaques with mild perivascular chronic inflammation contained <4 × 10² SIV RNA copies/mg brain tissue (Figure 1A)▶ . Most brain regions from these macaques had significantly less SIV RNA concentrations (101 to 102 SIV RNA copies/mg brain tissue) (P < 0.03) (Figure 1A)▶ than macaques with SIVE.
High Concentrations of SIV RNA in Brains of Macaques with SIVE Correlated with Profuse Microglial Nodules and Multinucleated Giant Cells
H&E staining and immunohistochemical staining for SIV envelope protein gp110 (SIVgp110) and macrophage/microglia-related molecule CD68 were performed on paraffin sections to determine the histological presence of encephalitis. Noninfected macaques showed no histopathological changes or cells stained positively for SIV proteins. Macaques with high CNS tissue concentrations of SIV RNA had profuse microglial nodules, severe perivascular chronic inflammation, and multiple multinucleated giant cells (Figure 2▶ ; A, B, and C). SIV-infected macrophages were observed in both parenchymal and perivascular locations.
Figure 2.
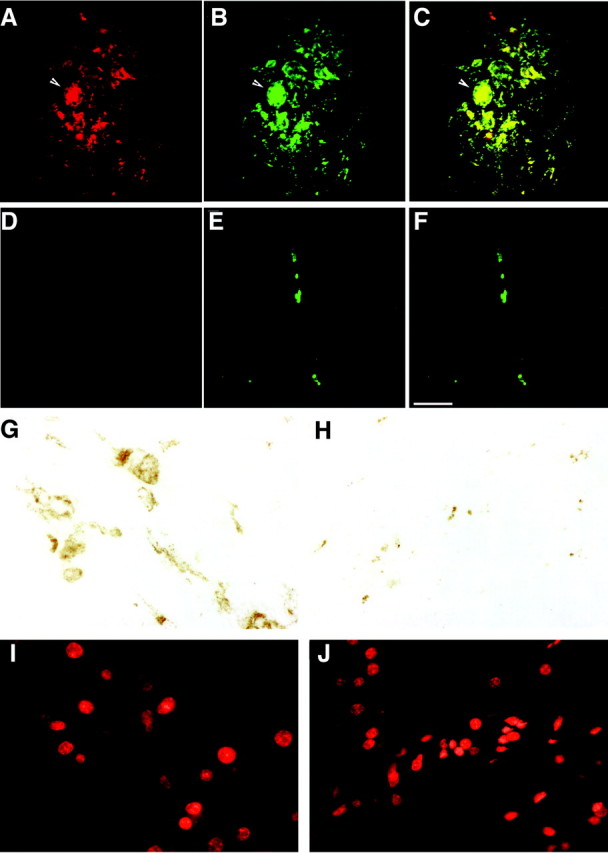
Immunofluorescent staining for macrophages and SIV envelope protein showed extensive co-localization in SIVE. A, B, and C: Histological sections from the white matter of a macaque with SIVE (macaque 221). D, E, and F: Histological sections from the white matter of a SIV-infected macaque without encephalitis (macaque 236). A and D illustrate immunofluorescent staining for the SIV envelope protein gp110 (red, Cy3), and B and E show immunofluorescent staining for the macrophage-related protein CD68 (green, FITC) visualized by double-label immunofluorescent confocal microscopy. C and F show merged images with yellow indicating co-localization of SIV-gp110 and CD68. A, B, and C from a macaque with SIVE demonstrate a microglial nodule containing a multinucleated giant cell (arrow). A rare field in a macaque without SIVE (D, E, and F) shows a perivascular macrophage. Scale bar, 50 μm. G–J: To confirm the immunofluorescent quantification, a peroxidase-based technique was used to quantitate the percent surface area CD68+ macrophages cover in macaques with and without encephalitis. G and I show a histological section from the caudate of a macaque with SIVE (macaque 221). H and J show a histological section from the caudate of a SIV-infected macaque without encephalitis (macaque 236). G and H show peroxidase staining for the macrophage-related protein CD68 (reddish-brown, 3,3′-diaminobenzidine), and I and J show the nuclear counter stain of G and H (red, propidium iodide) visualized by fluorescence microscopy.
Although neuropathology was widespread in macaques with high CNS tissue concentrations of SIV RNA, the histopathological changes were most abundant in midfrontal neocortical white and gray matter and caudate regions. Substantial SIV RNA concentrations in the cerebellum were associated with abundant white matter macrophages that stained for SIV and relative sparing of cerebellar cortical foci. Rare SIV-infected perivascular macrophages were seen in macaques with brain SIV RNA concentrations lower than 4 × 10² SIV RNA. In SIV-infected macaques without encephalitis, we observed rare or no monocytic infiltrates.
CD68 Staining Was Most Abundant in the Putamen, Caudate, Hippocampus, and Frontal Cortex of Macaques with SIVE
All brain regions of macaques with SIVE showed increased CD68 staining. Quantitation of pixels corresponding to CD68 immunostaining showed the greatest fold increase in the caudate and midfrontal neocortical gray matter (16- and 25-fold increase, respectively) (Figure 3C)▶ . SIV-infected macaques without encephalitis showed more pixels corresponding to CD68 than the noninfected control macaques, but this increase was not statistically significant (Figure 3C)▶ . Using an enzymatic colorimetric method to quantitate CD68 staining in the same brain regions of the same macaques, we observed that ∼1% of the surface area in each brain region was stained for CD68 in macaques with SIVE. The putamen showed the largest percentage of surface area stained for CD68 (1.4%). In SIV-infected macaques without encephalitis, <0.4% of surface area was stained for CD68 in all brain regions (Figure 3A)▶ . Compared to SIV-infected macaques without SIVE, all brain regions analyzed in macaques with SIVE showed a 3- to 11-fold increase in the percentage of surface area stained for CD68 (Figure 3, A and B)▶ .
Figure 3.

Quantitation of immunohistochemical staining for macrophages (CD68) and SIV envelope protein shows a 4- to 25-fold increase in brain regions with encephalitis versus those without encephalitis. A: CD68 staining covers ∼1% of the surface area in most brain regions with encephalitis. The average percentage of surface area stained with CD68 was determined for each brain region of the SIVE and SIV without encephalitis groups. B: The neocortical white and gray matter exhibit the greatest difference in the percentage of surface area stained for CD68. Histogram plots show the fold increase of surface area stained for CD68 in macaques with or without SIVE compared to SIV-infected macaques without encephalitis. C: Quantitation of fluorescent pixels corresponding to CD68 is significantly increased in all brain regions of macaques with SIVE. Pixels were quantified in indicated brain regions using immunofluorescent laser confocal microscopy as described in the Materials and Methods. Average pixels staining for CD68 in each animal group were compared to SIV-infected macaques without encephalitis and reported as fold difference in pixel counts. D: The number of pixels corresponding to SIV-gp110 envelope protein is significantly higher in the caudate, hippocampus, and white matter. Average immunofluorescent pixels for SIV-gp110 in each animal group were compared to SIV-infected macaques without encephalitis and reported as fold difference in pixel counts. Gray bars, SIVE; white bars, SIV without encephalitis; black bars, controls. Fold pixels listed on y-axes represent fold difference in pixel counts. *, P < 0.05.
Macaques with SIVE Had Increased Staining for SIV Envelope Protein in the Caudate, Hippocampus, and Frontal Cortex
Figure 2▶ shows representative fields used to quantify CD68 and SIVgp110 in five brain regions of SIV-infected macaques with and without encephalitis. Quantitation of pixels corresponding to SIVgp110 staining was 2- to 13-fold higher in the caudate, hippocampus, and white matter of macaques with SIVE compared to nonencephalitic macaques (P < 0.005) (Figure 3D)▶ . The midfrontal neocortical gray matter exhibited a 25-fold increase in SIVgp110 staining in macaques with SIVE, however, because of large variations in SIVgp110 staining the difference in this region was not statistically significant (P < 0.05).
SIVE Is a Multifocal Disease with Tight Correlation between the Presence of Macrophages and SIV Antigen
Wide variation within all brain regions analyzed demonstrated the multifocal nature of SIVE. As an example, the mean ± SD of the fold increase in SIVgp110 and CD68 staining within the midfrontal neocortical gray matter was 25 ± 86 and 25 ± 60, respectively. In macaques with SIVE, the majority of cells that were immunostained for CD68 also stained for SIVgp110 (Figure 2C)▶ . Pixel quantification of CD68 and SIVgp110 staining showed a correlation coefficient of 0.91 in the putamen, 0.99 in the midfrontal neocortical gray matter, and 0.97 in the hippocampus.
Macaques with SIVE Showed Less Abundant Postsynaptic Protein MAP-2 Staining in the Caudate, Hippocampus, and Frontal Cortical Gray Matter than Macaques without Encephalitis
To determine the relationship between postsynaptic damage and SIVE, quantification of postsynaptic protein MAP-2 staining was performed in gray matter regions from all macaque groups. A representative histological section from the caudate of a macaque with SIVE showed decreased MAP-2 staining (Figure 4A)▶ compared to equivalent sections from SIV-infected macaques without encephalitis (Figure 4E)▶ . MAP-2 staining in the caudate, hippocampus, and midfrontal neocortical gray matter was 66 to 70% lower in macaques with SIVE than in both SIV-infected and noninfected macaques without encephalitis (Figure 5A)▶ . MAP-2 staining was also 37% lower in the putamen of macaques with SIVE, but this decrease did not achieve statistical significance. SIV-infected macaques without encephalitis exhibited significantly lower staining for MAP-2 in the midfrontal cortical gray matter than noninfected macaques (50% lower), however, the decrease was not as great as that observed in macaques with SIVE (Figure 5A)▶ .
Figure 4.
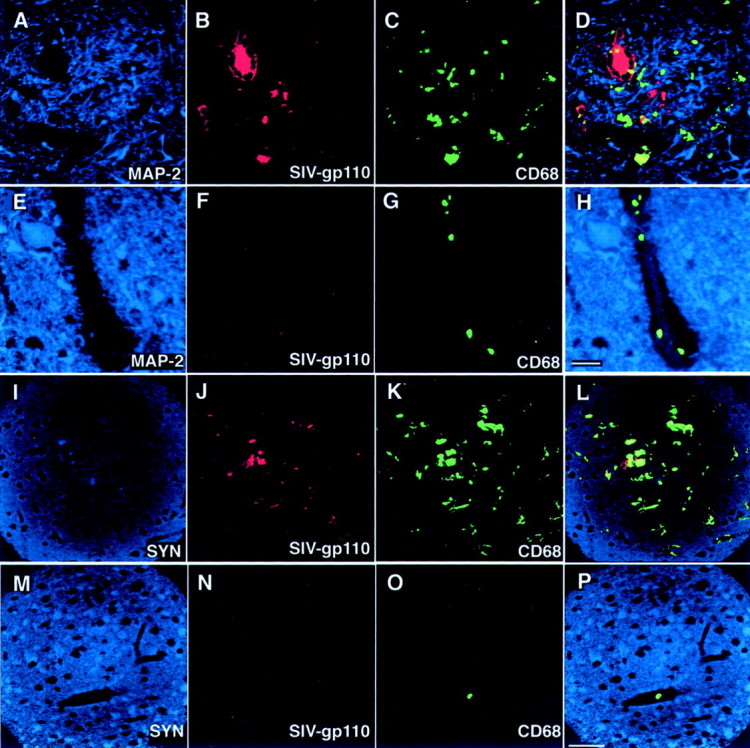
Macaques with SIVE show decreased staining for MAP-2 and synaptophysin. A–H: The relationship between MAP-2 staining and the presence of macrophages and SIV can be qualitatively appreciated in this triple label image. Images such as this were quantitated and plotted in Figures 5▶ . A to D show histological sections from the caudate of a macaque with SIVE (macaque 603) immunostained for MAP-2 (A; blue, Cy5), SIV-gp110 (B; red, Cy3), and CD68 (C; green, FITC) visualized by triple-label immunofluorescent laser confocal microscopy. E to H show histological sections from the caudate of a SIV-infected macaque without SIVE (macaque 236) immunostained for MAP-2 (E; blue, Cy5), SIV-gp110 (F; red, Cy3), and CD68 (G; green, FITC). An overlay of the three preceding images is shown in D and H. Yellow shows co-localization. Scale bar, 20 μm. I–L: The relationship between synaptophysin staining and the presence of macrophages and SIV can be qualitatively appreciated in this triple label image. Images such as this were quantitated and plotted in Figures 5▶ . I to L show histological sections from the hippocampus of a macaque with SIVE (macaque 604) immunostained for synaptophysin (SYN) (I; blue, Cy5), SIV-gp110 (J; red, Cy3), and CD68 (K; green, FITC) visualized by triple-label immunofluorescent laser confocal microscopy. M to P show histological sections from the hippocampus of a normal uninfected macaque (macaque 421) immunostained for SYN (M; blue, Cy5), SIV-gp110 (N; red, Cy3), and CD68 (O; green, FITC). An overlay of the three preceding images is shown in L and P. Yellow shows co-localization. Scale bar, 50 μm.
Figure 5.
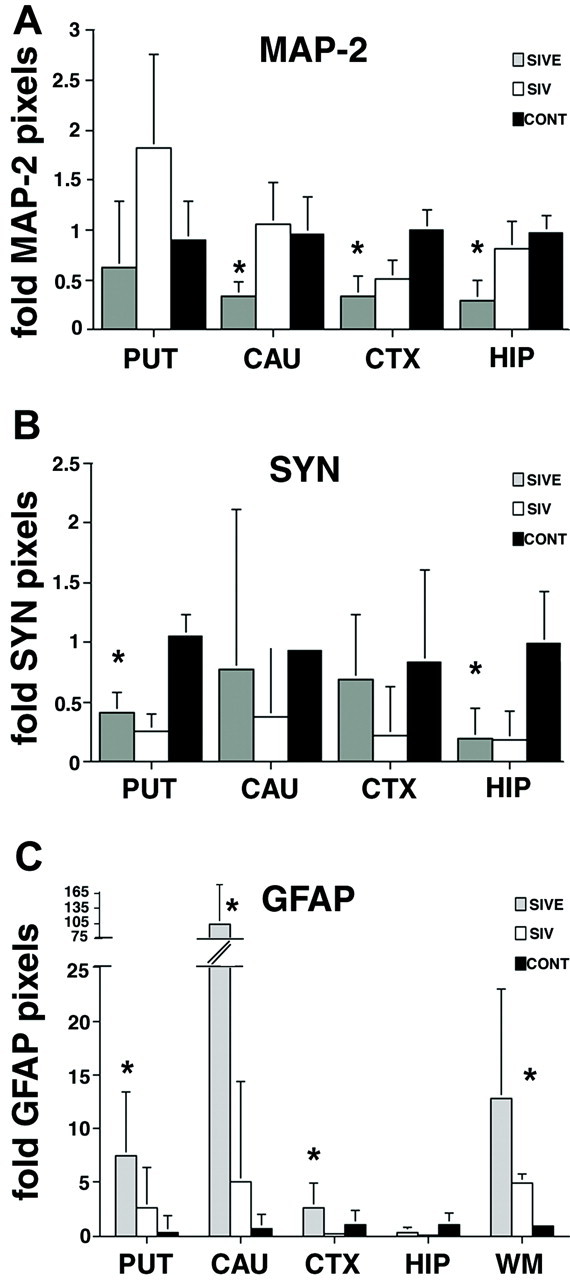
MAP-2 staining is decreased in the brains of macaques with SIVE, whereas synaptophysin staining is decreased in the brains of SIV-infected macaques with and without encephalitis. A: The number of pixels corresponding to MAP-2 is significantly decreased in the caudate, neocortical gray matter, and hippocampus of macaques with SIVE compared to nonencephalitic and noninfected controls. Each indicated brain region was immunostained for MAP-2 and visualized by immunofluorescent confocal microscopy. Ten areas in each brain region were quantified for each animal and marker. To obtain the fold difference in pixel counts for MAP-2, the median pixel count for each animal, brain region, and marker was divided by the average pixel count for the corresponding brain region and marker of the control animals. B: The number of pixels representing synaptophysin is significantly decreased in the putamen and hippocampus of SIV-infected macaques with and without encephalitis. Each indicated brain region was immunostained for SYN and visualized by immunofluorescent confocal microscopy. Ten areas in each brain region were quantified for each animal and marker. To obtain the fold difference in pixel counts for SYN, the median pixel count for each animal, brain region, and marker was divided by the average pixel count for the corresponding brain region and marker of the control animals. C: GFAP staining is increased in the brains of macaques with SIVE. Each indicated brain region was immunostained for GFAP and visualized by immunofluorescent confocal microscopy. Ten areas in each brain region were quantified for each animal and marker. To obtain the fold difference in pixel counts for GFAP, the median pixel count for each animal, brain region, and marker was divided by the average pixel count for the corresponding brain region and marker of the control animals. The number of pixels corresponding to GFAP is significantly increased in the putamen, caudate, and neocortical gray and white matter of macaques with SIVE compared to nonencephalitic and noninfected controls. Error bars reflect positive error. Fold pixels listed on y-axes represent fold difference in pixel counts. Abbreviations are listed in Figure 1▶ . CTX, neocortical frontal gray matter. *, P < 0.01.
Immunostaining for the Presynaptic Protein Synaptophysin Was Decreased in SIV-Infected Macaques with and without Encephalitis
To determine the relationship between presynaptic damage and SIVE, quantification of presynaptic protein synaptophysin staining was performed in gray matter regions from all macaque groups. A representative histological section from the hippocampus of a macaque with SIVE showed decreased synaptophysin staining (Figure 4I)▶ compared to a noninfected macaque without encephalitis (Figure 4M)▶ . In contrast to MAP-2 staining, the number of pixels corresponding to synaptophysin was decreased in both SIV-infected macaques with and without encephalitis compared to noninfected macaques (Figure 5B)▶ . The putamen and hippocampus of SIV-infected macaques with and without encephalitis showed 60 to 80% lower synaptophysin staining than noninfected macaques without encephalitis (Figure 5B)▶ . Macaques with SIVE exhibited similar fold staining for synaptophysin in the caudate and frontal neocortical gray matter as noninfected controls, whereas SIV-infected macaques without encephalitis showed a significant decrease in synaptophysin staining in the frontal neocortical gray matter compared to noninfected controls (Figure 5B)▶ .
Quantitative Immunostaining for GFAP Showed Prominent Gliosis in the Putamen, Caudate, and Frontal Cortex of Macaques with SIVE
To determine the relationship between nonspecific CNS damage and SIVE, quantification of GFAP staining was performed in gray and white matter regions from all macaque groups. SIV-infected and noninfected macaques without encephalitis showed 2- to 100-fold lower GFAP staining than macaques with SIVE (Figure 5C)▶ . The greatest fold increase in GFAP staining in macaques with SIVE compared to SIV-infected macaques without encephalitis was present in caudate and white matter (100-fold and 8-fold, respectively) (Figure 5C)▶ . Surprisingly, the hippocampus showed similar GFAP staining in all macaques. SIV-infected macaques without encephalitis showed up to fivefold higher GFAP staining in putamen, caudate, and white matter than noninfected macaques.
Discussion
In lentiviral-associated dementia there has been considerable controversy regarding the relationship between neurological damage and the abundance of virus in the CNS.12,15,17,24,28,32,62,65-70 Because some investigators have found little HIV antigen in the brains of individuals with HIV-associated dementia, it has been suggested that the presence of activated macrophages/microglia in the CNS is a better correlate of dementia than the presence of HIV-infected macrophages.28 Similar observations have been reported in the SIV model in which no clear relationship was discerned between neuropathology and the number of SIV-infected cells.69 However, these reports used nonquantitative methodology, relying on nonquantitative scoring of immunohistochemistry and in situ hybridization in selected brain regions. Preservation and accessibility of viral proteins and nucleic acids using these techniques is technique-dependent. Several other studies have shown that the severity of HIV and SIV encephalitis correlates with higher viral RNA concentrations in several brain regions using sensitive, quantitative RNA assays.17,32,62,70
We have confirmed that the histological presence of encephalitis is associated with high concentrations of SIV RNA in most brain regions. Brains of SIV-infected macaques with histological findings of SIVE contained 5 orders of magnitude greater concentrations of SIV RNA than SIV-infected macaques without encephalitis. Because the macaque brains used in this study were not perfused with buffer after sacrifice, brain tissue extracts were necessarily contaminated with blood. Whether blood contamination contributed to the amount of SIV RNA quantified in brain tissue extracts depends on two factors: the level of virus in blood and the amount of blood in the tissue. Blood-borne SIV could be cell-associated or within the plasma. Because CD4 counts in these SIV-infected macaques were low, the amount of viral RNA derived from infected CD4+ T cells would not be expected to significantly contribute to the levels of SIV RNA measured in the brain. The SIV RNA load in plasma of macaques with SIVE was 5.3 × 10⁸ SIV RNA copies/ml plasma or less. If we assume the blood contaminating brain tissue extracts contained an upper limit of 1 × 10⁶ SIV RNA copies/ml plasma, we would estimate that blood contamination of brain extracts would account for less than 1 × 10⁴ copies/mg. Thus, the high RNA concentrations observed in most brain regions must be attributed to virus in brain tissue rather than blood contamination. Lastly, we are assured blood contamination was not a factor in quantification of viral RNA in brain tissue extracts because the SIV-infected macaques without encephalitis had greater than 105 SIV RNA copies/ml plasma but less than 102 SIV RNA copies/mg brain tissue.
It is interesting that regions such as the cerebellum that traditionally have been reported to lack overt histopathology have similar concentrations of SIV RNA as regions with more abundant pathology. It has been reported that cerebellar cortex is not as affected histopathologically as the basal ganglia structures during lentiviral encephalitis.62 We have observed such a pattern in patients with HIV encephalitis.32 It has been reported that the deep cerebellar gray nuclei have abundant macrophages that stained for HIVgp41 (transmembrane protein), whereas infected cells are rare in the cerebellar cortex.71 In the animals used in this study, cerebellar white matter was also heavily infiltrated with SIV-infected macrophages (data not shown). Seemingly conflicting observations in cerebellar viral RNA concentrations might result from sampling different portions of the cerebellum.
Vast differences in viral RNA concentrations between SIV-infected macaques with and without encephalitis makes the readily quantifiable RNA assay an unbiased tool for diagnosing lentiviral encephalitis. However, this approach quantifies the average amount of RNA within 100 mg of brain tissue that contains ∼500 million cells with abundant microenvironments potentially disparate in lentiviral presence. Defining proximal relationships between macrophage and viral factors requires more selective analysis than averages derived from measurements of 500 million cells. Using confocal microscopy, we quantified markers of virus and macrophages within discrete microenvironments and assessed the relationship of these markers to neuronal damage.
There are three potential drawbacks to microscopy-based quantification of viral and host cell markers: necessity of using fixed tissue, observer bias in selecting regions for quantitation, and variability within individual microscopic fields. All of the macaque CNS tissues were fixed by immersion in 10% formalin. To control for any potential differences in antigen preservation during immersion fixation, we compared MAP-2 fluorescent staining in cerebellar cortical gray matter (data not shown). No significant interspecimen variation was observed for this control antigen. To prevent observer bias, brain regions were defined by gross inspection of the slide and then circled. Random selection of microscopic regions within the encircled areas was performed by an observer blinded to animal disease status. Finally, to accommodate variability encountered within individual microenvironments (eg, presence of vessels of various calibers, presence of white matter tracts within basal ganglia structures, intranuclear histological variability), we acquired optical images within 10 fields for each brain region. Individual microenvironments showed the expected variability, however, comparison of the fluorescent-labeling averages between macaques with and without encephalitis showed significant differences.
We compared our technique of quantifying fluorescent markers in microscopic fields to an enzymatic colorimetric quantification method. Using the colorimetric method, white matter of macaques with SIVE had the greatest fold increase in surface area stained for CD68, whereas with the confocal method frontal neocortical gray matter showed the greatest fold increase in fluorescent pixels stained for CD68. However, overall the two methods showed parallel trends in quantifying macrophages.
Both CD68 and SIVgp110 staining were elevated in all brain regions of macaques with SIVE compared to SIV-infected macaques without SIVE. The greatest increases were seen in the midfrontal cortical gray matter and caudate suggesting that neurons in these regions are at greater risk of damage from soluble products secreted by activated and infected macrophages. Regions receiving projections from the caudate and midfrontal cortical gray matter would be at risk of secondary damage because of downstream events initiated at the soma of these neurons.
The majority of activated macrophages in the brains of macaques with SIVE were infected with SIV. Examining individual microscopic fields, we estimated ∼70 to 80% of macrophages stain for SIVgp110. This observation is different from some previous reports. For instance, it has been reported that 16 to 25% of brain macrophages stained for HIV antigen.72 However, this study analyzed a wide variety of neuropathological conditions (eg, opportunistic cytomegalovirus, Toxoplasma, cryptococcus) and was not restricted to assessment of lentiviral encephalitis. Other studies have also suggested that the majority of CD68-positive macrophages did not stain for SIV gp41.62 Some of the discrepancy between previous studies and ours might be attributed to differing sensitivities of antibodies for transmembrane (gp41) and surface unit glycoprotein (gp110). Additionally, in our studies raw pixel counts indicate that CD68 staining corresponded to more pixels than SIV staining in most microscopic foci. Because CD68 is a marker of lysosomes and the antibody we used to stain SIV-infected cells is specific for viral envelope protein, it may not be appropriate to directly compare absolute CD68 and SIVgp110 pixel counts. Perhaps more meaningful is to compare fold changes in CD68 and SIV immunostaining between encephalitic and nonencephalitic brains.
Lentiviral encephalitis is a multifocal process with significant variation between microscopic regions. This is best shown by the large standard deviations in CD68 and SIVgp110 quantification seen within all brain regions. To assess an individual brain nucleus, an average of numerous fields is required to compensate for microscopic variation. Microscopic foci within brain regions of macaques with abundant macrophage infiltration and viral infection show loss of synaptic proteins. Compared to macaques without encephalitis, macaques with SIVE had significant decreases in MAP-2 staining in the caudate, midfrontal cortical gray matter, and hippocampus suggesting primary postsynaptic damage. Others have also reported decreases in dendritic proteins in SIV-infected cynomologus macaques soon after infection, but these decreases were independent of concentrations of SIV DNA in the brain.26 It is surprising that staining for MAP-2 was increased in the putamen of SIV-infected macaques without encephalitis compared to both encephalitic and noninfected controls. It is possible to hypothesize that neurons that have postsynaptic processes in the putamen generate a temporary response to acute damage by dilating postsynaptic processes, but ultimately undergo atrophy because of the chronic insult of encephalitis.
Staining for the presynaptic protein, synaptophysin, was also decreased in the putamen and hippocampus of macaques with SIVE and the putamen, caudate, midfrontal cortical gray matter, and hippocampus of SIV-infected macaques without encephalitis. This finding is consistent with a recent report showing decreased synaptophysin immunoreactivity in macaque brains soon after infection with SIV.45 However, it is puzzling that greater decreases in synaptophysin staining were not observed in the encephalitic macaques in this study. The vast interconnectivity of the brain complicates this analysis by requiring some means of dissecting out synaptic damage distal to affected neuronal soma. In support of indirect mechanisms leading to decreases in synaptic proteins, we have shown that GFAP staining is increased in most brain regions in macaques with SIVE. As we and others have observed, SIV-infected macaques without encephalitis also showed increases in GFAP staining compared to noninfected controls although far less than that observed with encephalitis.45 As the hippocampus is particularly sensitive to hypoxia/ischemia, the absence of increased gliosis in the region suggests that the neuropathological damage observed in SIVE is not related to diffuse ischemic injury, but more specifically related to the encephalitis itself.
Finding presynaptic damage in SIV-infected macaques independent of encephalitis and postsynaptic damage dependent on local presence of encephalitis suggests the following hypothesis: presynaptic components are susceptible to systemic toxins generated as a result of lentiviral infection, whereas postsynaptic elements are susceptible to degradation by products of locally activated and infected macrophages within the CNS. In support of this hypothesis, we observed less synaptophysin staining in neocortical gray matter, caudate, and putamen of SIV-infected macaques without encephalitis than in SIV-infected macaques with encephalitis. The SIV-infected macaques had longer periods of infection, raising the possibility that presynaptic damage is a consequence of longer peripheral infection. Because synaptophysin is a functional protein and MAP-2 is a structural protein, this hypothesis may extend to functional proteins being susceptible to systemic toxins produced during lentiviral infection, whereas structural proteins are damaged by CNS lentiviral infection. Presynaptic and postsynaptic damage may progress to neuronal loss in the brains of lentiviral encephalitic macaques. MAP-2 functions are modulated by phosphorylation through NMDA receptor-associated signal transduction pathways and subsequent activation of nitric oxide synthase and MAP kinase.73 Secretion of NMDA receptor agonists such as quinolinic acid by activated macrophages might result in hyperphosphorylation of MAP-2 and subsequent destabilization of microtubules leading to neuronal degeneration.74
In the current study we have attempted to examine the hypothesis that loss of synaptic proteins may spatially correlate with the presence of pathology in macaques with SIVE. We quantified increases in CD68, SIV envelope protein gp110, and GFAP in encephalitic macaques. Presynaptic proteins were decreased in SIV-infected macaques independent of encephalitis, whereas loss of postsynaptic proteins was linked to encephalitis. Quantitation of synaptic proteins in brain regions with abundant SIV-infected and -activated macrophages points to indirect mechanisms of neuronal damage. Future studies to elucidate mechanisms of neural damage will require compensating for the high degree of microregional variability in neuropathology of lentiviral encephalitis.
Acknowledgments
We thank Jonette Werley for valuable technical assistance; Christopher A. Pittman and Ronald Hamilton for assistance in dissection and banking of the monkey brains; and Premeela Rajakuman, Dawn L. McClemens-McBride, Katy Board, and Karen Norris for assistance in obtaining clinical information for the macaques.
Footnotes
Address reprint requests to Clayton A. Wiley, A-515 UPMC Presbyterian, 200 Lothrop St., Pittsburgh, PA 15213. E-mail: wiley@np.awing.upmc.edu.
Supported in part by the National Cancer Institute (contract no. NO1-CO-56000) and by the National Institutes of Health (grants MH61205, NS35731, MH46790, and MH01717).
References
- 1.Davies J, Everall IP, Weich S, McLaughlin J, Scaravilli F, Lantos PL: HIV-associated brain pathology in the United Kingdom: an epidemiological study. AIDS 1997, 11:1145-1150 [DOI] [PubMed] [Google Scholar]
- 2.Masliah E, DeTeresa RM, Mallory ME, Hansen LA: Changes in pathological findings at autopsy in AIDS cases for the last 15 years. AIDS 2000, 14:69-74 [DOI] [PubMed] [Google Scholar]
- 3.Maehlen J, Dunlop O, Liestol K, Dobloug JH, Goplen AK, Torvik A: Changing incidence of HIV-induced brain lesions in Oslo, 1983–1994, effects of zidovudine treatment. AIDS 1995, 9:1165-1169 [PubMed] [Google Scholar]
- 4.Bacellar H, Munoz A, Miller EN, Cohen BA, Besley D, Selnes OA, Becker JT, McArthur JC: Temporal trends in the incidence of HIV-1-related neurologic diseases: multicenter AIDS Cohort Study, 1985–1992. Neurology 1994, 44:1892-1900 [DOI] [PubMed] [Google Scholar]
- 5.Baskin GB, Murphey-Corb M, Roberts ED, Didier PJ, Martin LN: Correlates of SIV encephalitis in rhesus monkeys. J Med Primatol 1992, 21:59-63 [PubMed] [Google Scholar]
- 6.Czub S, Muller JG, Czub M, Muller-Hermelink HK: Impact of various simian immunodeficiency virus variants on induction and nature of neuropathology in macaques. Res Virol 1996, 147:165-170 [DOI] [PubMed] [Google Scholar]
- 7.Joag SV, Stephens EB, Galbreath D, Zhu GW, Li Z, Foresman L, Zhao LJ, Pinson DM, Narayan O: Simian immunodeficiency virus SIVmac chimeric virus whose env gene was derived from SIV-encephalitic brain is macrophage-tropic but not neurovirulent. J Virol 1995, 69:1367-1369 [DOI] [PMC free article] [PubMed] [Google Scholar]
- 8.Mankowski JL, Flaherty MT, Spelman JP, Hauer DA, Didier PJ, Amedee AM, Murphey-Corb M, Kirstein LM, Munoz A, Clements JE, Zink MC: Pathogenesis of simian immunodeficiency virus encephalitis: viral determinants of neurovirulence. J Virol 1997, 71:6055-6060 [DOI] [PMC free article] [PubMed] [Google Scholar]
- 9.Sharer LR, Michaels J, Murphey-Corb M, Hu FS, Kuebler DJ, Martin LN, Baskin GB: Serial pathogenesis study of SIV brain infection. J Med Primatol 1991, 20:211-217 [PubMed] [Google Scholar]
- 10.Strelow LI, Watry DD, Fox HS, Nelson JA: Efficient infection of brain microvascular endothelial cells by an in vivo-selected neuroinvasive SIVmac variant. J Neurovirol 1998, 4:269-280 [DOI] [PubMed] [Google Scholar]
- 11.Westmoreland SV, Halpern E, Lackner AA: Simian immunodeficiency virus encephalitis in rhesus macaques is associated with rapid disease progression. J Neurovirol 1998, 4:260-268 [DOI] [PubMed] [Google Scholar]
- 12.Zink MC, Amedee AM, Mankowski JL, Craig L, Didier P, Carter DL, Munoz A, Murphey-Corb M, Clements JE: Pathogenesis of SIV encephalitis. Selection and replication of neurovirulent SIV. Am J Pathol 1997, 151:793-803 [PMC free article] [PubMed] [Google Scholar]
- 13.Navia BA, Cho ES, Petito CK, Price RW: The AIDS dementia complex: II. Neuropathology. Ann Neurol 1986, 19:525-535 [DOI] [PubMed] [Google Scholar]
- 14.Price RW: Understanding the AIDS dementia complex (ADC). The challenge of HIV and its effects on the central nervous system. Res Publ Assoc Res Nerv Ment Dis 1994, 72:1-45 [PubMed] [Google Scholar]
- 15.Wiley CA, Achim C: Human immunodeficiency virus encephalitis is the pathological correlate of dementia in acquired immunodeficiency syndrome. Ann Neurol 1994, 36:673-676 [DOI] [PubMed] [Google Scholar]
- 16.Budka H: Neuropathology of human immunodeficiency virus infection. Brain Pathol 1991, 1:163-175 [DOI] [PubMed] [Google Scholar]
- 17.Wiley CA, Achim CL, Christopherson C, Kidane Y, Kwok S, Masliah E, Mellors J, Radhakrishnan L, Wang G, Soontornniyomkij V: HIV mediates a productive infection of the brain. AIDS 1999, 13:2055-2059 [DOI] [PubMed] [Google Scholar]
- 18.Spencer DC, Price RW: Human immunodeficiency virus and the central nervous system. Annu Rev Microbiol 1992, 46:655-693 [DOI] [PubMed] [Google Scholar]
- 19.Everall I, Luthert P, Lantos P: A review of neuronal damage in human immunodeficiency virus infection: its assessment, possible mechanism and relationship to dementia. J Neuropathol Exp Neurol 1993, 52:561-566 [DOI] [PubMed] [Google Scholar]
- 20.Ketzler S, Weis S, Haug H, Budka H: Loss of neurons in the frontal cortex in AIDS brains. Acta Neuropathol (Berl) 1990, 80:92–94 [DOI] [PubMed]
- 21.Masliah E, Achim CL, Ge N, DeTeresa R, Terry RD, Wiley CA: Spectrum of human immunodeficiency virus-associated neocortical damage. Ann Neurol 1992, 32:321-329 [DOI] [PubMed] [Google Scholar]
- 22.Wiley CA, Masliah E, Morey M, Lemere C, DeTeresa R, Grafe M, Hansen L, Terry R: Neocortical damage during HIV infection. Ann Neurol 1991, 29:651-657 [DOI] [PubMed] [Google Scholar]
- 23.Everall IP, Luthert PJ, Lantos PL: Neuronal loss in the frontal cortex in HIV infection. Lancet 1991, 337:1119-1121 [DOI] [PubMed] [Google Scholar]
- 24.Achim CL, Wang R, Miners DK, Wiley CA: Brain viral burden in HIV infection. J Neuropathol Exp Neurol 1994, 53:284-294 [DOI] [PubMed] [Google Scholar]
- 25.Budka H, Wiley CA, Kleihues P, Artigas J, Asbury AK, Cho ES, Cornblath DR, Dal Canto MC, DeGirolami U, Dickson D, Epstein LG, Esiri MM, Giangaspero F, Gosztonyi G, Gray F, Griffin JW, Henin D, Iwasaki Y, Janssen RS, Johnson RT, Lantos PL, Lyman WD, McArthur JC, Nagashima K, Peres N, Petito CK, Price RW, Rhodes RH, Rosenblum M, Said G, Scaravilli F, Sharer LR, Vinters HV: HIV-associated disease of the nervous system: review of nomenclature and proposal for neuropathology-based terminology. Brain Pathol 1991, 1:143–152 [DOI] [PubMed]
- 26.Montgomery MM, Dean AF, Taffs F, Stott EJ, Lantos PL, Luthert PJ: Progressive dendritic pathology in cynomolgus macaques infected with simian immunodeficiency virus. Neuropathol Appl Neurobiol 1999, 25:11-19 [DOI] [PubMed] [Google Scholar]
- 27.Achim CL, Wiley CA: Inflammation in AIDS and the role of the macrophage in brain pathology. Curr Opin Neurol 1996, 9:221-225 [DOI] [PubMed] [Google Scholar]
- 28.Glass JD, Fedor H, Wesselingh SL, McArthur JC: Immunocytochemical quantitation of human immunodeficiency virus in the brain: correlations with dementia. Ann Neurol 1995, 38:755-762 [DOI] [PubMed] [Google Scholar]
- 29.Tyor WR, Glass JD, Baumrind N, McArthur JC, Griffin JW, Becker PS, Griffin DE: Cytokine expression of macrophages in HIV-1-associated vacuolar myelopathy. Neurology 1993, 43:1002-1009 [DOI] [PubMed] [Google Scholar]
- 30.Power C, Kong PA, Crawford TO, Wesselingh S, Glass JD, McArthur JC, Trapp BD: Cerebral white matter changes in acquired immunodeficiency syndrome dementia: alterations of the blood-brain barrier. Ann Neurol 1993, 34:339-350 [DOI] [PubMed] [Google Scholar]
- 31.Achim CL, Wiley CA: Expression of major histocompatibility complex antigens in the brains of patients with progressive multifocal leukoencephalopathy. J Neuropathol Exp Neurol 1992, 51:257-263 [DOI] [PubMed] [Google Scholar]
- 32.Wiley CA, Soontornniyomkij V, Radhakrishnan L, Masliah E, Mellors J, Hermann SA, Dailey P, Achim CL: Distribution of brain HIV load in AIDS. Brain Pathol 1998, 8:277-284 [DOI] [PMC free article] [PubMed] [Google Scholar]
- 33.Power C, McArthur JC, Nath A, Wehrly K, Mayne M, Nishio J, Langelier T, Johnson RT, Chesebro B: Neuronal death induced by brain-derived human immunodeficiency virus type 1 envelope genes differs between demented and nondemented AIDS patients. J Virol 1998, 72:9045-9053 [DOI] [PMC free article] [PubMed] [Google Scholar]
- 34.Pulliam L, Clarke JA, McGrath MS, Moore D, McGuire D: Monokine products as predictors of AIDS dementia. AIDS 1996, 10:1495-1500 [DOI] [PubMed] [Google Scholar]
- 35.Pulliam L, Clarke JA, McGuire D, McGrath MS: Investigation of HIV-infected macrophage neurotoxin production from patients with AIDS dementia. Adv Neuroimmunol 1994, 4:195-198 [DOI] [PubMed] [Google Scholar]
- 36.Crowe SM: Role of macrophages in the pathogenesis of human immunodeficiency virus (HIV) infection. Aust N Z J Med 1995, 25:777-783 [DOI] [PubMed] [Google Scholar]
- 37.Heyes MP, Saito K, Lackner A, Wiley CA, Achim CL, Markey SP: Sources of the neurotoxin quinolinic acid in the brain of HIV-1-infected patients and retrovirus-infected macaques. FASEB J 1998, 12:881-896 [DOI] [PubMed] [Google Scholar]
- 38.Giulian D, Yu J, Li X, Tom D, Li J, Wendt E, Lin SN, Schwarcz R, Noonan C: Study of receptor-mediated neurotoxins released by HIV-1-infected mononuclear phagocytes found in human brain. J Neurosci 1996, 16:3139-3153 [DOI] [PMC free article] [PubMed] [Google Scholar]
- 39.Gelbard HA, Nottet HSLM, Swindells S, Jett M, Dzenko KA, Genis P, White R, Wang L, Choi YB, Zhang D: Platelet-activating factor: a candidate human immunodeficiency virus type 1-induced neurotoxin. J Virol 1994, 68:4628-4635 [DOI] [PMC free article] [PubMed] [Google Scholar]
- 40.Brouwers P, Heyes MP, Moss HA, Wolters PL, Poplack DG, Markey SP, Pizzo PA: Quinolinic acid in the cerebrospinal fluid of children with symptomatic human immunodeficiency virus type 1 disease: relationships to clinical status and therapeutic response. J Infect Dis 1993, 168:1380-1386 [DOI] [PubMed] [Google Scholar]
- 41.Lo TM, Fallert CJ, Piser TM, Thayer SA: HIV-1 envelope protein evokes intracellular calcium oscillations in rat hippocampal neurons. Brain Res 1992, 594:189-196 [DOI] [PubMed] [Google Scholar]
- 42.Lipton SA, Sucher NJ, Kaiser PK, Dreyer EB: Synergistic effects of HIV coat protein and NMDA receptor-mediated neurotoxicity. Neuron 1991, 7:111-118 [DOI] [PubMed] [Google Scholar]
- 43.Price RW, Brew B, Sidtis J, Rosenblum M, Scheck AC, Cleary P: The brain in AIDS: central nervous system HIV-1 infection and AIDS dementia complex. Science 1988, 239:586-592 [DOI] [PubMed] [Google Scholar]
- 44.Jordan-Sciutto KL, Wang G, Murphy-Corb M, Wiley CA: Induction of cell-cycle regulators in simian immunodeficiency virus encephalitis. Am J Pathol 2000, 157:497-507 [DOI] [PMC free article] [PubMed] [Google Scholar]
- 45.Gonzalez RG, Cheng LL, Westmoreland SV, Sakaie KE, Becerra LR, Lee PL, Masliah E, Lackner AA: Early brain injury in the SIV-macaque model of AIDS. AIDS 2000, 14:2841-2849 [DOI] [PubMed] [Google Scholar]
- 46.Masliah E, Heaton RK, Marcotte TD, Ellis RJ, Wiley CA, Mallory M, Achim CL, McCutchan JA, Nelson JA, Atkinson JH, Grant I: Dendritic injury is a pathological substrate for human immunodeficiency virus-related cognitive disorders. HNRC Group. The HIV Neurobehavioral Research Center. Ann Neurol 1997, 42:963–972 [DOI] [PubMed]
- 47.Masliah E, Terry RD, Alford M, DeTeresa R: Quantitative immunohistochemistry of synaptophysin in human neocortex: an alternative method to estimate density of presynaptic terminals in paraffin sections. J Histochem Cytochem 1990, 38:837-844 [DOI] [PubMed] [Google Scholar]
- 48.Eastwood SL, Burnet PW, McDonald B, Clinton J, Harrison PJ: Synaptophysin gene expression in human brain: a quantitative in situ hybridization and immunocytochemical study. Neuroscience 1994, 59:881-892 [DOI] [PubMed] [Google Scholar]
- 49.Mook-Jung I, Hong HS, Boo JH, Lee KH, Yun SH, Cheong MY, Joo I, Huh K, Jung MW: Ginsenoside Rb1 and Rg1 improve spatial learning and increase hippocampal synaptophysin level in mice. J Neurosci Res 2001, 63:509-515 [DOI] [PubMed] [Google Scholar]
- 50.Saito S, Kobayashi S, Ohashi Y, Igarashi M, Komiya Y, Ando S: Decreased synaptic density in aged brains and its prevention by rearing under enriched environment as revealed by synaptophysin contents. J Neurosci Res 1994, 39:57-62 [DOI] [PubMed] [Google Scholar]
- 51.Mazer C, Muneyyirci J, Taheny K, Raio N, Borella A, Whitaker-Azmitia P: Serotonin depletion during synaptogenesis leads to decreased synaptic density and learning deficits in the adult rat: a possible model of neurodevelopmental disorders with cognitive deficits. Brain Res 1997, 760:68-73 [DOI] [PubMed] [Google Scholar]
- 52.Masliah E, Mallory M, Alford M, DeTeresa R, Hansen LA, McKeel Jr DW, Morris JC: Altered expression of synaptic proteins occurs early during progression of Alzheimer’s disease. Neurology 2001, 56:127–129 [DOI] [PubMed]
- 53.Masliah E, Mallory M, Hansen L, DeTeresa R, Alford M, Terry R: Synaptic and neuritic alterations during the progression of Alzheimer’s disease. Neurosci Lett 1994, 174:67-72 [DOI] [PubMed] [Google Scholar]
- 54.Tanaka S, Saito M, Morimatsu M, Ohama E: Immunohistochemical studies of the PrP(CJD) deposition in Creutzfeldt-Jakob disease. Neuropathology 2000, 20:124-133 [DOI] [PubMed] [Google Scholar]
- 55.Smith MZ, Nagy Z, Barnetson L, King EM, Esiri MM: Coexisting pathologies in the brain: influence of vascular disease and Parkinson’s disease on Alzheimer’s pathology in the hippocampus. Acta Neuropathol (Berl) 2000, 100:87–94 [DOI] [PubMed]
- 56.Buttini M, Orth M, Bellosta S, Akeefe H, Pitas RE, Wyss-Coray T, Mucke L, Mahley RW: Expression of human apolipoprotein E3 or E4 in the brains of Apoe−/− mice: isoform-specific effects on neurodegeneration. J Neurosci 1999, 19:4867-4880 [DOI] [PMC free article] [PubMed] [Google Scholar]
- 57.Kustova Y, Espey MG, Sung EG, Morse D, Sei Y, Basile AS: Evidence of neuronal degeneration in C57BL/6 mice infected with the LP-BM5 leukemia retrovirus mixture. Mol Chem Neuropathol 1998, 35:39-59 [DOI] [PubMed] [Google Scholar]
- 58.Saland LC, Thomas D, Morales M, Gaddy J: Synaptophysin immunoreactivity in the rat pituitary: alterations after 6-hydroxydopamine treatment. Endocrine 1998, 9:201-206 [DOI] [PubMed] [Google Scholar]
- 59.Robison PM, Clemens JA, Smalstig EB, Stephenson D, May PC: Decrease in amyloid precursor protein precedes hippocampal degeneration in rat brain following transient global ischemia. Brain Res 1993, 608:334-337 [DOI] [PubMed] [Google Scholar]
- 60.Matesic DF, Lin RC: Microtubule-associated protein 2 as an early indicator of ischemia-induced neurodegeneration in the gerbil forebrain. J Neurochem 1994, 63:1012-1020 [DOI] [PubMed] [Google Scholar]
- 61.Martin LN, Murphey-Corb M, Soike KF, Davison-Fairburn B, Baskin GB: Effects of initiation of 3′-azido,3′-deoxythymidine (zidovudine) treatment at different times after infection of rhesus monkeys with simian immunodeficiency virus. J Infect Dis 1993, 168:825-835 [DOI] [PubMed] [Google Scholar]
- 62.Zink MC, Suryanarayana K, Mankowski JL, Shen A, Piatak Jr M, Spelman JP, Carter DL, Adams RJ, Lifson JD, Clements JE: High viral load in the cerebrospinal fluid and brain correlates with severity of simian immunodeficiency virus encephalitis. J Virol 1999, 73:10480–10488 [DOI] [PMC free article] [PubMed]
- 63.Wang G, Achim CL, Hamilton RL, Wiley CA, Soontornniyomkij V: Tyramide signal amplification method in multiple-label immunofluorescence confocal microscopy. Methods 1999, 18:459-464 [DOI] [PubMed] [Google Scholar]
- 64.Ausubel FM, Brent R, Kingston RE, Moore DD, Seidman JG, Smith JA, Struhl K (Eds): Current Protocols in Molecular Biology. New York, John Wiley and Sons, Inc., 1994, pp 12.11.1–12.11.8
- 65.Lackner AA, Smith MO, Munn RJ, Martfeld DJ, Gardner MB, Marx PA, Dandekar S: Localization of simian immunodeficiency virus in the central nervous system of rhesus monkeys. Am J Pathol 1991, 139:609-621 [PMC free article] [PubMed] [Google Scholar]
- 66.Glass JD, Wesselingh SL, Selnes OA, McArthur JC: Clinical-neuropathologic correlation in HIV-associated dementia. Neurology 1993, 43:2230-2237 [DOI] [PubMed] [Google Scholar]
- 67.Power C, McArthur JC, Johnson RT, Griffin DE, Glass JD, Perryman S, Chesebro B: Demented and nondemented patients with AIDS differ in brain-derived human immunodeficiency virus type 1 envelope sequences. J Virol 1994, 68:4643-4649 [DOI] [PMC free article] [PubMed] [Google Scholar]
- 68.Johnson RT, Glass JD, McArthur JC, Chesebro BW: Quantitation of human immunodeficiency virus in brains of demented and nondemented patients with acquired immunodeficiency syndrome. Ann Neurol 1996, 39:392-395 [DOI] [PubMed] [Google Scholar]
- 69.Boche D, Khatissian E, Gray F, Falanga P, Montagnier L, Hurtrel B: Viral load and neuropathology in the SIV model. J Neurovirol 1999, 5:232-240 [DOI] [PubMed] [Google Scholar]
- 70.Demuth M, Czub S, Sauer U, Koutsilieri E, Haaft P, Heeney J, Stahl-Hennig C, ter Meulen V, Sopper S: Relationship between viral load in blood, cerebrospinal fluid, brain tissue and isolated microglia with neurological disease in macaques infected with different strains of SIV. J Neurovirol 2000, 6:187-201 [DOI] [PubMed] [Google Scholar]
- 71.Kure K, Weidenheim KM, Lyman WD, Dickson DW: Morphology and distribution of HIV-1 gp41-positive microglia in subacute AIDS encephalitis. Acta Neuropathol 1990, 80:393-400 [DOI] [PubMed] [Google Scholar]
- 72.Gosztonyi G, Artigas J, Lamperth L, Webster HD: Human immunodeficiency virus (HIV) distribution in HIV encephalitis: study of 19 cases with combined use of in situ hybridization and immunocytochemistry. J Neuropathol Exp Neurol 1994, 53:521-534 [DOI] [PubMed] [Google Scholar]
- 73.Llansola M, Saez R, Felipo V: NMDA-induced phosphorylation of the microtubule-associated protein MAP-2 is mediated by activation of nitric oxide synthase and MAP kinase. Eur J Neurosci 2001, 13:1283-1291 [DOI] [PubMed] [Google Scholar]
- 74.Choudhary S, Joshi K, Gill KD: Possible role of enhanced microtubule phosphorylation in dichlorvos induced delayed neurotoxicity in rat. Brain Res 2001, 897:60-70 [DOI] [PubMed] [Google Scholar]