

Abstract
The principal cells implicated as the source of the extracellular matrix in areas of progressive fibrosis are fibroblasts with the phenotypic appearance of myofibroblasts. This report describes differences in heparan sulfate proteoglycan expression between myofibroblasts and normal fibroblasts, associated with impaired responses to fibroblast growth factor-2 (FGF-2). Although both cell types responded to platelet-derived growth factor, myofibroblasts, unlike fibroblasts, did not proliferate to FGF-2. A response was acquired, however, when myofibroblasts were incubated with FGF-2 in the presence of heparan sulfate (HS) and heparin. Selective digestion with pronase, NaOH/NaBH4, heparinase I, or low pH nitrous acid showed that each HS-glycosaminoglycan region comprised a pronase-resistant peptide separating two HS chains. The HS-glycosaminoglycan chains from myofibroblasts were larger (Kav, 0.32; molecular weight, 50 kd) than those from fibroblasts (Kav, 0.4; molecular weight, 33 kd), although their disaccharide composition was identical. The chains from myofibroblasts, however, contained three, compared to two, heparinase 1-resistant sequences separated by larger contiguous areas of low sulfation. Furthermore, although there was no difference in FGF-2-binding affinity between the two cell types, the chains secreted by myofibroblasts had twice the binding capacity of those from fibroblasts. Thus, it is likely that the difference in response to FGF-2 is because of a difference in FGF-2 sequestration and receptor interaction with FGF-2-HS complexes. A comparative investigation into HS fine structure is being undertaken to examine these findings in more detail.
The decline in organ function associated with progressive fibrosis is directly linked to the accumulation of extracellular matrix. In most organs this matrix is synthesized by cells that are phenotypically myofibroblasts.1-7 Work from our own laboratory8,9 and others10-14 has focused on the potential importance of these cells in the development of renal fibrosis, in which they are considered the best marker of progressive disease.2,15-17 Myofibroblasts express the smooth muscle isoform of α-actin (α-SMA) and incorporate this into reorganized actin stress fibers. They also up-regulate their expression of the intercellular adhesion molecules ICAM-1 and VCAM-1 and synthesize increased amounts of extracellular matrix, particularly interstitial collagens.8,9
Matrix synthesis, deposition, and turnover are under the control of growth factors such as platelet-derived growth factor (PDGF) and fibroblast growth factor (FGF)-2. In many cells the biological effect of these cytokines is mediated by their initial interaction with matrix- and cell-associated proteoglycans.18-26 Proteoglycans have a protein core, which is covalently substituted with glycosaminoglycan (GAG) side chains. The binding of growth factors to these GAG chains, particularly heparan sulfate (HS) chains on the cell surface, is a prerequisite for the increased local concentration of many growth factors and their subsequent transfer to high-affinity signaling receptors.18,27-32 There are several different families of heparan sulfate proteoglycans (HSPGs) expressed on the surface of cells. These include the GPI-linked glypicans, the transmembrane syndecans, and the hyaluronan receptor CD44.33-37
We have recently described the identification and expression of cell surface HSPGs on renal fibroblasts and demonstrated that they were essential for the control of the proliferative response of these cells to FGF-2.38 The HS chains were shown to be the mediators of this response because it was blocked by removing them from the cell surface (with heparinase) or preventing their sulfation (with sodium chlorate). This was specific for FGF-2, because neither proliferation in response to PDGF-BB nor to fetal calf serum (FCS) was affected by these treatments. The current study extends these findings by examining differences in FGF-2 response and HS structure between these fibroblasts and renal myofibroblasts. The results suggest that, as a result of myofibroblastic differentiation, there is a change in the proteoglycan profile of the cell that is associated with a change in the responsiveness of the cells to FGF-2.
Materials and Methods
Materials
All general reagents were from Sigma-Aldrich (Poole, UK), unless stated otherwise. All tissue culture reagents were obtained from Gibco/BRL Life Technologies Ltd. (Paisley, UK). Radioisotopes were purchased from Amersham Biosciences (Little Chalfont, Bucks, UK).
Cell Culture
The renal fibroblast line NRK49F (ECACC no. 86101301) was obtained from the European Collection of Animal Cell Cultures (Salisbury Wiltshire) and cultured as described in Dulbecco’s modified Eagle’s medium (DMEM)/Ham’s F-12 containing 5% FCS.38 Myofibroblasts were initially derived by selection based on an increased proliferative rate and elongated morphology. Subsequently their phenotype was confirmed using α-SMA expression. Preliminary experiments demonstrated that in this medium the myofibroblasts had a doubling time of 33 ± 6 hours compared to 46 ± 5 hours for the fibroblasts (n = 3). There was also a difference in the time taken for the cells to become quiescent after removal of FCS. The cells were seeded at 2 × 10³ cells/ml and cultured for 24 hours in medium containing 5% FCS until 50% confluent. The medium was then removed and the cells washed in serum-free medium and placed in medium containing 0.2% lactalbumin hydrolysate (LH). Cell numbers were measured by 3-(4,5-dimethylthiazol-2-yl)-2.5-diphenyl tetrazolium bromide (MTT) assay (see below) at selected times thereafter. Both cell populations decreased their proliferative rate with the fibroblasts reaching a quiescent state by 30 hours. The rate of decrease was less marked, however, for the myofibroblasts, which did not enter growth arrest until 48 hours (data not shown). In all subsequent experiments, therefore, unless otherwise stated, cells were seeded at a density of 2 to 4 × 10⁴ cells/cm2 grown to 75% confluence and made quiescent for 48 hours in DMEM/Ham’s F-12 containing 0.2% LH.
Cell numbers were assessed by MTT assay or by direct counting using a Neubauer hemocytometer. For the MTT assay, the culture medium was removed and 100 μl of MTT (1.25 mg/ml in DMEM-Ham’s F-12) was added to the cell layer and incubated at 37°C for 4 hours. The formazan precipitate was solubilized in 20% sodium dodecyl sulfate and 50% dimethyl formamide overnight. The absorbance was read at 600 nm. In validation experiments there was a correlation coefficient of 0.95 between cell number and absorbance.
Proliferative Response of Myofibroblasts and Fibroblasts to Growth Factors
In all experiments to evaluate fibroblast proliferation, cells were growth-arrested for 48 hours before treatment or stimulation. The cells were then incubated either in serum-free medium, supplemented with 0.2% LH (negative control) or in serum-free medium containing FGF-2 or PDGF-BB (R & D Systems Europe Ltd., Abingdon, Oxford, UK). Cell numbers were then estimated by MTT assay at selected times after growth factor addition.
Immunocytochemistry
Fibroblasts were seeded in eight-well chamber slides at a density of 5 × 10³ cells/well and cultured in DMEM/Ham’s F-12 containing 5% FCS for 48 hours before washing with phosphate-buffered saline (PBS) and fixation with acetone:methanol (1:1) at −20°C for 2 minutes. The slides were air-dried and incubated with 1% dried milk and 1% bovine serum albumin in PBS for 1 hour at room temperature. The cells were then incubated with specific antibody; anti-vimentin (clone V9), anti-desmin (clone D33), or anti-α-SMA (clone IA4) (DAKO Ltd., High Wycombe, Bucks, UK) or appropriately diluted mouse serum for 1 hour at room temperature according the manufacturer’s recommended protocols. The slides were washed four times with 1% dried milk and 1% bovine serum albumin in PBS and primary antibody localized using anti-mouse IgG-fluorescein isothiocyanate conjugate (Sigma, Poole, Dorset, UK). Excess antibody was removed by extensive washing with PBS and the slides mounted with Vectashield fluorescent mountant (Vector Laboratories, Peterborough, UK).
Fluorecence-Activated Cell Sorting (FACS) Analysis of FGF Receptor Expression
Cells were grown to subconfluence in DMEM/Ham’s F-12 containing 5% FCS. They were then washed three times with PBS and made quiescent by growth arrest in 0.2% LH in DMEM/Ham’s F-12 for 48 hours. The cells were harvested by removing the culture medium, washing the cells with PBS three times, and replacing the final wash with ice-cold 0.05% ethylenediaminetetraacetic acid. The flasks were left on ice for 5 minutes and then cells detached by brief vigorous shaking. Detached cells were pelleted by centrifugation at 500 × g for 5 minutes and resuspended in 1 ml of FACS buffer (PBS containing 1 mmol/L of ethylenediaminetetraacetic acid, 1% bovine serum albumin, and 1.5 mmol/L of sodium azide). More than 95% of the cells were recovered by this method. One hundred μl of cell suspension (1 × 10⁵ cells) was then incubated for 30 minutes at 4°C with 1 μg/ml of each of the anti-FGF receptor (FGFR) antibodies (sc-121 for FGFR-1, sc-6930 for FGFR-2, sc-123 for FGFR-3, and sc-7590 for FGFR-4) purchased from Santa Cruz Biotechnology, Inc., Santa Cruz, CA. The cells were then pelleted by centrifugation for 5 minutes at 500 × g and washed three times in FACS buffer. Fluorescein isothiocyanate-conjugated anti-mouse IgG was then added to a final concentration of 10 μg/L and incubated with the cells for 30 minutes at 4°C. After three washes the cells were resuspended in 250 μl of FACS buffer and receptor expression was analyzed using a Becton Dickinson FACScaliber. Data were acquired from 5 × 10³ gated events for each sample. Fluorescence intensity readings and the number of cells in each cell population were expressed as mean ± 1 SD corrected for the mouse serum-negative control in four separate experiments.
Enzymatic Removal of HS GAG Chains
Fibroblasts were grown to subconfluence and incubated with a cocktail of 0.3 mU each of heparinase I, II, and III as previously described.38 The removal of HS chains was confirmed by immunohistochemistry using anti-HS antibody (10E4). The chains were then used, after heat-denaturation of the enzymes, to treat myofibroblasts at a concentration equivalent to the same number of fibroblasts extracted.
Metabolic Labeling of Proteoglycans with [35S]-Sulfate
Cells were metabolically labeled with [35S]-sulfate as described previously39-41 except that the medium was based on DMEM/Ham’s F-12.38 Briefly, the cells were washed three times with PBS and made quiescent by growth arrest in 0.2% LH in DMEM/Ham’s F-12 for 48 hours. They were then washed with PBS and labeled with 50 μCi/ml of carrier-free [35S]-sulfate in sulfate-free DMEM supplemented with 0.2% LH for 24 hours. After labeling, the culture medium was collected and cell surface proteoglycans were released by limited incubation with 20 μg/ml of trypsin in PBS on ice for 5 minutes. The remaining cell layer material was extracted with 4 mol/L of guanidine-HCl, 4% CHAPS in 50 mmol/L of sodium acetate buffer, pH 5.8, containing proteinase inhibitors.
Isolation and Analysis of [35S]-HSPG
The labeled extracts were dialyzed with 8 mol/L of urea and 20 mmol/L of Bis-Tris-HCl buffer, pH 6.0, containing 0.1% Triton X-100, and then passed over a 2-ml column of DEAE-Sephacel equilibrated in the same buffer. Material of low net charge was removed by washing the column with 5 bed volumes of urea buffer containing 0.3 mol/L of NaCl. The 35S-labeled proteoglycans were eluted from the DEAE with 4 bed volumes of 4 mol/L of guanidine-HCl buffered with 50 mmol/L of sodium acetate, pH 6.0, containing 0.5% Triton X-100, 1 mmol/L Na2SO4, and 0.05% Na2N3 (guanidine buffer).
Aliquots of 35S-labeled proteoglycans were precipitated with 3 volumes of 1.3% potassium acetate in 95% ethanol in the presence of 50 μg/ml each of heparin and chondroitin sulfate GAGs overnight at 4°C. The pellets were recovered by centrifugation and dried under nitrogen. To determine the level of HS GAGs, aliquots of [35S]-proteoglycans were incubated with 125 mU of chondroitin ABC lyase in 50 mmol/L of Tris-HCl, pH 8.0, containing 50 mmol/L of NaCl at 37°C overnight and the products were analyzed using PD-10 columns equilibrated with guanidine buffer. Further aliquots were precipitated and incubated with chondroitin ABC in the presence of proteinase inhibitors,39 the remaining [35S]-HSPGs were precipitated with ethanol and analyzed on a Sepharose CL–4B column (0.006 × 1.5 m) equilibrated in guanidine buffer. The V0 and Vt were routinely determined using 3H-labeled hyaluronan (Mr >2 × 10⁶) and 3H-labeled glucosamine, respectively, and were consistent to 2% of the run volume.
Isolation of [3H]-Glucosamine-Labeled HS GAG Chains
Cells were metabolically labeled with d-[6-3H]-glucosamine, 20 μCi/ml in 0.2% LH in DMEM/Ham’s F-12 for 24 hours. The medium was collected and the cell surface proteoglycans released with 20 μg/ml of trypsin in PBS on ice for 5 minutes. GAG chains remaining in the cell layer were released by incubation with 100 μg/ml pronase in 50 mmol/L of Tris-HCl, pH 8.0, containing 0.1% CHAPS and 0.05% NaN3 at 37°C overnight. The culture medium and cell surface proteoglycans were dialyzed against 50 mmol/L of Tris-HCl, pH 8.0, 0.1% CHAPS and 0.05% NaN3 and the GAG chains released by incubation with pronase (100 μg/ml) at 37°C overnight. To remove chondroitin or dermatan sulfate (CS or DS) GAG chains, pronase-digested chains were dialyzed against 50 mmol/L of Tris-HCl, pH 8.0, containing 50 mmol/L of NaCl and then incubated with 125 mU of chondroitin ABC lyase at 37°C overnight. The digests were chromatographed on a DEAE column equilibrated with 50 mmol/L of Tris-HCl buffer, pH 7.0. The column was washed with 0.25 mol/L of NaCl and the HS GAGs eluted with 1.5 mol/L of NaCl in the same buffer. The HS GAG chains were buffer-exchanged on PD-10 columns equilibrated in 0.2 mol/L of NH4HCO3 and lyophilized. DEAE ion exchange chromatography followed by PD-10 chromatography, in addition to isolating the HS GAGs released from intact proteoglycans also served to remove any small, low net charge CS and HS GAGs degradation fragments located in the cell layer.
Gel filtration chromatography of labeled GAG chains was performed on a Sepharose CL-6B column (0.006 × 1.5 m) equilibrated in 4 mol/L of guanidine-HCl buffered with 50 mmol/L of sodium acetate, pH 6.0, containing 0.5% Triton X-100, 1 mmol/L Na2SO4, and 0.05% NaN3. The column V0 and Vt were routinely determined as above and calibrated according to the method of Wasteson.42
Mild Alkaline Hydrolysis of GAG Chains
Radiolabeled GAG preparations (100 μl) were incubated with 0.5 ml of 1 mol/L NaBH4 in 0.1 mol/L of NaOH at 40°C for 24 hours. The reaction was neutralized with glacial acetic acid and the free GAG chains precipitated by incubation with 3 volumes of 1.3% potassium acetate in 95% ethanol in the presence of 50 μg/ml of chondroitin sulfate and 50 μg/ml of heparin at 4°C overnight and then analyzed on a Sepharose CL-6B column.
Limited Hydrolysis of HS GAGs with Heparinase 1
Aliquots of 3H-labeled HS GAGs were incubated with 20 mU/ml heparinase I in 50 mmol/L of sodium acetate buffer, pH 7.0, containing 0.5 mmol/L of calcium acetate at 37°C for 20 hours. The digests were then analyzed on the Sepharose CL-6B column as before.
Nitrous Acid Hydrolysis
HS chains were depolymerized in ice-cold nitrous acid according to the methods of Shively and Conrad.43,44 The products were lyophilized, suspended in 200 μl of 0.2 mol/L NH4HCO3, and chromatographed using a BioGel P-10 column (0.006 × 1.5 m) equilibrated with the same buffer.
Disaccharide Analysis Using Strong Anion Exchange Chromatography
The HS GAGs were lyophilized twice and incubated with 20 mU/ml each of heparinase I, II, and III in 50 mmol/L of sodium acetate buffer, pH 7.0, containing 0.5 mmol/L of calcium acetate at 37°C for 20 hours. The HS digest was passed over a BioGel P-2 column equilibrated with 0.2 mol/L of NH4HCO3. The disaccharide peak was lyophilized and then dissolved in acidified water (pH 3.5 with HCl). This was passed over a S5-SAX column (Anachem, Luton, UK) attached to a high pressure liquid chromatography system and the HS disaccharides eluted with a linear 0 to 0.75 mol/L NaCl gradient in acidified water.45 The radioactivity was determined with an online β-counter and radioactive peaks identified using standard HS disaccharides (Seikagaku, Tokyo, Japan) monitored at A232 nm.
Analysis of the Binding of HS GAGs to FGF-2
The FGF-2 binding assay was based on a modification of the procedure of Maccarana and colleagues.46 Briefly 100 ng of FGF-2 (R&D Systems, Abington, UK) was mixed overnight with 3H-labeled HS GAG chains in a total volume of 100 μl of 20 mmol/L Tris-HCl, pH 7.4, at 4°C. The mixture was passed through a 0.22-μm pore nitrocellulose membrane (Sartorious, Göttingen, Germany) under pressure. Reactive sites on the nitrocellulose were blocked by washing with 1 ml of 1% bovine serum albumin in 20 mmol/L of Tris-HCl, pH 7.4, containing 0.13 mol/L of NaCl. Nonbound material was removed by washing the membranes with 5 × 1-ml aliquots of 20 mmol/L Tris-HCl, pH 7.4 containing 0.13 mol/L NaCl. The bound material was then eluted with a stepwise gradient of 0.2 to 2 mol/L NaCl in 20 mmol/L Tris-HCl, pH 7.4. The relative binding was determined as a percentage of the total eluted radioactivity.
Results
Cell Growth and Morphology
Two distinct populations of fibroblasts with different phenotypes were isolated and cultured from the original population of NRK49F cells. Both cell types stained positively for vimentin (Figure 1, A and B)▶ . One population, however, stained poorly for α-SMA (Figure 1C)▶ , whereas the other was positive for α-SMA (Figure 1D)▶ . Both cell types were negative for desmin (Figure 1, E and F)▶ . The cells that stained positively for α-SMA were therefore considered phenotypically myofibroblastic.
Figure 1.
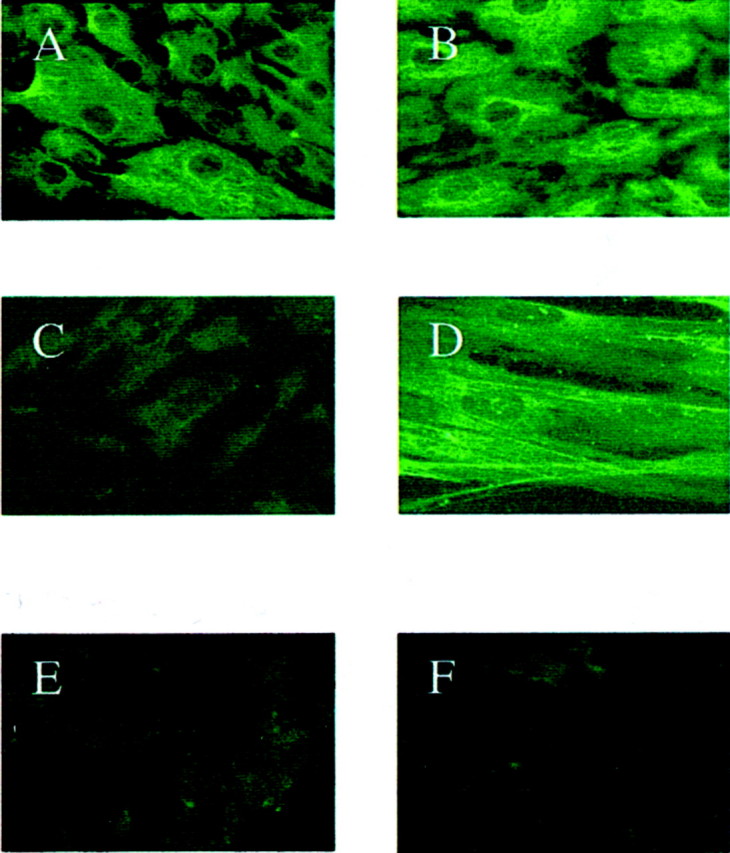
Renal fibroblasts (A, C, and E) and myofibroblasts (B, D, and F) were grown to subconfluence and examined after fixation by immunochemistry for vimentin (A and B), α-SMA (C and D), or desmin (E and F). Original magnifications: ×250 (A–C, E, F); ×400 (D).
Proliferative Responses to PDGF-BB and FGF-2
Both cell types proliferated in response to PDGF-BB in a dose-dependent manner (Figure 2A)▶ . In contrast, although the fibroblasts proliferated in response to FGF-2, there was no effect of FGF-2 on the myofibroblasts (Figure 2B)▶ . We have previously demonstrated that HS GAGs are essential for the interaction of FGF-2 with its receptors on the renal fibroblast. To investigate whether the lack of myofibroblast response was because of a defect in the capacity of FGF-2 to interact with cell surface HS or a defect in receptor signaling, myofibroblasts were incubated with FGF-2 in the presence of heparin or HS GAG chains as described previously.38 This has been reported to bypass the need for the presence of cell surface HS.33,47-49 Both heparin and the HS chains restored the proliferative response of the cells to FGF-2 (Figure 3)▶ . This suggests that the lack of response was because of a difference in the interaction of cell surface HS GAGs with FGF-2 or its receptor rather than to a defect in the FGFR per se.
Figure 2.
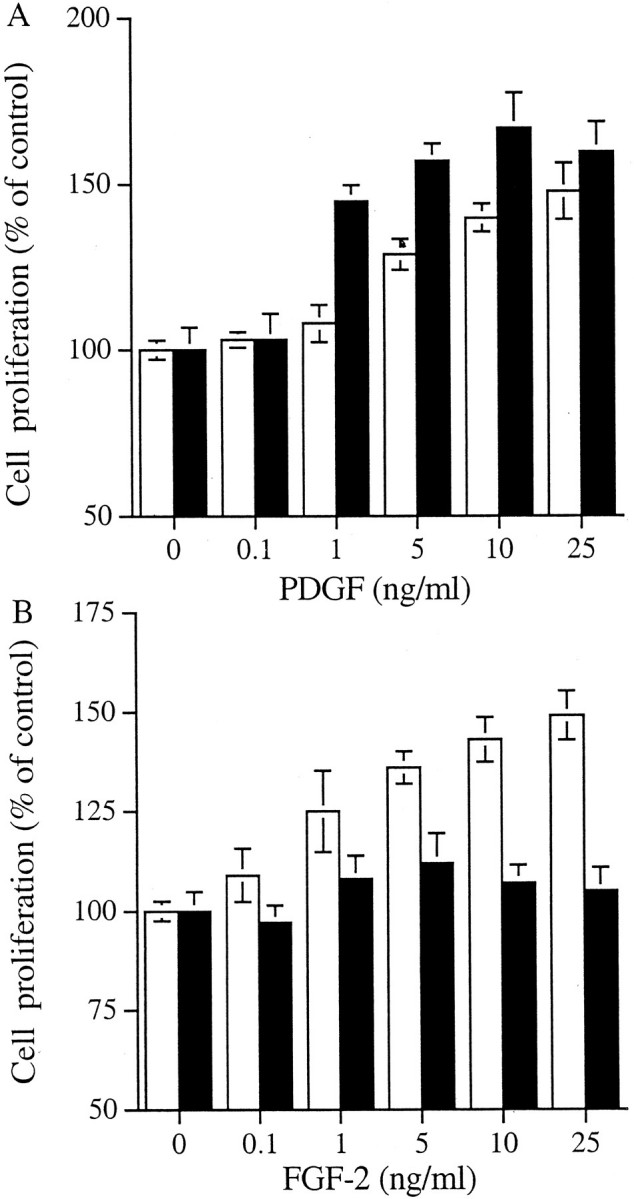
The effect of growth factors on cell proliferation. Fibroblasts (□) and myofibroblasts (▪) were growth-arrested in serum-free medium for 48 hours and then incubated with either PDGF (A) or FGF-2 (B) for 48 hours. Proliferation of the cells was measured by MTT assay and the results are expressed as mean percentage (±1 SD, n = 3) of the number of cells present in the absence of growth factors.
Figure 3.
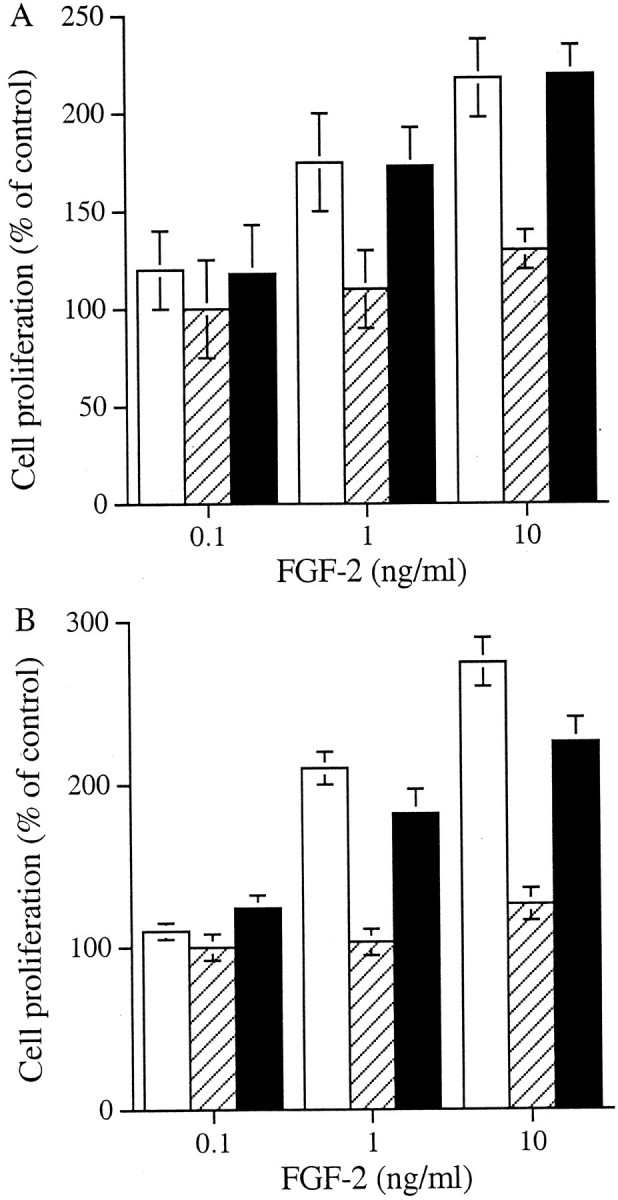
The effect of co-incubation of FGF-2 with heparin or HS chains on myofibroblast proliferation. Myofibroblasts were growth-arrested in serum-free medium for 48 hours then incubated with FGF-2 in the absence (▒) or presence (▪) of 10 U/ml of heparin (A) or HS chains (B) for 48 hours. Proliferation was measured by MTT assay and the results expressed as mean percentage (±1 SD, n = 3) of the number of cells present in the absence of the growth factor. The proliferative effect of FGF-2 on fibroblasts (□) is also shown as control.
FGFR Expression by Fibroblasts and Myofibroblasts
FACS analysis was used to assess whether there were differences in the cell-surface expression of the four major FGFRs between the two cell types. After analysis in four separate experiments there were no significant differences identified. Both fibroblasts and myofibroblasts expressed FGFR-1 and FGFR-4 but had only low levels of FGFR-2 and FGFR-3 expression (Table 1)▶ .
Table 1.
FACS Analysis of FGFR Expression on Fibroblasts and Myofibroblasts
| FGFR subtype | Mean fluorescence intensity,* ×101 | Cells gated,† % | ||
|---|---|---|---|---|
| Fibroblasts | Myofibroblasts | Fibroblasts | Myofibroblasts | |
| FGFR-1 | 0.98 ± 0.27 | 1.01 ± 0.33 | 69 ± 17 | 78 ± 22 |
| FGFR-2 | 0.17 ± 0.06 | 0.22 ± 0.05 | 25 ± 21 | 28 ± 11 |
| FGFR-3 | 0.29 ± 0.15 | 0.37 ± 0.09 | 22 ± 9 | 17 ± 2 |
| FGFR-4 | 0.88 ± 0.31 | 0.99 ± 0.02 | 66 ± 23 | 59 ± 19 |
The mean fluorescence intensity (*) and the percentage of cells staining positively (†) of cells immunolabeled with each of the FGFR subtypes was corrected for the negative control in four independent experiments and expressed as the mean ± 1 SD.
Incorporation of [35S]-Sulfate into GAGs
To investigate potential differences in HS expression between the two cell types we initially examined the profiles of proteoglycan synthesis between fibroblasts and myofibroblasts. Cells were growth-arrested and then metabolically labeled with [35S]-sulfate. The incorporation of 35S into proteoglycans in the culture medium (CM), on the cell surface or in the matrix was determined after separation on PD-10 columns. Overall the myofibroblastic cells incorporated 1.6-fold more [35S]-sulfate into proteoglycans (1096 ± 201 cpm/104 cells) than the fibroblasts (694 ± 260 cpm/104 cells, n = 3). Of the labeled material incorporated by myofibroblasts, 58% was in the CM, 18% was trypsin-extractable from the cell surface, and 24% remained in the cell layer. In contrast, the fibroblasts secreted 50% into the CM, 28% was cell surface-associated, and 22% was extracted with guanidine from the cell layer.
Next the 35S-labeled proteoglycans from each extract were isolated by DEAE ion exchange chromatography, precipitated with ethanol, incubated with chondroitin ABC lyase with proteinase inhibitors, and then chromatographed on a Sepharose CL-4B column. Representative patterns of the HSPGs after chondroitin ABC lyase digestion are shown in Figure 4▶ . The HSPGs of the myofibroblast cells eluted earlier on the Sepharose column indicating that they were slightly larger than those derived from the fibroblasts. In addition the results showed that more HSPG was in the medium of the myofibroblast cells but in contrast there was less associated with the cell surface (Figure 4▶ , compare A with B). Analysis of the cell-layer extract HSPGs also indicated an increased amount of labeled material associated with the myofibroblast phenotype (Figure 4C)▶ . In separate labeling experiments 35S-labeled proteoglycans from each extract were again isolated by DEAE ion exchange chromatography, the protein cores were digested with pronase and CS/DS GAG chains with chondroitin ABC lyase. The proportion that was HS was determined after separation on PD-10 columns. The increased synthesis of proteoglycans by myofibroblasts was reflected in increased amounts of HS GAG chains isolated (Table 2)▶ . Furthermore there was a higher proportion of the HS GAGs in the medium and in the cell layer extract of myofibroblasts when compared to fibroblasts. In contrast, the proportion of HS GAGs associated with the cell surface was higher in the fibroblasts. Together this data suggested that during the metabolic labeling period there was a greater proportion of shedding of HSPGs from the myofibroblast surface.
Figure 4.
Sepharose CL-4B chromatography of 35S HSPGs. Aliquots of 35S-labeled proteoglycans (normalized to cell number) were incubated with chondroitin ABC lyase overnight. The remaining HSPGs were recovered by alcohol precipitation and chromatographed on a Sepharose CL-4B column. Fibroblasts (○) and myofibroblasts (•): conditioned medium (A), cell surface (B), and cell layer extract (C).
Table 2.
Analysis of the Glycosaminoglycan Chains
| HS-GAG 35S radioactivity cpm/104 cells, (%) | ||
|---|---|---|
| Fibroblasts | Myofibroblasts | |
| Culture medium | 65 ± 20 (23) | 165 ± 46 (42) |
| Cell surface | 106 ± 34 (39) | 69 ± 12 (18) |
| Cell layer extract | 102 ± 37 (37) | 160 ± 24 (40) |
| Total | 273 ± 90 (100) | 394 ± 56 (100) |
The 35S-labeled proteoglycans were incubated with pronase and the released GAG chains precipitated with alcohol and incubated with chondroitin ABC lyase (see Materials and Methods). The HS-GAGs were then determined using Sephadex PD-10 columns. Results are given as 35S-radioactivity cpm/104 cells ± 1 SD, n = 3. The amount of GAG as a % of the total in each compartment is also included.
Analysis of the Cell Surface HS GAG Chains
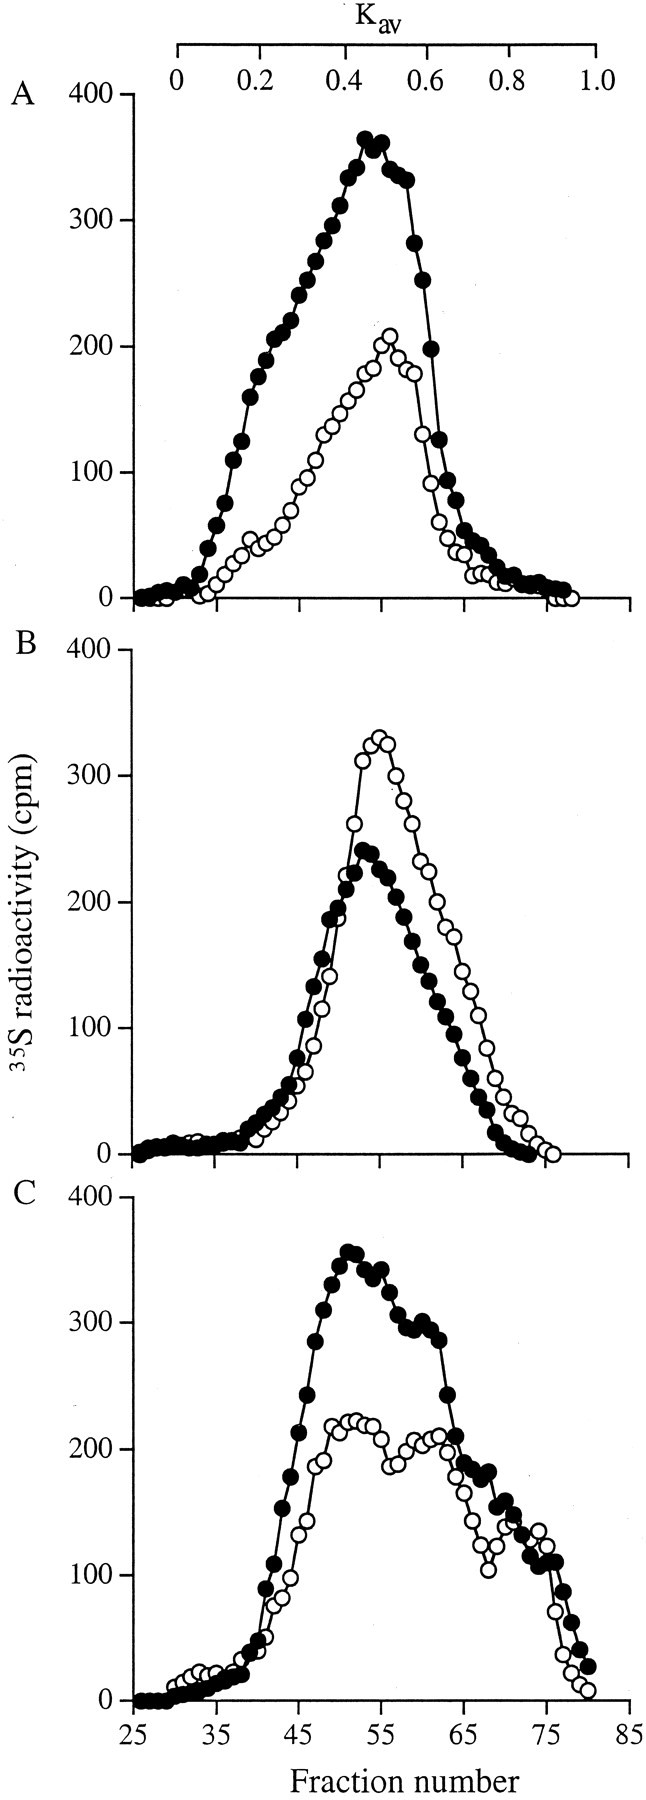
Potential differences in cell surface HS GAG composition between the two cell types were next examined after labeling with [3H]-glucosamine and the release of cell surface-associated proteoglycans with trypsin as before. The proteoglycans were then incubated with pronase followed by chondroitin ABC lyase and the remaining HS GAG chains were isolated using DEAE ion exchange chromatography. Subsequent separation on Sepharose CL-6B demonstrated that the fibroblast HS chains eluted in a single peak with a Kav of 0.28. The myofibroblast HS chains, also eluted in a single peak but with a Kav of 0.2 (Figure 5A)▶ . These values corresponded to sizes of ∼60 kd and 90 kd, respectively. Subsequent incubation with NaOH-NaBH4 caused a further reduction in size of the HS chains in both peaks to a Kav of 0.4 and 0.32 (33 and 50 kd), respectively (Figure 5B)▶ . Thus, in each case, because the molecular weight had approximately halved, the original GAG chain preparation had comprised two HS chains attached by a short pronase-resistant region of the proteoglycan core. Incubation of the HS GAGs with heparinase 1 resulted in a further reduction in hydrodynamic size of the chains from both cells, with labeled material eluting in a peak with a Kav of 0.56 (Figure 5C)▶ . This value was equivalent to a molecular weight of 15 kd, suggesting that the HS GAG chains from the fibroblast surface were composed of two heparinase-resistant domains in contrast to those from the myofibroblasts that had three such domains. Analysis of the GAG chains derived from HSPGs released into the medium and remaining in the cell layer also indicated that the myofibroblast chains were larger than those of the fibroblasts (data not shown). These observations therefore represented differences in core protein substitution that were not limited to a single class of HSPG but, rather were representative of all HSPGs synthesized by each phenotype of cell.
Figure 5.
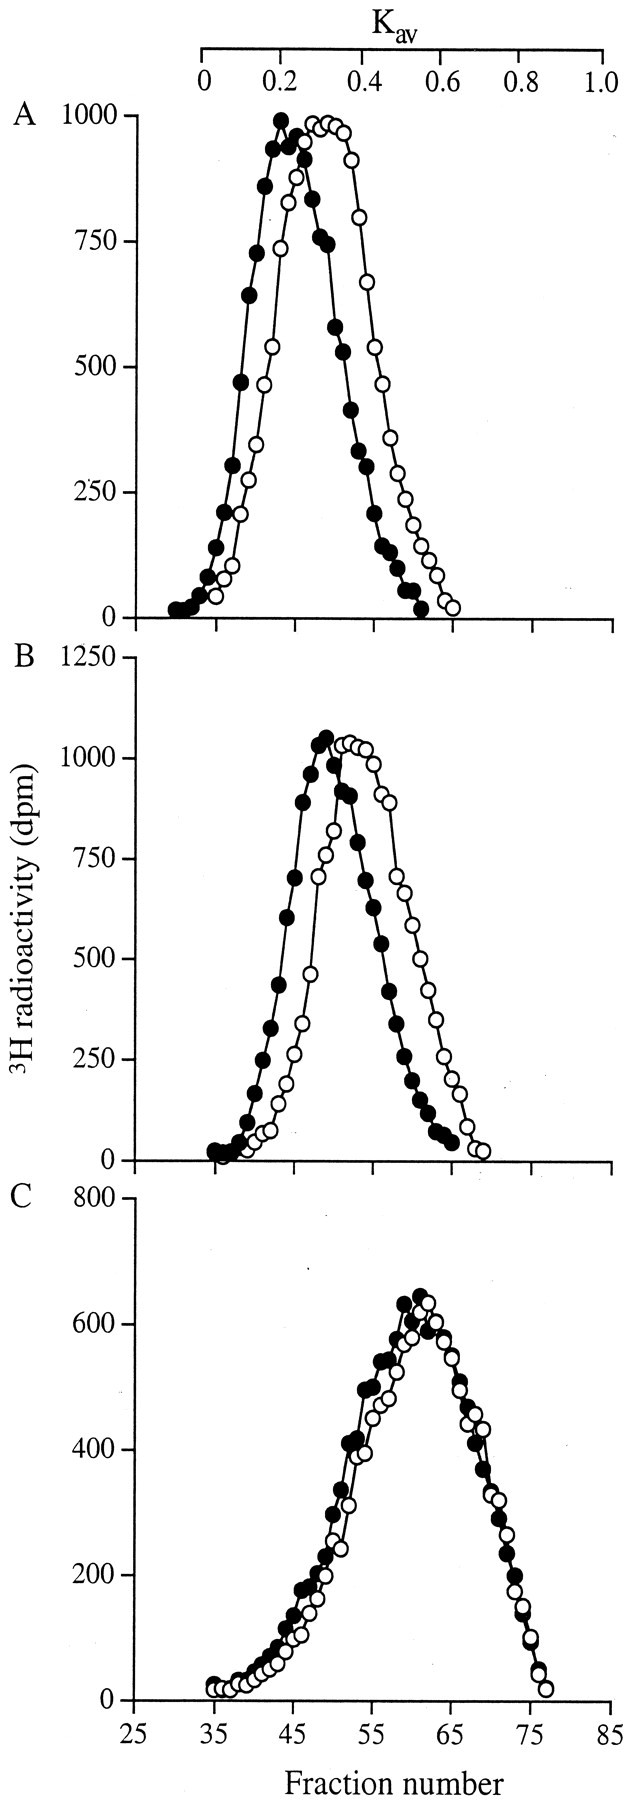
Sepharose CL-6B chromatography of cell-surface HS GAG chains. Fibroblasts (○) and myofibroblasts (•) were metabolically labeled with [3H]-glucosamine for 24 hours. The trypsin extract was then obtained as described. After digestion with chondroitin ABC lyase, the remaining HS GAGs were isolated using a mini DEAE column. Aliquots were then chromatographed on a Sepharose CL-6B column after no further treatment (A), incubation with NaOH-NaBH4 (B), and incubation with heparinase 1 (C). Results shown are representative of three identical experiments.
Internal Structure of the HS GAGs
To investigate potential differences in the disaccharide content of the HS chains they were analyzed, after exhaustive digestion, with a mixture of heparinase 1, 2, and 3, by strong anion exchange chromatography and the resulting peaks were identified by reference to well-characterized disaccharide standards. Comparison of the labeled disaccharides (Table 3)▶ showed that nonsulfated (Δdi-0S) were the most common disaccharide from both sources of HS GAG chains. The results of three independent experiments consistently showed no significant differences between the composition of the HS GAG chains obtained from myofibroblasts when compared to those from fibroblasts. Furthermore the disaccharide composition was similar whether derived from the medium, cell surface, or cell layer.
Table 3.
Analysis of [3H]-Heparan Sulfate Disaccharides by Strong Anion Exchange Chromatography
| Disaccharides | 3H-Radioactivity in peak (% of total) | |||||
|---|---|---|---|---|---|---|
| Culture medium | Cell surface extract | Cell layer extract | ||||
| Fibroblasts | Myofibroblasts | Fibroblasts | Myofibroblasts | Fibroblasts | Myofibroblasts | |
| ΔDi-0S | 56.6 ± 1.5 | 63.6 ± 1.5 | 62.7 ± 1.5 | 61.3 ± 1.5 | 59.3 ± 1.1 | 63.0 ± 5.2 |
| ΔDi-NS | 18.0 ± 1.7 | 14.3 ± 1.5 | 17.3 ± 1.5 | 18.3 ± 1.2 | 17.0 ± 1.0 | 17.0 ± 2.0 |
| ΔDi-6S | 7.0 ± 1.0 | 7.3 ± 2.1 | 6.7 ± 1.1 | 4.3 ± 0.6 | 6.7 ± 0.6 | 4.7 ± 1.2 |
| ΔDi-di(6,N)S | 4.0 ± 1.0 | 2.7 ± 0.6 | 3.0 ± 0.5 | 2.7 ± 0.6 | 3.7 ± 0.6 | 2.7 ± 1.5 |
| ΔDi-di(U,N)S | 9.0 ± 1.0 | 7.0 ± 0.0 | 7.3 ± 1.5 | 7.3 ± 0.6 | 8.0 ± 1.0 | 7.0 ± 1.0 |
| ΔDi-tri(U,6,N)S | 5.3 ± 1.5 | 5.0 ± 0.0 | 3.0 ± 1.7 | 4.3 ± 0.6 | 3.7 ± 0.6 | 5.7 ± 0.6 |
HS GAGs were incubated with a mixture of heparinases to fully degrade the HS to their constituent disaccharides. These were then analyzed using strong anion exchange chromatography. The results shown are mean ± 1 SD of three independent experiments.
Nitrous acid digestion of the GAG chains, followed by separation of the resultant oligosaccharides on a BioGel P-10 column revealed subtle differences in elution profile between the cell types. These differences were most marked in the chains isolated from the cell medium (Figure 6A)▶ , were less so in the chains from the cell surface (Figure 6B)▶ , and were least in the cell extract (Figure 6C)▶ . Nitrous acid cleaves HS chains at N-sulfated glucosamine residues. Low sulfated or nonsulfated regions are therefore resistant to digestion. The profiles revealed a greater proportion of large oligosaccharide sequences with low sulfation in the GAG chains derived from fibroblasts compared to those from myofibroblasts (marked with an arrow). They also showed that the percentage of low sulfated oligosaccharides in the 5 to 7 disaccharide size range was greater in the myofibroblast GAG preparation, implying more regions of N-sulfation in these chains.
Figure 6.
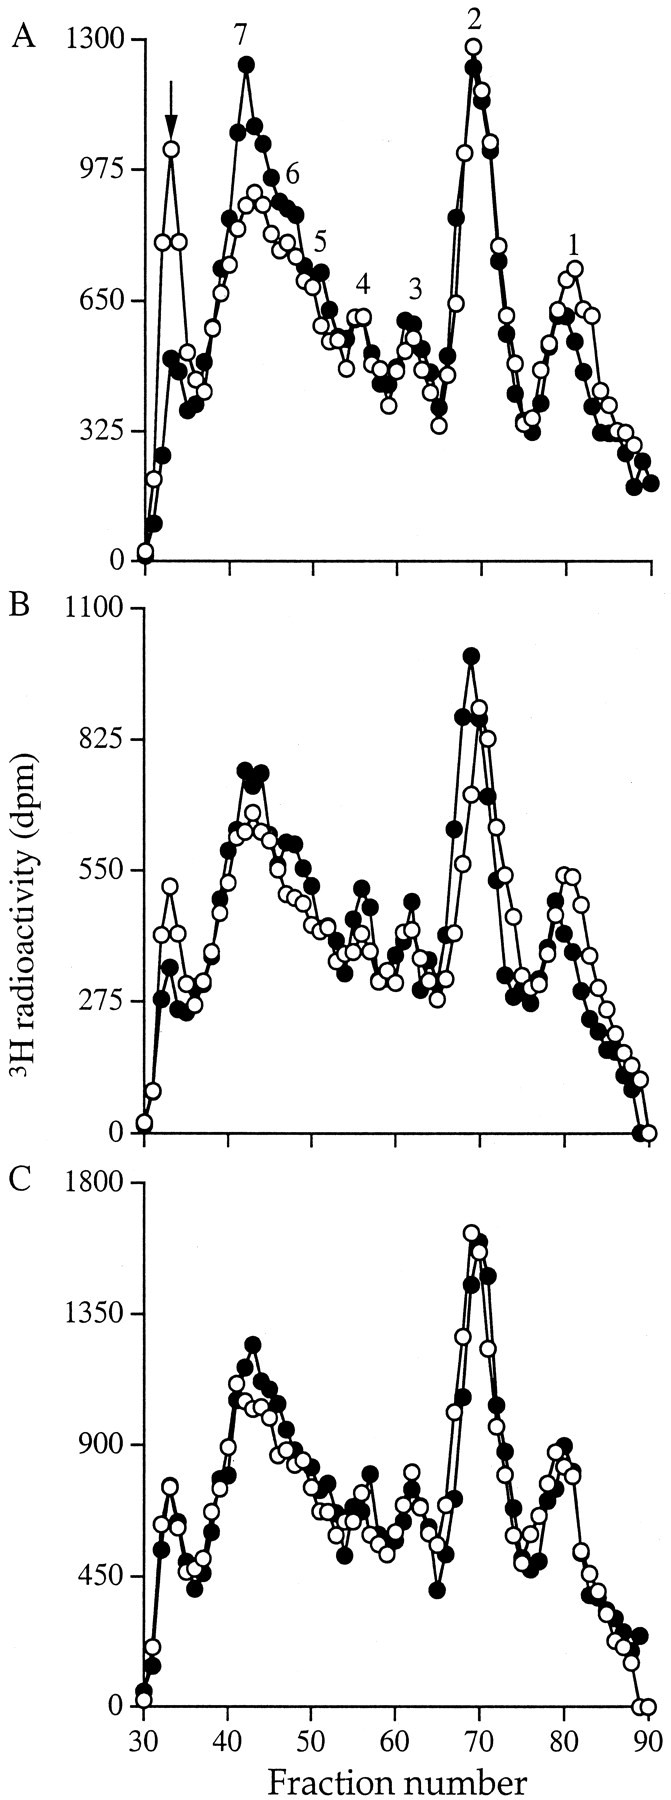
BioGel P-10 chromatography of nitrous acid-treated HS GAGs. Aliquots of the 3H-labeled HS GAG chains from fibroblasts (○) and myofibroblasts (•) were alcohol precipitated and incubated with ice-cold nitrous acid. The products were then separated on a BioGel P-10 column equilibrated with 0.2 mol/L of NH4HCO3 (see Materials and Methods). A: Culture medium; B: cell surface; and C: cell layer extract. The number of disaccharides making up each oligosaccharide peak is shown. Results are representative of three identical experiments.
The HS GAGs were next incubated with heparinase 3 and the products analyzed on a BioGel P-10 column. Approximately 65% of the HS chains were digested to disaccharides (Figure 7)▶ , confirming the strong ion exchange analysis results of high levels of unsulfated disaccharides. The remaining sulfated oligosaccharides were resolved into a broad peak corresponding to oligosaccharides of between three and six disaccharide units. The elution profile of the material from culture medium, cell surface, and cell layer extracts derived from myofibroblasts was identical to those from fibroblasts.
Figure 7.
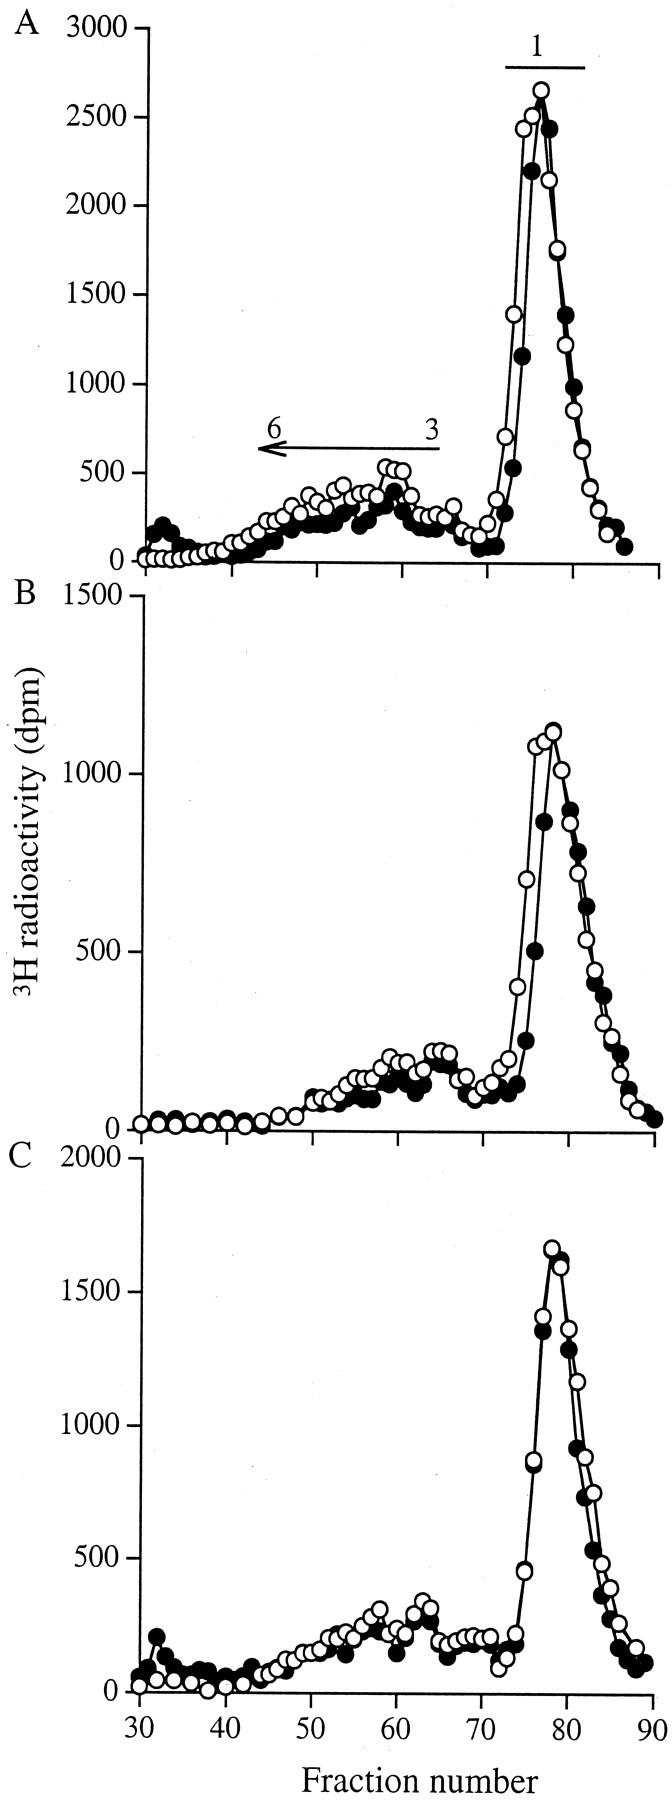
BioGel P-10 chromatography of heparinase 3-digested HS GAGs. Aliquots of the 3H-labeled HS GAGs obtained from fibroblasts (○) and myofibroblasts (•) were alcohol precipitated and incubated with heparinase 3. The products were then separated on a BioGel P-10 column equilibrated with 0.2 mol/L of NH4HCO3. A: Culture medium; B: cell surface; and C: cell layer extract. Results shown are representative of three identical experiments.
Analysis of HS GAG Binding Affinity for FGF-2
The possibility that the small structural differences identified between the myofibroblast and fibroblast HS chains reflected differences in their binding and subsequently in their response to FGF-2 was investigated using an in vitro binding assay. The majority of the HS chains from both cell types that bound to the immobilized rFGF-2, eluted with a NaCl concentration between 0.6 and 1.2 mol/L (Figure 8)▶ . Thus the HS GAGs from both cell types had a similar, albeit relatively weak, affinity for FGF-2, implying that the lack of a proliferative response of the myofibroblasts to FGF-2 was not because of their inability to bind the growth factor. A consistent finding, however, was that the HS chains released to the fibroblast culture medium bound a smaller absolute amount of FGF-2 than the chains in any other fibroblast or myofibroblast fraction (Table 4)▶ . HS chains isolated from the cell surface and from cell extracts of myofibroblasts bound 1.5-fold more FGF-2, consistent with a chain size 50% larger than the HS chains of the fibroblasts. Taking into account the differences in chain length between the fibroblast- and myofibroblast-derived material, HS chains isolated from the cell surface and from cell extracts of myofibroblasts should have had identical binding capacities to those of fibroblasts. The chains isolated from the culture medium of the fibroblasts however, had only 50% of the absolute binding capacity for FGF-2 as those from the myofibroblast medium (Table 4)▶ suggesting differences in domain assembly despite similar patterns of sulfation.
Figure 8.

The binding of HS GAGs to FGF-2. 3H-labeled HS GAGs were incubated with 100 ng of rhuman FGF-2 overnight and then passed over a 0.22-μm pore nitrocellulose membrane. Nonbound material was removed and bound material eluted with a stepwise gradient of NaCl. The relative binding affinity of the HS GAGs from fibroblasts (□) and myofibroblasts (▪) was determined as a percentage of the total eluted radioactivity (mean ± 1 SD, n = 3).
Table 4.
Comparison of the Binding of 3H-Labeled HS-GAG Chains to FGF-2
| Fibroblast, 3H-radioactivity (dpm ± 1SD) | Ratio | Myofibroblast, 3H-radioactivity (dpm ± 1 SD) | |||
|---|---|---|---|---|---|
| Bound | Total | Bound | Total | ||
| Medium | 544 ± 196 | 9313 ± 3822 | 1:3.6 | 1916 ± 560 | 9103 ± 2898 |
| Cell surface | 1355 ± 352 | 6326 ± 1216 | 1:1.4 | 1835 ± 325 | 6779 ± 395 |
| Cell layer | 1185 ± 136 | 6368 ± 353 | 1:1.5 | 1740 ± 61 | 5289 ± 166 |
The amount of fibroblast 3H-labeled HS-GAG that bound to the FGF was compared to that from the myofibroblasts. The results shown are mean ± 1 SD of three independent experiments.
Discussion
The present study demonstrated that renal myofibroblasts in culture did not proliferate in response to FGF-2, although they retained a proliferative response to PDGF. This lack of response, however, was overcome in the presence of heparin and HS chains, confirming that the cells possessed the necessary receptors and that in common with other systems,50-52 heparin can substitute for endogenous HSPG. Further examination revealed that there were several differences in structure between HS chains isolated from the myofibroblasts compared to those from renal fibroblasts.
HS GAG chains have a defined sequence of alternating glucosamine and hexuronate residues that may be sulfated or acetylated to various degrees. The amount and pattern of these variations are critical for ligand binding to the HS chain and for subsequent receptor presentation.20,28,31,53 This in turn directly affects the biological response of the target cell. Previous studies have investigated a range of modifications of HS chain structure and linked them to stages of differentiation or embryonic development or to in vitro culture conditions.54-56 The present study examined, for the first time, potential alterations related to the possession of a myofibroblastic phenotype that may, through changes in growth factor interaction, be associated with the progression of fibrosis.
HS chains from both fibroblasts and myofibroblasts had identical disaccharide composition. The chains from myofibroblasts, however, were larger and contained three, compared to two, equal-sized sequences that were released by digestion with heparinase 1. Heparinase 1 cleaves HS chains within sulfate-rich regions at an N-sulfated-glucosamine/sulfated-iduronic acid link. The size of the fragments generated, compared to the undigested chain, therefore, indicates the frequency of these areas of high sulfation. Because the fragments from each cell type were of similar size, the distribution of these domains within the molecule was similar but there were two domains in each chain in those from myofibroblasts compared to one in those from fibroblasts. In contrast to heparinase 1, heparinase 3 cleaves HS chains in N-acetylated regions of low sulfation. It therefore leaves areas of high sulfation intact allowing their size to be estimated. Separation of the HS chains from each cell type after digestion with heparinase 3 gave nearly identical profiles. More than 60% of the material from both cell types was degraded to disaccharides leaving only small sequences of between three and six disaccharide units representing heparinase 3-resistant domains of high sulfation. This is consistent with the finding of relatively few areas of heparinase 1 susceptibility and suggests that the sulfated regions are of similar size in both cell types.
Nitrous acid digestion of the HS chains was used to gather more information about the regions of N-sulfation. Nitrous acid at low pH cleaves at any N-sulfated glucosamine residue. Thus the generation of a large proportion of disaccharides would indicate that the starting material contained long sequences of N-sulfation. In contrast, the generation of oligosaccharides would indicate the presence of an increasing proportion of sequences with low N-sulfation. The overall distribution of N-sulfated disaccharides within the HS chains from each cell type was similar but not identical. Fibroblast-derived HS chains contained approximately twofold more of a large nitrous acid-resistant sequence, whereas myofibroblast-derived chains contained ∼20% more of a group of medium-sized (5 to 7 disaccharide length) oligosaccharides. In addition, the disaccharide peak derived from fibroblast HS chains was ∼20% larger than that derived from the myofibroblasts. Taken together with the heparinase data, the results of nitrous acid digestion suggest that the chains derived from fibroblasts contained domains of N-sulfation that were separated by larger sequences of low sulfation than those derived from myofibroblasts.
Although this interpretation can be applied successfully to those chains derived from material in the culture supernatant, the material derived from the cell surface showed fewer differences between the cell types, whereas that from the two cell layer extracts was almost identical. This implies either that the HS on all of the proteoglycans secreted into the medium had a different structure to that remaining cell associated or that the proteoglycan species comprising each population was different in the two locations. This latter explanation may imply a switch in core protein expression profile. Figure 4▶ , however, showing the intact HSPG profile of the cells, demonstrates that the elution patterns of HSPG in the medium, from the cell surface or cell and matrix associated are very similar between the cell types. This suggests that the HSPG composition in each compartment is similar. Again it is clear that in the medium and associated with cell layer there is more HSPG expressed by myofibroblasts while on the cell surface there is more from fibroblasts, as also shown in Table 2▶ . Although this supports the idea of differential shedding of similar HSPG populations, the possibility that there was a selective release of molecules possessing the altered HS structure cannot be ruled out. The detailed core protein expression of the syndecans, glypicans, and perlecan will, therefore, be investigated in more detail.
Most modifications to HS structure occur in or adjacent to domains of N-sulfation, resulting in highly sulfated sequences separated by nonsulfated or low-sulfated domains. The specific sequences that interact with FGF-2 have been well documented and those with highest affinity consist of alternating sulfated glucosamine with 2-O-sulfated glucuronic and iduronic acids. These sequences contain a heparinase 1 cleavage site and thus our results suggest that, although the HS GAG chains from the medium of myofibroblasts had a similar affinity for FGF-2, they had twice the FGF-2 binding capacity of the fibroblast HS GAG chains. Whether this is linked to the lack of response of the myofibroblasts to FGF-2 is currently under investigation.
Another HS-dependent event involved in FGF-2 signaling is presentation to the receptor. FGF-2 and other members of the FGF family bind to cell surface receptors (FGFR) encoded by four separate alternatively spliced genes.57,58 The isoforms of the FGFR that are expressed vary in their ligand-binding properties and in the structure of their kinase domains.18,58,59 They all contain a positively charged region in their extracellular domain, however, that binds to HS.60 Nevertheless, in view of the complexity of isoform expression, there may be more than one receptor activation mechanism.61 In addition, the type of cell surface HSPG involved in FGF-2 binding also affects activation. For example, syndecans 1, 2, and 4, and glypican, when co-expressed with FGFR-1 in K562 cells, potentiate FGF-2 activity.30 The soluble ectodomains of these HSPG, purified from lung fibroblasts, however, are inhibitory.27 It has also been suggested that variations in syndecan expression alone do not explain differences in FGF-FGFR complex formation but differences in HS GAG structure are more important.62 Thus the location of the HS sequences that bind to the FGFR, together with steric constraints may strongly influence the FGF-2 to FGFR interaction. For these reasons, we analyzed the expression of FGFR on the fibroblasts and myofibroblasts and found no significant differences. In both cell types FGFR-1 and FGFR-4 were the major receptors expressed, with the expression of FGFR-2 and FGFR-3 being very low. We have not yet examined the potential expression of alternatively spliced variants to take this further. These results, taken together, however, with the observations that both HS chains derived from fibroblasts and heparin can restore FGF-2 reactivity to myofibroblasts suggest that it is an HS-dependent binding interaction, rather than receptor activation that is the difference between the cell types. Whether this is a HS/FGF-2 or a HS/FGFR interaction or a combination of both is currently under investigation. Furthermore, for at least one cell surface HSPG (glypican) both inhibitory and activating properties of its HS chains have been described. In keratinocytes, glypican strongly inhibited the mitogenic response to keratinocyte growth factor but enhanced the response to FGF-1.37,63 It will also be important, therefore, to examine which cell surface HSPGs are expressed on each cell type and what proportion of each has been released to the medium.
The results of the present study demonstrate a difference between fibroblasts and myofibroblasts that may reflect the different functions of the two cell types. Thus, although a response of resident tissue fibroblasts to FGF-2 may initiate a fibrotic change, myofibroblasts in areas of fibrosis, although unresponsive to FGF-2, may elaborate a different response repertoire. We are, therefore, currently examining whether there is also a difference between the cells in terms of other selected HS interactions, such as that with fibronectin.64-66 The present study together with our future investigations may reveal important mechanisms underlying the progression of fibrosis. This, in turn, will increase our understanding of the control of cell function in fibrotic disease.
Footnotes
Address reprint requests to Robert Steadman, Ph.D., Institute of Nephrology, University of Wales College of Medicine, Heath Park, Cardiff, Wales, UK CF144XN. E-mail: steadmanr@cf.ac.uk.
Supported by the National Kidney Research Fund and Welsh Scheme for Development of Health and Social Research.
References
- 1.Badid C, Mounier N, Costa AM, Desmouliere A: Role of myofibroblasts during normal tissue repair and excessive scarring: interest of their assessment in nephropathies. Histol Histopathol 2000, 15:269-280 [DOI] [PubMed] [Google Scholar]
- 2.Badid C, Vincent M, Fouque D, Laville M, Desmouliere A: Myofibroblast: a prognostic marker and target cell in progressive renal disease. Ren Fail 2001, 23:543-549 [DOI] [PubMed] [Google Scholar]
- 3.Desmouliere A: Factors influencing myofibroblast differentiation during wound healing and fibrosis. Cell Biol Int 1995, 19:471-476 [DOI] [PubMed] [Google Scholar]
- 4.Desmouliere A, Gabbiani G: Myofibroblast differentiation during fibrosis. Exp Nephrol 1995, 3:134-139 [PubMed] [Google Scholar]
- 5.Desmouliere A, Tuchweber B, Gabbiani G: Role of the myofibroblast differentiation during liver fibrosis. J Hepatol 1995, 22:61-64 [PubMed] [Google Scholar]
- 6.Phan SH, Zhang K, Zhang HY, Gharaee-Kermani M: The myofibroblast as an inflammatory cell in pulmonary fibrosis. Curr Top Pathol 1999, 93:173-182 [DOI] [PubMed] [Google Scholar]
- 7.Vaquero E, Molero X, Tian X, Salas A, Malagelada JR: Myofibroblast proliferation, fibrosis, and defective pancreatic repair induced by cyclosporin in rats. Gut 1999, 45:269-277 [DOI] [PMC free article] [PubMed] [Google Scholar]
- 8.Clayton A, Steadman R, Williams JD: Cells isolated from the human cortical interstitium resemble myofibroblasts and bind neutrophils in an ICAM-1-dependent manner. J Am Soc Nephrol 1997, 8:604-615 [DOI] [PubMed] [Google Scholar]
- 9.Clayton A, Steadman R: ICAM-1 interactions in the renal interstitium: a novel activator of fibroblasts during nephritis. Histol Histopathol 1999, 14:861-870 [DOI] [PubMed] [Google Scholar]
- 10.Muller GA, Rodemann HP: Characterization of human renal fibroblasts in health and disease: I. Immunophenotyping of cultured tubular epithelial cells and fibroblasts derived from kidneys with histologically proven interstitial fibrosis. Am J Kidney Dis 1991, 17:680-683 [DOI] [PubMed] [Google Scholar]
- 11.Rodemann HP, Muller GA: Characterization of human renal fibroblasts in health and disease: II. In vitro growth, differentiation, and collagen synthesis of fibroblasts from kidneys with interstitial fibrosis. Am J Kidney Dis 1991, 17:684-686 [DOI] [PubMed] [Google Scholar]
- 12.Fine LG, Ong AC, Norman JT: Mechanisms of tubulo-interstitial injury in progressive renal diseases. Eur J Clin Invest 1993, 23:259-265 [DOI] [PubMed] [Google Scholar]
- 13.Eddy AA: Experimental insights into the tubulointerstitial disease accompanying primary glomerular lesions. J Am Soc Nephrol 1994, 5:1273-1287 [DOI] [PubMed] [Google Scholar]
- 14.Lewis MP, Fine LG, Norman JT: Pexicrine effects of basement membrane components on paracrine signaling by renal tubular cells. Kidney Int 1996, 49:48-58 [DOI] [PubMed] [Google Scholar]
- 15.Goumenos DS, Brown CB, Shortland J, el Nahas AM: Myofibroblasts, predictors of progression of mesangial IgA nephropathy? Nephrol Dial Transplant 1994, 9:1418-1425 [PubMed] [Google Scholar]
- 16.Zhang G, Moorhead PJ, el Nahas AM: Myofibroblasts and the progression of experimental glomerulonephritis. Exp Nephrol 1995, 3:308-318 [PubMed] [Google Scholar]
- 17.Norman JT, Fine LG: Progressive renal disease: fibroblasts, extracellular matrix, and integrins. Exp Nephrol 1999, 7:167-177 [DOI] [PubMed] [Google Scholar]
- 18.Coutts JC, Gallagher JT: Receptors for fibroblast growth factors. Immunol Cell Biol 1995, 73:584-589 [DOI] [PubMed] [Google Scholar]
- 19.Gallagher JT: Heparan sulphate and protein recognition. Binding specificities and activation mechanisms. Adv Exp Med Biol 1995, 376:125-134 [DOI] [PubMed] [Google Scholar]
- 20.Gallagher JT: Structure-activity relationship of heparin sulphate. Biochem Soc Trans 1997, 25:1206-1209 [DOI] [PubMed] [Google Scholar]
- 21.Hildebrand A, Romaris M, Rasmussen LM, Heinegard D, Twardzik DR, Border WA, Ruoslahti E: Interaction of the small interstitial proteoglycans biglycan, decorin and fibromodulin with transforming growth factor beta. Biochem J 1994, 302:527-534 [DOI] [PMC free article] [PubMed] [Google Scholar]
- 22.Humes HD, Nakamura T, Cieslinski DA, Miller D, Emmons RV, Border WA: Role of proteoglycans and cytoskeleton in the effects of TGF-beta 1 on renal proximal tubule cells. Kidney Int 1993, 43:575-584 [DOI] [PubMed] [Google Scholar]
- 23.Lyon M, Gallagher JT: Hepatocyte growth factor/scatter factor: a heparan sulphate-binding pleiotropic growth factor. Biochem Soc Trans 1994, 22:365-370 [DOI] [PubMed] [Google Scholar]
- 24.Lyon M, Rushton G, Gallagher JT: The interaction of the transforming growth factor-betas with heparin/heparan sulfate is isoform-specific. J Biol Chem 1997, 272:18000-18006 [DOI] [PubMed] [Google Scholar]
- 25.Lyon M, Deakin JA, Rahmoune H, Fernig DG, Nakamura T, Gallagher JT: Hepatocyte growth factor/scatter factor binds with high affinity to dermatan sulfate. J Biol Chem 1998, 273:271-278 [DOI] [PubMed] [Google Scholar]
- 26.Lyon M, Gallagher JT: Bio-specific sequences and domains in heparan sulphate and the regulation of cell growth and adhesion. Matrix Biol 1998, 17:485-493 [DOI] [PubMed] [Google Scholar]
- 27.Aviezer D, Levy E, Safrant M, Svahn C, Buddecke E, Schmidt A, David G, Vlodavsky I, Yayon A: Differential structural requirements of heparin and heparan sulfate proteoglycans that promote binding of basic fibroblast growth factor to its receptor. J Biol Chem 1994, 269:114-121 [PubMed] [Google Scholar]
- 28.Fernig DG, Gallagher JT: Fibroblast growth factors and their receptors: an information network controlling tissue growth, morphogenesis and repair. Prog Growth Factor Res 1994, 5:353-377 [DOI] [PubMed] [Google Scholar]
- 29.Gallagher JT: Heparan sulphates as membrane receptors for the fibroblast growth factors. Eur J Clin Chem Clin Biochem 1994, 32:239-247 [PubMed] [Google Scholar]
- 30.Steinfeld R, Van Den Berghe H, David G: Stimulation of fibroblast growth factor receptor-1 occupancy and signaling by cell surface-associated syndecans and glypican. J Cell Biol 1996, 133:405-416 [DOI] [PMC free article] [PubMed] [Google Scholar]
- 31.Jayson GC, Vives C, Paraskeva C, Schofield K, Coutts J, Fleetwood A, Gallagher JT: Coordinated modulation of the fibroblast growth factor dual receptor mechanism during transformation from human colon adenoma to carcinoma. Int J Cancer 1999, 82:298-304 [DOI] [PubMed] [Google Scholar]
- 32.Guimond SE, Turnbull JE: Fibroblast growth factor receptor signalling is dictated by specific heparan sulphate saccharides. Curr Biol 1999, 9:1343-1346 [DOI] [PubMed] [Google Scholar]
- 33.Rapraeger A, Krufla A, Olwin BB: Requirement of heparin sulfate for bFGF-mediated fibroblast growth and myoblast differentiation. Science 1991, 252:1705-1708 [DOI] [PubMed] [Google Scholar]
- 34.Bernfield M, Kokenyesi R, Kato M, Spring MT, Gallo J, Lose E: Biology of the syndecans: a family of transmembrane heparan sulphate proteoglycans. Annu Rev Cell Biol 1992, 8:365-393 [DOI] [PubMed] [Google Scholar]
- 35.Abboud HE: Growth factors in glomerulonephritis. Kidney Int 1993, 43:252-257 [DOI] [PubMed] [Google Scholar]
- 36.Kim CW, Goldberger OA, Gallo RL, Bernfield M: Members of the syndecan family of heparan sulfate proteoglycans are expressed in distinct cell-, tissue-, and development-specific patterns. Mol Biol Cell 1994, 5:797-805 [DOI] [PMC free article] [PubMed] [Google Scholar]
- 37.Bonneh-Barkay D, Shlissel M, Berman B, Shaoul E, Admon A, Vlodavsky I, Carey DJ, Asundi VK, Reich-Slotky R, Ron D: Identification of glypican as a dual modulator of the biological activity of fibroblast growth factors. J Biol Chem 1997, 272:12415-12421 [DOI] [PubMed] [Google Scholar]
- 38.Clayton A, Thomas J, Thomas GJ, Davies M, Steadman R: Cell surface heparan sulfate proteoglycans control the response of renal interstitial fibroblasts to fibroblast growth factor-2. Kidney Int 2001, 59:2084-2094 [DOI] [PubMed] [Google Scholar]
- 39.Thomas GJ, Jenner L, Mason RM, Davies M: Human glomerular epithelial cell proteoglycans. Arch Biochem Biophys 1990, 278:11-20 [DOI] [PubMed] [Google Scholar]
- 40.Thomas GJ, Bayliss MT, Harper K, Mason RM, Davies M: Glomerular mesangial cells in vitro synthesize an aggregating proteoglycan immunologically related to versican. Biochem J 1994, 302:49-56 [DOI] [PMC free article] [PubMed] [Google Scholar]
- 41.Thomas GJ, Shewring L, McCarthy KJ, Couchman JR, Mason RM, Davies M: Rat mesangial cells in vitro synthesize a spectrum of proteoglycan species including those of the basement membrane and interstitium. Kidney Int 1995, 48:1278-1289 [DOI] [PubMed] [Google Scholar]
- 42.Wasteson A: A method for the determination of the molecular weight and molecular-weight distribution of chondroitin sulphate. J Chromatogr 1971, 59:87-97 [DOI] [PubMed] [Google Scholar]
- 43.Shively JE, Conrad HE: Formation of anhydrosugars in the chemical depolymerization of heparin. Biochemistry 1976, 15:3932-3942 [DOI] [PubMed] [Google Scholar]
- 44.Shively JE, Conrad HE: Nearest neighbor analysis of heparin: identification and quantitation of the products formed by selective depolymerization procedures. Biochemistry 1976, 15:3943-3950 [DOI] [PubMed] [Google Scholar]
- 45.Lyon M, Deakin JA, Gallagher JT: Liver heparan sulfate structure. A novel molecular design. J Biol Chem 1994, 269:11208-11215 [PubMed] [Google Scholar]
- 46.Maccarana M, Casu B, Lindahl U: Minimal sequence in heparin/heparan sulfate required for binding of basic fibroblast growth factor [published erratum appears in J Biol Chem 1994 Feb 4;269(5): 3903].J Biol Chem 1993, 268:23898-23905 [PubMed] [Google Scholar]
- 47.Guimond S, Maccarana M, Olwin BB, Lindahl U, Rapraeger AC: Activating and inhibitory heparin sequences for FGF-2 (basic FGF). Distinct requirements for FGF-1, FGF-2, and FGF-4. J Biol Chem 1993, 268:23906-23914 [PubMed] [Google Scholar]
- 48.Walker A, Turnbull JE, Gallagher JT: Specific heparan sulfate saccharides mediate the activity of basic fibroblast growth factor. J Biol Chem 1994, 269:931-935 [PubMed] [Google Scholar]
- 49.Ishihara M: Function and structure of heparan sulfate—modification of FGF activities. Tanpakushitsu Kakusan Koso 1995, 40:1122-1133 [PubMed] [Google Scholar]
- 50.Herr AB, Ornitz DM, Sasisekharan R, Venkataraman G, Waksman G: Heparin-induced self-association of fibroblast growth factor-2. Evidence for two oligomerization processes. J Biol Chem 1997, 272:16382-16389 [DOI] [PubMed] [Google Scholar]
- 51.Moy FJ, Safran M, Seddon AP, Kitchen D, Bohlen P, Aviezer D, Yayon A, Powers R: Properly oriented heparin-decasaccharide-induced dimers are the biologically active form of basic fibroblast growth factor. Biochemistry 1997, 36:4782-4791 [DOI] [PubMed] [Google Scholar]
- 52.DiGabriele AD, Lax I, Chen DI, Svahn CM, Jaye M, Schlessinger J, Hendrickson WA: Structure of a heparin-linked biologically active dimer of fibroblast growth factor. Nature 1998, 393:812-817 [DOI] [PubMed] [Google Scholar]
- 53.Gallagher JT: Heparan sulfate: growth control with a restricted sequence menu. J Clin Invest 2001, 108:357-361 [DOI] [PMC free article] [PubMed] [Google Scholar]
- 54.Brickman YG, Ford MD, Small DH, Bartlett PF, Nurcombe V: Heparan sulfates mediate the binding of basic fibroblast growth factor to a specific receptor on neural precursor cells. J Biol Chem 1995, 270:24941-24948 [DOI] [PubMed] [Google Scholar]
- 55.Brickman YG, Ford MD, Gallagher JT, Nurcombe V, Bartlett PF, Turnbull JE: Structural modification of fibroblast growth factor-binding heparan sulfate at a determinative stage of neural development. J Biol Chem 1998, 273:4350-4359 [DOI] [PubMed] [Google Scholar]
- 56.Brickman YG, Nurcombe V, Ford MD, Gallagher JT, Bartlett PF, Turnbull JE: Structural comparison of fibroblast growth factor-specific heparan sulfates derived from a growing or differentiating neuroepithelial cell line. Glycobiology 1998, 8:463-471 [DOI] [PubMed] [Google Scholar]
- 57.Green PJ, Walsh FS, Doherty P: Promiscuity of fibroblast growth factor receptors. Bioessays 1996, 18:639-646 [DOI] [PubMed] [Google Scholar]
- 58.Klint P, Claesson-Welsh L: Signal transduction by fibroblast growth factor receptors. Front Biosci 1999, 4:D165-D177 [DOI] [PubMed] [Google Scholar]
- 59.Szebenyi G, Fallon JF: Fibroblast growth factors as multifunctional signaling factors. Int Rev Cytol 1999, 185:45-106 [DOI] [PubMed] [Google Scholar]
- 60.Kan M, Wang F, To B, Gabriel JL, McKeehan WL: Divalent cations and heparin/heparan sulfate cooperate to control assembly and activity of the fibroblast growth factor receptor complex. J Biol Chem 1996, 271:26143-26148 [DOI] [PubMed] [Google Scholar]
- 61.Krufka A, Guimond S, Rapraeger AC: Two hierarchies of FGF-2 signaling in heparin: mitogenic stimulation and high-affinity binding/receptor transphosphorylation. Biochemistry 1996, 35:11131-11141 [DOI] [PubMed] [Google Scholar]
- 62.Mundhenke C, Meyer K, Drew S, Friedl A: Heparan sulfate proteoglycans as regulators of fibroblast growth factor-2 receptor binding in breast carcinomas. Am J Pathol 2002, 160:185-194 [DOI] [PMC free article] [PubMed] [Google Scholar]
- 63.Berman B, Ostrovsky O, Shlissel M, Lang T, Regan D, Vlodavsky I, Ishai-Michaeli R, Ron D: Similarities and differences between the effects of heparin and glypican-1 on the bioactivity of acidic fibroblast growth factor and the keratinocyte growth factor. J Biol Chem 1999, 274:36132-36138 [DOI] [PubMed] [Google Scholar]
- 64.Couchman JR, Woods A: Syndecans, signaling, and cell adhesion. J Cell Biochem 1996, 61:578-584 [DOI] [PubMed] [Google Scholar]
- 65.Woods A, Longley RL, Tumova S, Couchman JR: Syndecan-4 binding to the high affinity heparin-binding domain of fibronectin drives focal adhesion formation in fibroblasts. Arch Biochem Biophys 2000, 374:66-72 [DOI] [PubMed] [Google Scholar]
- 66.Couchman JR, Chen L, Woods A: Syndecans and cell adhesion. Int Rev Cytol 2001, 207:113-150 [DOI] [PubMed] [Google Scholar]