

Abstract
Background
Relatively little is known about why older persons develop long-term disability in community mobility.
Objectives
To identify the risk factors and precipitants for long-term disability in walking ¼ mile and driving a car, respectively.
Design
Prospective cohort study from March 1998 to December 2009.
Setting
Greater New Haven, Connecticut.
Participants
641 persons, 70+ years, who were active drivers or nondisabled in walking ¼ mile. Persons who were physically frail were oversampled.
Measurements
Candidate risk factors were assessed every 18 months. Disability in community mobility and exposure to potential precipitants, which included illnesses/injuries leading to hospitalization or restricted activity, respectively, were assessed every month. Disability lasting ≥6 consecutive months was considered long term.
Results
318 (56.0%) and 269 (53.1%) participants developed long-term disability in walking and driving, respectively. Seven risk factors were independently associated with walking disability, while eight were associated with driving disability; the strongest associations for each outcome were found for older age and lower score on the Short Physical Performance Battery. The effects of the precipitants on long-term disability were large, with multivariable hazard ratios for each outcome greater than 6 for hospitalization and 2.4 for restricted activity. The largest differences in absolute risk were generally observed for participants who had a specific risk factor and were subsequently hospitalized.
Limitations
The observed associations may not be causal. The severity of precipitants was not assessed. The effect of the precipitants may have been underestimated because their exposure after the initial onset of disability was not evaluated.
Conclusions
Long-term disability in community mobility is common among older persons. Multiple risk factors, together with subsequent precipitants, greatly increase the likelihood of developing long-term mobility disability.
Primary Funding Source
National Institute on Aging.
INTRODUCTION
Maintaining independent mobility is an important goal of clinical medicine and public health, especially among older persons, who are at the greatest risk for functional decline and disability. Older persons who lose independent mobility are less likely to remain in the community, have higher rates of morbidity, mortality, and self-care disability, and experience a poorer quality of life, with an increased likelihood of depression and social isolation (1–5). Moreover, in 2004 mobility disability among Medicare beneficiaries was estimated to confer more than $42 billion in additional health care costs and over 2 million additional hospitalizations (5).
Among older persons, disability in walking a quarter mile is common and often persists for six months or more (i.e. long term) (6). After an episode of long-term mobility disability, the likelihood of regaining sustained independence is very low and the mortality rate is high. Community mobility includes not only walking outside one's home, but also driving a car (7). For many older persons, the automobile is the most important—and often the only—source of transportation. Relatively little is known about why older persons develop long-term disability in community mobility. Prior research has focused largely on the initial onset of mobility disability (8–16), has evaluated driving cessation alone (17,18), and has not considered the role of intervening events, including illnesses or injuries leading to hospitalization or restricted activity. These events commonly precipitate disability in essential activities of daily living and impede recovery from prefrail and frail states (19,20).
The objective of the current study was to identify the risk factors and precipitants for the development of long-term disability in community mobility, including walking a quarter mile and driving a car, respectively. These two mobility tasks allow individuals to remain engaged in the community as they grow older. We postulated that long-term disability in community mobility is attributable to a combination of predisposing factors that make one vulnerable (e.g., weight loss) and intervening illnesses or injuries that act as precipitants (e.g., serious infection), and that the strongest single determinant of long-term disability in community mobility would be a major intervening event, such as hospitalization.
METHODS
Study Population
Participants were members of the Precipitating Events Project, a longitudinal study of 754 community-living persons, aged 70 years or older, who were nondisabled (i.e. required no personal assistance) at baseline in four essential activities of daily living—bathing, dressing, walking inside the house, and transferring from a chair (21). Exclusion criteria included significant cognitive impairment with no available proxy (22), inability to speak English, diagnosis of a terminal illness with a life expectancy less than 12 months, and a plan to move out of the New Haven area during the next 12 months.
The assembly of the cohort, which took place between March 1998 and October 1999, is summarized in Appendix Figure 1 and has been described in detail elsewhere (21,23). In brief, potential participants were identified from a computerized list of 3,157 age-eligible members of a large health plan in greater New Haven, Connecticut. Eligibility was determined during a screening telephone interview and was confirmed during an in-home assessment. Persons who were physically frail, as denoted by a timed score of greater than 10 seconds on a rapid gait test (i.e. walk back and forth over a 10-ft [3-m] course as quickly as possible), were oversampled based on our initial sample size estimates for disability in activities of daily living (19,24). Only 4.6% of the 2,753 health plan members who were alive and could be contacted refused to complete the screening telephone interview, and 75.2% of the eligible members agreed to participate in the project. There were no statistically significant differences between persons who refused to participate and those who were enrolled according to age or sex. The study protocol was approved by the Yale Human Investigation Committee, and all participants provided verbal informed consent.
Data Collection
Data on the candidate risk factors were collected during comprehensive home-based assessments, while data on potential precipitants and community mobility were collected during monthly telephone interviews. The comprehensive assessments were completed by trained nurse researchers at baseline and every 18 months for 9 years, while the telephone interviews were completed for a median of 110 months by a separate team of researchers. For participants who had significant cognitive impairment or were otherwise unavailable, we interviewed a proxy informant, using a rigorous protocol, with demonstrated reliability and validity, as described in an earlier report (22). Deaths were ascertained by review of the local obituaries and/or from an informant during a subsequent telephone interview. Four hundred eighteen (55.4%) participants died after a median follow-up of 71 months, while 35 (4.6%) dropped out of the study after a median follow-up of 24 months. Data were otherwise available for 95.9% of the 4,097 comprehensive assessments and 98.7% of the 69,096 monthly interviews.
Candidate Risk Factors
In addition to demographic factors, we considered potential risk factors from four domains that have been linked to disability in prior studies (Table 1) (25). The health-related factors included nine self-reported, physician-diagnosed chronic conditions, corrected near vision (26), hearing (27), and self-report of a 10-pound weight loss in the past year (28). The cognitive-psychosocial factors included cognitive status (29), depressive symptoms (30), functional self-efficacy (31) and social support (32). The behavioral factors included smoking status, physical activity (33,34), and body-mass index (35).
Table 1.
Baseline Characteristics and Bivariate Associations Between Candidate Risk Factors and Long-Term Disability in Community Mobility
| First Analytic Sample Walking a Quarter Mile (n=568) |
Second Analytic Sample Driving a Car (n=507) |
||||
|---|---|---|---|---|---|
| Factor* | Measurement Details | Value† | Hazard Ratio (95% CI) | Value† | Hazard Ratio (95% CI) |
| Demographic | |||||
| Age, y | |||||
| Mean (SD) | 77.8 (5.0) | 77.4 (4.7) | |||
| 70–74 | 182 (32.0) | Reference | 169 (33.3) | Reference | |
| 75–79 | 181 (31.9) | 1.71 (1.27–2.31) | 167 (32.9) | 2.00 (1.44–2.78) | |
| 80–84 | 142 (25.0) | 2.72 (2.00–3.70) | 135 (26.6) | 3.55 (2.55–4.95) | |
| ≥ 85 | 63 (11.1) | 4.96 (3.41–7.21) | 36 (7.1) | 5.69 (3.56–9.08) | |
| Female | 343 (60.4) | 1.43 (1.14–1.81) | 277 (54.6) | 1.22 (0.96–1.56) | |
| Non-Hispanic white | 519 (91.4) | 1.28 (0.85–1.92) | 464 (91.5) | 0.89 (0.59–1.33) | |
| Living with others | 350 (61.6) | 0.65 (0.52–0.81) | 315 (62.1) | 0.73 (0.58–0.93) | |
| Did not complete high school | 171 (30.1) | 1.50 (1.19–1.88) | 124 (24.5) | 1.18 (0.90–1.54) | |
| Health related | |||||
| Chronic conditions, mean (SD) | 9 self-reported, physician diagnosed‡ | 1.6 (1.1) | 1.31 (1.19–1.45) | 1.6 (1.2) | 1.18 (1.07–1.31) |
| Visual impairment | %, assessed with a Jaeger card | ||||
| None or mild | < 6 | 416 (73.2) | Reference | 384 (75.7) | Reference |
| Moderate | 6–26 | 71 (12.5) | 1.28 (0.98–1.68) | 62 (12.3) | 1.74 (1.30–2.33) |
| Severe | > 26 | 81 (14.3) | 1.84 (1.40–2.40) | 61 (12.0) | 1.77 (1.29–2.42) |
| Hearing impairment | Tones missed out of 4§ | ||||
| None or mild | 0–1 | 249 (43.8) | Reference | 224 (44.2) | Reference |
| Moderate | 2–3 | 204 (35.9) | 1.51 (1.12–2.03) | 188 (37.1) | 1.64 (1.20–2.24) |
| Severe | 4 | 115 (20.3) | 2.14 (1.65–2.77) | 95 (18.7) | 2.39 (1.78–3.21) |
| Weight loss | ≥ 10 pounds in past year | 108 (19.0) | 2.00 (1.56–2.56) | 89 (17.6) | 1.96 (1.49–2.57) |
| Cognitive-psychosocial | |||||
| Cognitive impairment | Score on Folstein MMSE < 24 | 54 (9.5) | 2.73 (2.11–3.53) | 34 (6.7) | 2.46 (1.78–3.40) |
| Depressive symptoms | Score on CES-D ≥ 20 | 61 (10.7) | 2.02 (1.55–2.64) | 53 (10.5) | 1.68 (1.24–2.28) |
| Low functional self-efficacy∥ | Score ≤ 27 | 114 (20.1) | 4.43 (3.55–5.53) | 115 (22.7) | 2.79 (2.18–3.57) |
| Low social support∥ | Score on MOS ≤ 18 | 123 (21.7) | 1.27 (0.98–1.65) | 111 (21.9) | 1.33 (1.01–1.74) |
| Behavioral | |||||
| Current smoker | 50 (8.8) | 1.03 (0.66–1.60) | 40 (7.9) | 1.03 (0.62–1.71) | |
| Low physical activity | PASE score < 64 for men and < 52 for women¶ | 119 (21.0) | 3.09 (2.48–3.85) | 106 (20.9) | 3.49 (2.75–4.44) |
| Body mass index# | Self-reported height and weight, kg/m2 | ||||
| Normal or underweight | < 25 | 245 (43.1) | Reference | 191 (37.7) | Reference |
| Overweight | 25–29.9 | 224 (39.4) | 0.74 (0.58–0.94) | 206 (40.6) | 0.72 (0.55–0.94) |
| Obese | > 30 | 99 (17.4) | 0.95 (0.71–1.29) | 110 (21.7) | 0.85 (0.62–1.16) |
| Physical capacity | |||||
| SPPB score** | |||||
| High | 10–12 | 159 (28.0) | Reference | 152 (30.0) | Reference |
| Intermediate | 7–9 | 216 (38.0) | 3.40 (2.02–5.72) | 181 (35.7) | 2.30 (1.40–3.79) |
| Low | < 7 | 193 (34.0) | 11.4 (6.91–18.7) | 174 (34.3) | 6.93 (4.35–11.0) |
| Muscle weakness | |||||
| Hand grip†† | 276 (48.6) | 2.51 (1.96–3.22) | 236 (46.7) | 1.96 (1.51–2.52) | |
| Upper extremity‡‡ | Shoulder flexion < 11.5 (women), < 16.1 (men) | 137 (24.1) | 2.01 (1.58–2.55) | 123 (24.3) | 2.50 (1.91–3.28) |
| Lower extremity‡‡ | Hip abduction < 7.9 (women), < 12.6 (men) | 173 (30.5) | 1.94 (1.53–2.47) | 153 (30.2) | 2.38 (1.80–3.14) |
| Manual dexterity§§, s | 9-hole pegboard test | ||||
| < 21.8 | 115 (20.3) | Reference | 102 (20.1) | Reference | |
| 21.8–24.3 | 126 (22.2) | 1.19 (0.78–1.81) | 113 (22.3) | 2.01 (1.24–3.27) | |
| 24.4–27.5 | 155 (27.3) | 1.92 (1.31–2.80) | 136 (26.8) | 2.46 (1.54–3.93) | |
| ≥ 27.6 | 172 (30.3) | 3.45 (2.43–4.89) | 156 (30.8) | 4.45 (2.85–6.93) | |
| Gross motor coordination§§, s | 10 finger taps as described in the text | ||||
| < 8.8 | 104 (18.3) | Reference | 97 (19.1) | Reference | |
| 8.8–10.3 | 119 (21.0) | 1.49 (1.01–2.20) | 108 (21.3) | 2.09 (1.34–3.26) | |
| 10.4–12.4 | 161 (28.4) | 1.91 (1.32–2.77) | 147 (29.0) | 2.78 (1.82–4.25) | |
| ≥ 12.5 | 184 (32.4) | 3.40 (2.42–4.78) | 156 (30.6) | 4.65 (3.10–6.97) | |
| Low peak flow∥∥ | < 10% standardized residual percentile | 114 (20.1) | 1.96 (1.54–2.51) | 96 (18.9) | 2.07 (1.57–2.72) |
Abbreviations: CES-D, Center for Epidemiological Studies-Depression Scale; MMSE, Mini-Mental State Examination; MOS, Medical Outcomes Study Social Support Scale; SD, standard deviation; SPPB, Short Physical Performance Battery.
Values for candidate risk factors were updated, when applicable, using data from the subsequent comprehensive assessments.
Values are given as number (percentage) unless otherwise indicated. Percentages are based on totals for each factor and may not sum to 100 because of rounding.
Hazard ratios are per one unit increase in the number of chronic conditions, which included hypertension, myocardial infarction, heart failure, stroke, diabetes mellitus, arthritis, hip fracture, chronic lung disease, and cancer (other than minor skin cancers).
Based on 1000 and 2000 HZ measurements for the left and right ears.
Cutpoints demarcate the worst quartile, based on the first 356 enrolled participants who had been selected randomly from the source population.
These gender-specific cut-points denote the worse quintile of scores (34) among the first 356 enrolled participants who had been selected randomly from the source population (28).
Body-mass index was categorized into three groups based on published cut-points, as previously described (35).
Scores demarcated three groups based on previously defined cutpoints (36).
Value less than or equal to the gender- and body mass index-specific cut-points provided by Fried et al. (34).
Assessed with hand-held Chatillon MSE 100 dynamometer; cutpoints (kg) demarcate the worst sex-specific quartile for nondominant limb, based on the first 356 enrolled participants who had been selected randomly from the source population (37).
Because standard cutpoints have not been established, quartile scores were calculated based on the first 356 enrolled participants and subsequently applied to the entire cohort.
Based on previously validated cutpoint (37).
The physical capacity factors included a modified version of the Short Physical Performance Battery (SPPB) (14,36) that included the standard balance maneuvers but substituted three timed chair stands (instead of five) and timed rapid gait instead of timed usual gait (37). The other physical capacity factors included dominant hand grip strength (28), nondominant, upper and lower extremity muscle strength (37), manual dexterity (38), gross motor coordination (38) and peak expiratory flow (39). Additional operational details regarding the candidate risk factors are provided in Table 1.
Potential Precipitants
The potential precipitants included intervening illnesses or injuries leading to either hospitalization or restricted activity (19). During the monthly interviews, participants were asked whether they had stayed at least overnight in a hospital since the last interview. The accuracy of these reports, based on 3,403 monthly interviews and an independent review of hospital records, was high as denoted by a sensitivity of 93.3% (95% confidence interval [CI]: 90.5%–96.1%) and specificity of 99.3% (CI: 99.0%–99.6%). To ascertain less potent intervening events, participants were asked two questions related to restricted activity using a standardized protocol with high reliability, i.e. Kappa = 0.90 (CI: 0.71–1.00) based on 20 pairs of independent assessments, as previously described (19,21). Exposure to the precipitants was classified each month as hospitalization, restricted activity but no hospitalization, referred to hereafter as simply restricted activity, or neither hospitalization or restricted activity.
Community Mobility
Community mobility was defined on the basis of two tasks—walking a quarter mile and driving a car. Each month, participants were asked, “At the present time, do you need help from another person to walk a quarter mile?” Participants who responded “Yes” (or were unable) were considered to be disabled in walking. Participants were also asked, “Have you driven a car during the past month?” Participants who responded “No” were considered to be “disabled” in driving. In two subgroups of participants who were interviewed twice within a 2-day period by different interviewers, the reliability of our assessment for walking one quarter of a mile (n=91) was substantial, with Kappa = 0.72 (CI: 0.57–0.87), and for driving a car (n=98) was almost perfect, with Kappa = 0.98 (0.94–1.0) (40). For both mobility tasks, disability was considered to be long-term if it lasted for six or more consecutive months.
Assembly of Analytic Samples
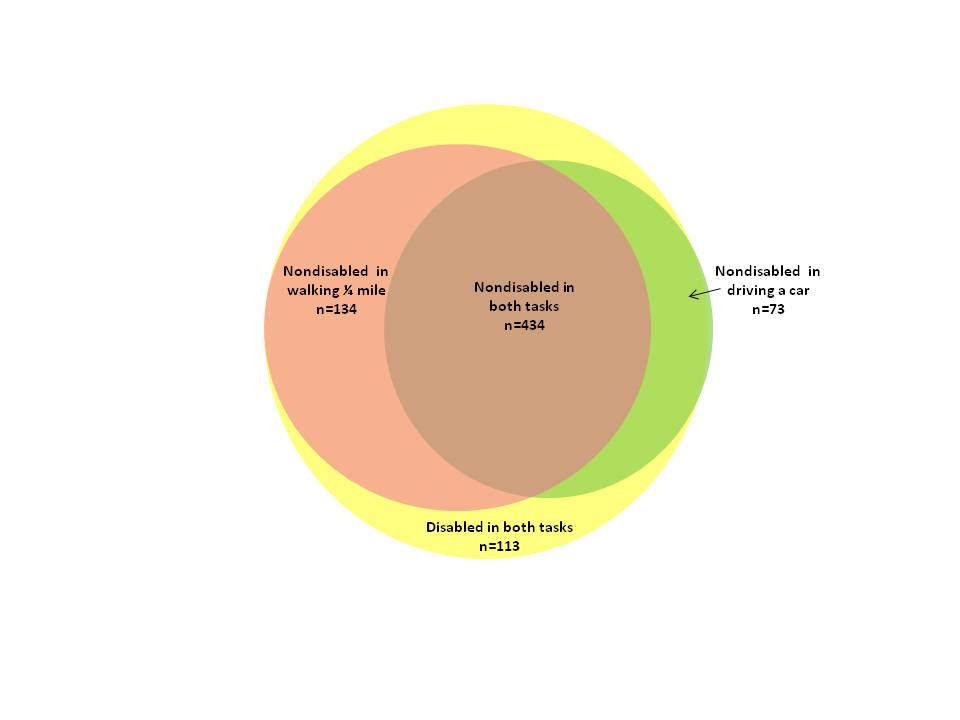
Separate analytic samples were assembled for walking a quarter mile and driving a car. Participants were excluded from the relevant analytic sample if they were (at baseline) disabled in walking a quarter mile (n=186) or not driving a car (n=247). As shown in Appendix Figure 2, 641 participants were included in at least one of the analytic samples, while 434 participants were included in both. We chose not to evaluate community mobility as a composite outcome using a single analytic sample because of reductions in sample size and power and, more importantly, because the timing and rates of long-term disability in the two mobility tasks differed.
Statistical Analysis
The amount of missing data for the candidate risk factors ranged from 0.3% for smoking to 6.8% for peak flow, with the exception of upper and lower extremity muscle strength, for which 10.0% and 9.5% of the observations were missing. To account for the missing risk factor data, we used sequential Markov Chain Monte Carlo imputation for multivariate normal data. Following recommendations for binary longitudinal data (41), we also used multiple imputation to address the small amount of missing monthly data on mobility disability (2.1% and 1.4% of the 69,096 observations for walking one quarter of a mile and driving a car, respectively), as described in an earlier report (42). SAS Proc MI was used for all imputations. Missing data were not imputed for the potential precipitants (0.7% and 1.0% of the observations for hospitalization and restricted activity, respectively).
For each of the two analytic samples, we determined the baseline characteristics of participants using counts (percentages) and means (standard deviations), as indicated. Next, for each sample we calculated exposure rates and 95% confidence intervals for hospitalization and restricted activity per 100 person-months over the entire follow-up period using GEE Poisson models. A first-order autoregression covariance matrix was used to account for the clustering of within-participant observations.
We used Cox proportional hazards models (43) and procedures recommended by Harrell (44) to evaluate the bivariate and multivariable relationships between the candidate risk factors and potential precipitants, respectively, and the time to onset of long-term disability in each of the two mobility tasks. Participants were censored at the time of death or last completed interview. Because the candidate risk factors, other than sex, race/ethnicity and education, could change over time, the bivariate and multivariable models used time-dependent variables, which were updated every 18 months.
To assess the impact of the potential precipitants, we reran the multivariable Cox models after adding hospitalization and restricted activity. As previously described (19), the associated hazard ratios refer to the risk of developing the mobility outcome at month t based on exposure to hospitalization and restricted activity, respectively, during the preceding month (t-1). To ensure temporal precedence, we did not evaluate the effect of potential precipitants that occurred after the initial onset of mobility disability. We estimated shrinkage and tested the proportional hazards assumption for all variables in the final models using the time stratification method (44), and we evaluated the model fit with martingale residuals (45). No a priori interactions were clinically indicated or tested.
To enhance the clinical interpretation of our findings, we calculated the absolute risk difference for the two precipitants and each of the independent risk factors from the final multivariable model by subtracting the conditional probability of developing the relevant mobility outcome with all variables in the final model set to their reference levels from that of developing the outcome with the specific precipitant or risk factor (46). Absolute risk differences were also calculated for each risk factor combined with hospitalization and restricted activity, respectively. For the ordinal risk factors, absolute risk differences were calculated only for the levels that had achieved statistical significance at P < .05 in the final model. Nonparametric 95% confidence intervals were estimated using 1000 bootstrap samples.
All statistical tests were 2-tailed, and P < .05 was considered to indicate statistical significance. All analyses were performed using SAS version 9.2 (SAS Institute, Cary, NC).
RESULTS
The baseline characteristics of participants in the two analytic samples are shown in Table 1. There were relatively few differences between the two samples. Of the 568 participants who were nondisabled in walking a quarter mile at baseline, 103 (18.1%) died without having developed long-term walking disability after a median follow-up of 45 months. Of these, 12, 6, and 4 participants (total = 22 or 21.4%) were disabled in walking a quarter mile immediately prior to their death for 1, 2, and 3 months, respectively. Of the 507 participants who were driving a car at baseline, 98 (19.3%) died without having developed long-term driving disability after a median follow-up of 51.5 months. Of these, 7, 3, and 2 participants (total = 12 or 12.2%) had stopped driving a car immediately prior to their death for 1, 2, and 3 months, respectively.
In the first analytic sample, 318 (56.0%) participants developed long-term disability in walking a quarter mile over a median follow-up of 44 months (intraquartile range [IQR], 23–73). In the second analytic sample, 269 (53.1%) participants developed long-term disability in driving a car over a median follow-up of 54 months (IQR, 29–87). The median durations of these disability episodes were 10.5 months (IQR, 7–20) and 26 months (IQR, 11–49), respectively. For walking a quarter mile, 85 (26.7%) of the long-term disability episodes ended in death, while only 10 (3.1%) were followed by a disability free period lasting at least six months. The corresponding values for driving a car were 115 (42.8%) and 6 (2.2%), respectively.
The bivariate associations of the candidate risk factors with long-term disability in community mobility are provided in Table 1 as hazard ratios accompanied by 95% confidence intervals. For each outcome; the strongest association was observed for the SPPB (particularly score < 7). Other factors that achieved an unadjusted hazard ratio of 3 or higher for at least one of the two mobility outcomes included age, low functional self-efficacy, low physical activity, manual dexterity, and gross motor coordination.
As shown in Table 2, exposure to both hospitalization and restricted activity was considerably greater among participants who developed, than those who did not develop, each of the two mobility outcomes. For each group, exposure to restricted activity was at least three times greater than exposure to hospitalization.
Table 2.
Exposure Rates of Potential Precipitants per 100 Person-Months According to Long-Term Disability in Community Mobility*
| Long-term Disability in Walking a Quarter Mile |
Long-term Disability in Driving a Car |
|||||||||
|---|---|---|---|---|---|---|---|---|---|---|
| Yes (N=318) | No (N=250) | Yes(N=269) | No (N=238) | |||||||
| Potential Precipitant | Rate | 95% CI | Rate | 95% CI | P-Value | Rate | 95% CI | Rate | 95% CI | P-Value |
| Hospitalization | 5.2 | 4.4–6.2 | 3.2 | 2.6–3.9 | <.001 | 5.0 | 4.1–5.9 | 3.4 | 2.8–5.1 | <.001 |
| Restricted activity | 17.8 | 16.2–19.7 | 9.7 | 8.6–11.0 | <.001 | 16.6 | 14.9–18.4 | 11.0 | 9.8–12.4 | <.001 |
For each of the two tasks, the exposure period includes the time to long-term disability or to a censoring event for participants without long-term disability. 95% confidence intervals and P-values were estimated using a GEE Poisson model without adjustment for covariates.
Table 3 provides the multivariable results for the risk factors and precipitants associated with long-term disability in walking a quarter mile and driving a car, respectively. In the final models, seven risk factors were independently associated with walking disability (older age, female sex, chronic conditions, cognitive impairment, low functional self-efficacy, low physical activity, low and intermediate SPPB scores), while eight were independently associated with driving disability (older age, female sex, severe visual impairment, weight loss, cognitive impairment, low physical activity, low SPPB score, higher scores on gross motor coordination). Of these factors, the largest hazard ratios for each outcome were observed for age and SPPB score. The effects of the precipitants on long-term disability in community mobility were large, with multivariable hazard ratios for each outcome greater than 6 for hospitalization and 2.4 for restricted activity.
Table 3.
Risk factors and Precipitants Associated in Multivariable Analysis with Long-Term Disability in Community Mobility
| Walking a Quarter Mile (n=568) |
Driving a Car (n=507) |
|||
|---|---|---|---|---|
| Hazard Ratio | 95% CI | Hazard Ratio | 95% CI | |
| Risk factors* | ||||
| Age | ||||
| 70–74 | ref | ref | ||
| 75–79 | 1.45 | 1.07–1.97 | 1.70 | 1.22–2.38 |
| 80–84 | 1.61 | 1.17–2.23 | 2.79 | 1.95–4.0 |
| ≥ 85 | 2.41 | 1.61–3.62 | 4.36 | 2.57–7.41 |
| Female | 1.68 | 1.31–2.16 | 1.86 | 1.41–2.46 |
| Non-Hispanic white | 1.46 | 0.95–2.23 | ||
| Living with others | 1.26 | 0.97–1.64 | ||
| Chronic conditions† | 1.19 | 1.08–1.32 | 1.07 | 0.97–1.19 |
| Visual impairment | ||||
| None or mild | ref | |||
| Moderate | 1.17 | 0.85–1.62 | ||
| Severe | 1.53 | 1.12–2.10 | ||
| Weight loss | 1.30 | 1.00–1.69 | 1.56 | 1.17–2.07 |
| Cognitive impairment | 1.58 | 1.20–2.08 | 1.67 | 1.16–2.41 |
| Low functional self-efficacy | 1.84 | 1.42–2.38 | ||
| Low physical activity | 1.42 | 1.11–1.83 | 1.86 | 1.42–2.42 |
| SPPB score | ||||
| High | ref | ref | ||
| Intermediate | 2.50 | 1.46–4.30 | 1.35 | 0.81–2.26 |
| Low | 4.51 | 2.62–7.79 | 2.20 | 1.32–3.68 |
| Hand grip weakness | 1.27 | 0.98–1.66 | ||
| Lower extremity weakness | 1.33 | 0.98–1.80 | ||
| Gross motor coordination | ||||
| ≤ 8.7 | ref | |||
| 8.8–10.3 | 1.60 | 1.01–2.52 | ||
| 10.4–12.4 | 1.62 | 1.04–2.53 | ||
| ≥ 12.5 | 1.92 | 1.23–3.0 | ||
| Low peak flow | 1.32 | 0.98–1.77 | ||
| Precipitants | ||||
| Hospitalization | 6.21 | 4.50–8.56 | 6.99 | 5.02–9.73 |
| Restricted activity | 2.44 | 1.84–3.22 | 2.52 | 1.87–3.41 |
Abbreviation: CI, confidence interval; ref, reference group.
Only risk factors with P-values < .10 in the model without precipitants were retained.
Hazard ratios are per one unit increase in the number of chronic conditions.
The absolute risk differences for long-term disability in walking a quarter mile and driving a car are shown in Figures 1 and 2, respectively. In the absence of a precipitant, the absolute risk differences for the independent risk factors ranged from 0.7% (for each additional chronic condition) to 12.0% (for low SPPB score) for walking disability, and from 2.1% (for severe visual impairment) to 12.6% (for age ≥ 85) for driving disability. For both outcomes, the absolute risk difference was considerably greater for hospitalization (top of figures) than for the risk factors, and was also greater for restricted activity than for most of the risk factors. The largest differences in absolute risk were generally observed for participants who had a specific risk factor and were subsequently hospitalized. For example, in the setting of a hospitalization, the absolute risk difference for long-term disability in walking a quarter mile was 61.6% among participants who had a low SPPB score, while the absolute risk difference for long-term disability in driving a car was 67.9% among participants who were 85 years or older. For each of the risk factors, differences in absolute risk were intermediate for participants who experienced restricted activity, as compared with those who were hospitalized or not exposed to either precipitant. Nonetheless, when combined with a low SPPB score for walking and age 85 or older for driving, restricted activity yielded absolute risk differences that were comparable to those for hospitalization when combined with several of the other risk factors.
Figure 1.

Absolute risk differences for precipitants and risk factors independently associated with long-term disability in walking a quarter mile. Values for the risk factors are provided according to the absence or presence of the two precipitants. Point estimates are accompanied by nonparametric 95% confidence intervals. The absolute risk difference represents the absolute risk of developing the outcome when the risk factor is present minus the base risk, which is the average probability of developing the outcome when all of the risk factors and precipitants in the final multivariable model are set to their reference level, namely no precipitant, age 70–74 years, male sex, no chronic conditions, MMSE score ≥ 24, functional self-efficacy score > 27, PASE score ≥ 64 for men and ≥ 52 for women, and SPPB score ≥ 10. The base risk for long-term walking disability is 3.7%. For the ordinal risk factors, absolute risk differences are provided only for the levels that had achieved statistical significance at P < .05 in the final model.
Figure 2.

Absolute risk differences for precipitants and risk factors independently associated with long-term disability in driving a car. Values for the risk factors are provided according to the absence or presence of the two precipitants. Point estimates are accompanied by nonparametric 95% confidence intervals. The absolute risk difference represents the absolute risk of developing the outcome when the risk factor is present minus the base risk, which is the average probability of developing the outcome when all of the risk factors and precipitants in the final multivariable model are set to their reference level, namely no precipitant, age 70–74 years, male sex, mild or no visual impairment, no significant weight loss, MMSE score ≥ 24, PASE score ≥ 64 for men and ≥ 52 for women, SPPB score ≥ 10, and gross motor coordination time < 8.8 seconds. The base risk for long-term driving disability is 4.1%. For the ordinal risk factors, absolute risk differences are provided only for the levels that had achieved statistical significance at P < .05 in the final model.
DISCUSSION
In this prospective study of older persons, we evaluated potential risk factors and precipitants of long-term disability in community mobility. Six major findings warrant comment. First, over the course of nearly 12 years, more than half of the participants, who had been previously nondisabled, developed long-term disability in walking a quarter mile and driving a car, respectively. Second, older age and lower scores on the SPPB were the risk factors most strongly associated with long-term disability in both mobility tasks. Third, many other risk factors were independently associated with long-term disability in community mobility, including several that are potentially modifiable. Fourth, the magnitude of association with both mobility outcomes was considerably greater for the precipitants, especially hospitalization, than for the risk factors. Fifth, the associations between the risk factors and precipitants and subsequent long-term disability differed only modestly between walking and driving. Sixth, with few exceptions the probability of developing the two mobility outcomes was highest for persons who had a specific risk factor and were subsequently hospitalized. By enhancing our understanding of community mobility, these findings will help to identify older persons at high risk for long-term mobility disability, and they suggest potential targets for interventions to maintain independent mobility in the community.
Preserving community ambulation is central to maintaining a high quality of life, including retention of many activities that are needed to be fully independent and engaged in the community. Such activities include shopping and walking across a parking lot, to the bus stop, and around a neighborhood (47). In addition, loss of community ambulation is associated with multiple adverse outcomes, including worsening disability and morbidity, increases in health care utilization and costs, institutionalization, and death (1,2,5,16,48). In the current study, community mobility included not only walking a quarter mile, but also driving a car. The adverse consequences of disability in these two mobility tasks are comparable (4); and this broadened focus is consistent with efforts by other investigators to assess life-space mobility (49,50).
Our findings support the supposition that long-term disability in community mobility arises from a combination of predisposing factors, which make one vulnerable, and intervening illnesses or injuries, which act as precipitants. Three of the predisposing factors—cognitive impairment, low physical activity, and poor physical performance, as assessed by the SPPB—were independently associated with long-term disability in both mobility tasks and are potentially modifiable through an array of interventions (51–53). Given their high incidence and strong associations with long-term disability in community mobility, the precipitants offer an attractive and complementary target for intervention. As previously reported (19,21), several of the most common intervening events, including falls, heart failure, myocardial infarction, stroke, and arthritis, are preventable (54,55) or amenable to aggressive in-hospital management (56,57), restorative interventions posthospitalization (58), or self-management and exercise (59,60). Because older persons with SPPB scores less than 7 are at such high risk for developing long-term disability, they represent a logical, and clinically feasible (61,62), target group for preventive interventions.
Our study is unique in that it focused on long-term disability in community mobility, defined as disability lasting for six or more months. The validity of this operational definition is supported by the low rate of sustained recovery, which ranged from only 2.2% for driving to 3.1% for walking. In contrast, recovery rates for shorter episodes of mobility disability are much higher (6). A comprehensive review of the literature from 2000 to July 2011 revealed no comparable studies of long-term disability in community mobility. Our study complements prior research showing that serious intervening events, such as stroke and hip fracture, are more strongly associated with catastrophic versus progressive mobility disability (63). In contrast to this prior study, however, intervening events in the current study were ascertained every month, allowing us to establish temporal precedence and, hence, strengthen a potential causal association with long-term mobility disability.
Our study has several additional strengths, including the long duration of follow-up and low rate of attrition for reasons other than death. Data were available on a large array of potential risk factors across multiple domains. Reassessing these factors at 18-month intervals enhances the likelihood that they accurately reflected the status of participants before the onset of the mobility disability. The validity of our results is further strengthened by the nearly complete ascertainment of intervening events and mobility disability and by the high reliability and accuracy of these assessments.
Nonetheless, our results should be interpreted in the context of several limitations. First, because this was an observational study, the reported associations cannot be construed as causal relationships. Second, information was not available on the severity of the illnesses or injuries leading to hospitalization, on hospital-acquired complications, or on length of stay or posthospital course. Third, it was not possible to distinguish emergent hospitalizations from admissions that were designed to be restorative, e.g. total hip replacement for severe osteoarthritis. Fourth, the effect of the intervening events may have been underestimated since their exposure after the initial onset of mobility disability was not evaluated. Fifth, data were available on global cognition, but not on speed of processing, a known risk factor for driving cessation (18). Sixth, despite their potential importance to community mobility, information was not available on environmental factors, such as traffic patterns and the presence of sidewalks (7). Seventh, the absolute risk differences represent conditional rather than marginal probabilities, leading to comparison groups that had the lowest possible risk of mobility disability. Because the risk factors and precipitants were time varying, it was not possible to calculate marginal probabilities. Finally, because our study participants were members of a single health plan in a small urban area and were oversampled for slow gait speed, our results may not be generalizable to older persons in other settings. However, the demographic characteristics of our cohort reflect those of older persons in New Haven County, Connecticut, which are similar to the characteristics of the U.S. population as a whole, with the exception of race or ethnic group (64). The generalizability of our results is enhanced by our high participation rate, which was greater than 75%.
In summary, long-term disability in community mobility, including walking a quarter mile and driving a car, is common among older persons. Multiple risk factors, together with subsequent precipitants, greatly increase the likelihood of developing long-term mobility disability. Since few older persons recover from long-term disability, strategies to prevent the initial onset and persistence of community mobility disability are needed.
Supplementary Material
Assembly of study cohort. Persons who were physically frail were oversampled as described in detail elsewhere (21). After the prespecified number of nonfrail participants were enrolled, potential participants were excluded if they had a low likelihood of physical frailty based on the telephone screen and, subsequently, if they were found not to be physically frail during the in-home assessment.
Participants in the two analytic samples. The first analytic sample included 568 participants who were nondisabled in walking a quarter mile at baseline, while the second analytic included 507 participants who were driving a car at baseline. Of the 754 PEP participants, 434 (57.6%) were included in both analytic samples, while 113 (15.0%) were included in neither.
Acknowledgments
We thank Denise Shepard, BSN, MBA, Andrea Benjamin, BSN, Barbara Foster, and Amy Shelton, MPH for assistance with data collection; Wanda Carr and Geraldine Hawthorne, BS, for assistance with data entry and management; Linda Leo-Summers, MPH for assistance with the Figures; Peter Charpentier, MPH for design and development of the study database and participant tracking system; and Joanne McGloin, MDiv, MBA for leadership and advice as the Project Director.
Funding/Support: The work for this report was supported by a grant from the National Institute on Aging (R37AG17560). The study was conducted at the Yale Claude D. Pepper Older Americans Independence Center (P30AG21342). Dr. Gill is the recipient of a Midcareer Investigator Award in Patient-Oriented Research (K24AG021507) from the National Institute on Aging.
REFERENCES
- 1.Fried LP, Guralnik JM. Disability in older adults: evidence regarding significance, etiology, and risk. J Am Geriatr Soc. 1997;45:92–100. doi: 10.1111/j.1532-5415.1997.tb00986.x. [DOI] [PubMed] [Google Scholar]
- 2.Iezzoni LI, editor. When walking fails: mobility problems of adults with chronic conditions. University of California Press; Berkeley, CA: 2003. [Google Scholar]
- 3.Bruce ML. Depression and disability in late life: directions for future research. Am J Geriatr Psych. 2001;9:102–12. [PubMed] [Google Scholar]
- 4.Edwards JD, Lunsman M, Perkins M, Rebok GW, Roth DL. Driving cessation and health trajectories in older adults. J Gerontol A Biol Sci Med Sci. 2009;64:1290–5. doi: 10.1093/gerona/glp114. [DOI] [PMC free article] [PubMed] [Google Scholar]
- 5.Hardy SE, Kang Y, Studenski SA, Degenholtz HB. Ability to walk 1/4 mile predicts subsequent disability, mortality, and health care costs. J Gen Intern Med. 2011;26:130–5. doi: 10.1007/s11606-010-1543-2. [DOI] [PMC free article] [PubMed] [Google Scholar]
- 6.Gill TM, Allore HG, Hardy SE, Guo Z. The dynamic nature of mobility disability in older persons. J Am Geriatr Soc. 2006;54:248–54. doi: 10.1111/j.1532-5415.2005.00586.x. [DOI] [PubMed] [Google Scholar]
- 7.Webber SC, Porter MM, Menec VH. Mobility in older adults: a comprehensive framework. Gerontologist. 2010;50:443–50. doi: 10.1093/geront/gnq013. [DOI] [PubMed] [Google Scholar]
- 8.Guralnik JM, LaCroix AZ, Abbott RD, Berkman LF, Satterfield S, Evans DA, Wallace RB. Maintaining mobility in late life. I. Demographic characteristics and chronic conditions. Am J Epidemiol. 1993;137:845–57. doi: 10.1093/oxfordjournals.aje.a116746. [DOI] [PubMed] [Google Scholar]
- 9.LaCroix AZ, Guralnik JM, Berkman LF, Wallace RB, Satterfield S. Maintaining mobility in late life. II. Smoking, alcohol consumption, physical activity, and body mass index. Am J Epidemiol. 1993;137:858–69. doi: 10.1093/oxfordjournals.aje.a116747. [DOI] [PubMed] [Google Scholar]
- 10.Clark DO, Stump TE, Hui SL. Predictors of mobility and basic ADL difficulty among adults aged 70 years and older. J Aging Health. 1998;10:422–40. doi: 10.1177/089826439801000402. [DOI] [PubMed] [Google Scholar]
- 11.Rantanen T, Guralnik JM, Ferrucci L, Penninx BW, Leveille S, Sipila S, Fried LP. Coimpairments as predictors of severe walking disability in older women. J Am Geriatr Soc. 2001;49:21–7. doi: 10.1046/j.1532-5415.2001.49005.x. [DOI] [PubMed] [Google Scholar]
- 12.Launer LJ, Harris T, Rumpel C, Madans J. Body mass index, weight change, and risk of mobility disability in middle-aged and older women. The epidemiologic follow-up study of NHANES I. JAMA. 1994;271:1093–8. [PubMed] [Google Scholar]
- 13.Ho SC, Woo J, Yuen YK, Sham A, Chan SG. Predictors of mobility decline: the Hong Kong oldold study. J Gerontol Med Sci. 1997;52A:M356–62. doi: 10.1093/gerona/52a.6.m356. [DOI] [PubMed] [Google Scholar]
- 14.Guralnik JM, Ferrucci L, Simonsick EM, Salive ME, Wallace RB. Lower-extremity function in persons over the age of 70 years as a predictor of subsequent disability. N Engl J Med. 1995;332:556–61. doi: 10.1056/NEJM199503023320902. [DOI] [PMC free article] [PubMed] [Google Scholar]
- 15.Chaves PH, Garrett ES, Fried LP. Predicting the risk of mobility difficulty in older women with screening nomograms: the Women's Health and Aging Study II. Arch Intern Med. 2000;160:2525–33. doi: 10.1001/archinte.160.16.2525. [DOI] [PubMed] [Google Scholar]
- 16.Newman AB, Simonsick EM, Naydeck BL, Boudreau RM, Kritchevsky SB, Nevitt MC, et al. Association of long-distance corridor walk performance with mortality, cardiovascular disease, mobility limitation, and disability. JAMA. 2006;295:2018–26. doi: 10.1001/jama.295.17.2018. [DOI] [PubMed] [Google Scholar]
- 17.Marottoli RA. The assessment of older drivers. In: Hazzard WR, Blass JP, Ettinger WH, Halter JB, Ouslander JG, editors. Principles of Geriatric Medicine and Gerontology. 4th ed. McGraw-Hill; New York, NY: 1999. pp. 267–74. [Google Scholar]
- 18.Edwards JD, Ross LA, Ackerman ML, Small BJ, Ball KK, Bradley S, Dodson JE. Longitudinal predictors of driving cessation among older adults from the ACTIVE clinical trial. J Gerontol B Psychol Sci Soc Sci. 2008;63:P6–12. doi: 10.1093/geronb/63.1.p6. [DOI] [PubMed] [Google Scholar]
- 19.Gill TM, Allore HG, Holford TR, Guo Z. Hospitalization, restricted activity, and the development of disability among older persons. JAMA. 2004;292:2115–24. doi: 10.1001/jama.292.17.2115. [DOI] [PubMed] [Google Scholar]
- 20.Gill TM, Gahbauer EA, Han L, Allore HG. The relationship between intervening hospitalizations and transitions between frailty states. J Gerontol Med Sci. doi: 10.1093/gerona/glr142. in press. [DOI] [PMC free article] [PubMed] [Google Scholar]
- 21.Gill TM, Desai MM, Gahbauer EA, Holford TR, Williams CS. Restricted activity among community-living older persons: incidence, precipitants, and health care utilization. Ann Intern Med. 2001;135:313–21. doi: 10.7326/0003-4819-135-5-200109040-00007. [DOI] [PubMed] [Google Scholar]
- 22.Gill TM, Hardy SE, Williams CS. Underestimation of disability among community-living older persons. J Am Geriatr Soc. 2002;50:1492–7. doi: 10.1046/j.1532-5415.2002.50403.x. [DOI] [PubMed] [Google Scholar]
- 23.Hardy SE, Gill TM. Recovery from disability among community-dwelling older persons. JAMA. 2004;291:1596–602. doi: 10.1001/jama.291.13.1596. [DOI] [PubMed] [Google Scholar]
- 24.Gill TM, Williams CS, Tinetti ME. Assessing risk for the onset of functional dependence among older adults: the role of physical performance. J Am Geriatr Soc. 1995;43:603–9. doi: 10.1111/j.1532-5415.1995.tb07192.x. [DOI] [PubMed] [Google Scholar]
- 25.Stuck AE, Walthert JM, Nikolaus T, Bula CJ, Hohmann C, Beck JC. Risk factors for functional status decline in community-living elderly people: a systematic literature review. Soc Sci Med. 1999;48:445–69. doi: 10.1016/s0277-9536(98)00370-0. [DOI] [PubMed] [Google Scholar]
- 26.Spaeth EB, Fralick FB, Hughes WF. Estimates of loss of visual efficiency. Arch Ophthalmol. 1955;54:462–8. doi: 10.1001/archopht.1955.00930020468021. [DOI] [PubMed] [Google Scholar]
- 27.Lichtenstein MJ, Bess FH, Logan SA. Validation of screening tools for identifying hearing-impaired elderly in primary care. JAMA. 1988;259:2875–8. [PubMed] [Google Scholar]
- 28.Gill TM, Gahbauer EA, Allore HG, Han L. Transitions between frailty states among community-living older persons. Arch Intern Med. 2006;166:418–23. doi: 10.1001/archinte.166.4.418. [DOI] [PubMed] [Google Scholar]
- 29.Folstein MF, Folstein SE, McHugh PR. “Mini-mental state.” A practical method for grading the cognitive state of patients for the clinician. J Psychiatr Res. 1975;12:189–98. doi: 10.1016/0022-3956(75)90026-6. [DOI] [PubMed] [Google Scholar]
- 30.Kohout FJ, Berkman LF, Evans DA, Cornoni-Huntley J. Two shorter forms of the CES-D Depression Symptoms Index. J Aging Health. 1993;5:179–93. doi: 10.1177/089826439300500202. [DOI] [PubMed] [Google Scholar]
- 31.Reid MC, Williams CS, Gill TM. The relationship between psychological factors and disabling musculoskeletal pain in community-dwelling older persons. J Am Geriatr Soc. 2003;51:1092–8. doi: 10.1046/j.1532-5415.2003.51357.x. [DOI] [PubMed] [Google Scholar]
- 32.Hardy SE, Gill TM. Factors associated with recovery of independence among newly disabled older persons. Arch Intern Med. 2005;165:106–12. doi: 10.1001/archinte.165.1.106. [DOI] [PubMed] [Google Scholar]
- 33.Washburn RA, McAuley E, Katula J, Mihalko SL, Boileau RA. The physical activity scale for the elderly (PASE): evidence for validity. J Clin Epidemiol. 1999;52:643–51. doi: 10.1016/s0895-4356(99)00049-9. [DOI] [PubMed] [Google Scholar]
- 34.Fried LP, Tangen CM, Walston J, Newman AB, Hirsch C, Gottdiener J, et al. Frailty in older adults: evidence for a phenotype. J Gerontol Med Sci. 2001;56A:M146–56. doi: 10.1093/gerona/56.3.m146. [DOI] [PubMed] [Google Scholar]
- 35.Gill TM, Allore HG, Han L. Bathing disability and the risk of long-term admission to a nursing home. J Gerontol A Biol Sci Med Sci. 2006;61:821–5. doi: 10.1093/gerona/61.8.821. [DOI] [PubMed] [Google Scholar]
- 36.Guralnik JM, Ferrucci L, Pieper CF, Leveille SG, Markides KS, Ostir GV, et al. Lower extremity function and subsequent disability: consistency across studies, predictive models, and value of gait speed alone compared with the short physical performance battery. J Gerontol Med Sci. 2000;55A:M221–31. doi: 10.1093/gerona/55.4.m221. [DOI] [PubMed] [Google Scholar]
- 37.Gill TM, Murphy TE, Barry LC, Allore HG. Risk factors for disability subtypes in older persons. J Am Geriatr Soc. 2009;57:1850–5. doi: 10.1111/j.1532-5415.2009.02443.x. [DOI] [PMC free article] [PubMed] [Google Scholar]
- 38.Gill TM, Han L, Allore HG. Predisposing factors and precipitants for bathing disability in older persons. J Am Geriatr Soc. 2007;55:534–40. doi: 10.1111/j.1532-5415.2007.01099.x. [DOI] [PubMed] [Google Scholar]
- 39.Vaz Fragoso CA, Gahbauer EA, Van Ness PH, Concato J, Gill TM. Peak expiratory flow as a predictor of subsequent disability and death in community-living older persons. J Am Geriatr Soc. 2008;56:1014–20. doi: 10.1111/j.1532-5415.2008.01687.x. [DOI] [PMC free article] [PubMed] [Google Scholar]
- 40.Landis JR, Koch GG. The measurement of observer agreement for categorical data. Biometrics. 1977;33:159–74. [PubMed] [Google Scholar]
- 41.Wang M, Fitzmaurice GM. A simple imputation method for longitudinal studies with non-ignorable non-responses. Biometrical J. 2006;48:302–18. doi: 10.1002/bimj.200510188. [DOI] [PubMed] [Google Scholar]
- 42.Gill TM, Guo Z, Allore HG. Subtypes of disability in older persons over the course of nearly 8 years. J Am Geriatr Soc. 2008;56:436–43. doi: 10.1111/j.1532-5415.2007.01603.x. [DOI] [PMC free article] [PubMed] [Google Scholar]
- 43.Hosmer DWJ, Lemeshow S, editors. Regression modeling of time to event data. John Wiley & Sons, Inc.; New York, NY: 1999. Applied survival analysis. [Google Scholar]
- 44.Harrell FE. Regression modeling strategies: with applications to linear models, logistic regression, and survival analysis. Springer; New York: 2001. Multivariable modeling strategies; p. 568. [Google Scholar]
- 45.Lin DY, Wei LJ, Ying Z. Checking the Cox model with cumulative sums of martingale-based residuals. Biometrika. 1993;80:557–72. [Google Scholar]
- 46.Benichou J, Gail MH. Estimates of absolute cause-specific risk in cohort studies. Biometrics. 1990;46:813–826. [PubMed] [Google Scholar]
- 47.Shumway-Cook A, Patla A, Stewart A, Ferrucci L, Ciol MA, Guralnik JM. Environmental components of mobility disability in community-living older persons. J Am Geriatr Soc. 2003;51:393–8. doi: 10.1046/j.1532-5415.2003.51114.x. [DOI] [PubMed] [Google Scholar]
- 48.Corti MC, Guralnik JM, Salive ME, Sorkin JD. Serum albumin level and physical disability as predictors of mortality in older persons. JAMA. 1994;272:1036–42. [PubMed] [Google Scholar]
- 49.Baker PS, Bodner EV, Allman RM. Measuring life-space mobility in community-dwelling older adults. J Am Geriatr Soc. 2003;51:1610–4. doi: 10.1046/j.1532-5415.2003.51512.x. [DOI] [PubMed] [Google Scholar]
- 50.Brown CJ, Roth DL, Allman RM, Sawyer P, Ritchie CS, Roseman JM. Trajectories of life-space mobility after hospitalization. Ann Intern Med. 2009;150:372–8. doi: 10.7326/0003-4819-150-6-200903170-00005. [DOI] [PMC free article] [PubMed] [Google Scholar]
- 51.Daniels R, Metzelthin S, van Rossum E, de Witte L, van den Heuvel W. Interventions to prevent disability in frail community-dwelling older persons: an overview. Eur J Ageing. 2010;7:37–55. doi: 10.1007/s10433-010-0141-9. [DOI] [PMC free article] [PubMed] [Google Scholar]
- 52.Daviglus ML, Bell CC, Berrettini W, Bowen PE, Connolly ES, Jr, Cox NJ, et al. National Institutes of Health State-of-the-Science Conference statement: preventing alzheimer disease and cognitive decline. Ann Intern Med. 2010;153:176–81. doi: 10.7326/0003-4819-153-3-201008030-00260. [DOI] [PubMed] [Google Scholar]
- 53.LIFE Study Investigators. Pahor M, Blair SN, Espeland M, Fielding R, Gill TM, et al. Effects of a physical activity intervention on measures of physical performance: Results of the lifestyle interventions and independence for Elders Pilot (LIFE-P) study. J Gerontol A Biol Sci Med Sci. 2006;61:1157–65. doi: 10.1093/gerona/61.11.1157. [DOI] [PubMed] [Google Scholar]
- 54.Tinetti ME. Clinical practice. Preventing falls in elderly persons. N Engl J Med. 2003;348:42–9. doi: 10.1056/NEJMcp020719. [DOI] [PubMed] [Google Scholar]
- 55.Straus SE, Majumdar SR, McAlister FA. New evidence for stroke prevention: clinical applications. JAMA. 2002;288:1396–8. doi: 10.1001/jama.288.11.1396. [DOI] [PubMed] [Google Scholar]
- 56.Rich MW. Heart failure in the 21st century: a cardiogeriatric syndrome. J Gerontol Med Sci. 2001;56A:M88–96. doi: 10.1093/gerona/56.2.m88. [DOI] [PubMed] [Google Scholar]
- 57.Landefeld CS, Palmer RM, Kresevic DM, Fortinsky RH, Kowal J. A randomized trial of care in a hospital medical unit especially designed to improve the functional outcomes of acutely ill older patients. N Engl J Med. 1995;332:1338–44. doi: 10.1056/NEJM199505183322006. [DOI] [PubMed] [Google Scholar]
- 58.Tinetti ME, Baker D, Gallo WT, Nanda A, Charpentier P, O'Leary J. Evaluation of restorative care vs usual care for older adults receiving an acute episode of home care. JAMA. 2002;287:2098–105. doi: 10.1001/jama.287.16.2098. [DOI] [PubMed] [Google Scholar]
- 59.Bodenheimer T, Lorig K, Holman H, Grumbach K. Patient self-management of chronic disease in primary care. JAMA. 2002;288:2469–75. doi: 10.1001/jama.288.19.2469. [DOI] [PubMed] [Google Scholar]
- 60.Ettinger WH, Jr, Burns R, Messier SP, Applegate W, Rejeski WJ, Morgan T, et al. A randomized trial comparing aerobic exercise and resistance exercise with a health education program in older adults with knee osteoarthritis. The Fitness Arthritis and Seniors Trial (FAST) JAMA. 1997;277:25–31. [PubMed] [Google Scholar]
- 61.Katula JA, Kritchevsky SB, Guralnik JM, Glynn NW, Pruitt L, Wallace K, et al. Lifestyle Interventions and Independence for Elders pilot study: recruitment and baseline characteristics. J Am Geriatr Soc. 2007;55:674–83. doi: 10.1111/j.1532-5415.2007.01136.x. [DOI] [PubMed] [Google Scholar]
- 62.Studenski S, Perera S, Wallace D, Chandler JM, Duncan PW, Rooney E, et al. Physical performance measures in the clinical setting. J Am Geriatr Soc. 2003;51:314–22. doi: 10.1046/j.1532-5415.2003.51104.x. [DOI] [PubMed] [Google Scholar]
- 63.Guralnik JM, Ferrucci L, Balfour JL, Volpato S, Di Iorio A. Progressive versus catastrophic loss of the ability to walk: Implications for the prevention of mobility loss. J Am Geriatr Soc. 2001;49:1463–70. doi: 10.1046/j.1532-5415.2001.4911238.x. [DOI] [PubMed] [Google Scholar]
- 64. [Accessed May 29, 2003];American FactFinder. U.S. Census Bureau. Available at: http://factfinder.census.gov.
Associated Data
This section collects any data citations, data availability statements, or supplementary materials included in this article.
Supplementary Materials
Assembly of study cohort. Persons who were physically frail were oversampled as described in detail elsewhere (21). After the prespecified number of nonfrail participants were enrolled, potential participants were excluded if they had a low likelihood of physical frailty based on the telephone screen and, subsequently, if they were found not to be physically frail during the in-home assessment.
Participants in the two analytic samples. The first analytic sample included 568 participants who were nondisabled in walking a quarter mile at baseline, while the second analytic included 507 participants who were driving a car at baseline. Of the 754 PEP participants, 434 (57.6%) were included in both analytic samples, while 113 (15.0%) were included in neither.