

Abstract
Chronic inflammation is an underlying risk factor for colon cancer. Tumor necrosis factor alpha (TNF-α) plays a critical role in the development of inflammation-induced colon cancer in a mouse model. S-adenosylmethionine (SAMe) and its metabolite methylthioadenosine (MTA) can inhibit lipopolysaccharide-induced TNF-α expression in macrophages. The aim of this work was to examine whether SAMe and MTA are effective in preventing inflammation-induced colon cancer and if so identify signaling pathways affected. Balb/c mice were treated with azoxymethane (AOM) and dextran sulfate sodium to induce colon cancer. Two days after AOM treatment, mice were divided into three groups: vehicle control, SAMe or MTA. Tumor load, histology, immunohistochemistry, gene and protein expression were determined. SAMe and MTA treatment reduced tumor load by ∼40%. Both treatments raised SAMe and MTA levels but MTA also raised S-adenosylhomocysteine levels. MTA treatment prevented the induction of many genes known to play pathogenetic roles in this model except for TNF-α and inducible nitric oxide synthase (iNOS). SAMe also had no effect on TNF-α or iNOS and was less inhibitory than MTA on the other genes. In vivo, both treatments induced apoptosis but inhibited proliferation, β-catenin, nuclear factor kappa B activation and interleukin (IL) 6 signaling. Effect of SAMe and MTA on IL-6 signaling was examined using Colo 205 colon cancer cells. In these cells, SAMe and MTA inhibited IL-6-induced IL-10 expression. MTA also inhibited IL-10 transcription and signal transducer and activator of transcription 3 activation. In conclusion, SAMe and MTA reduced inflammation-induced colon cancer and inhibited several pathways important in colon carcinogenesis.
Introduction
Colon cancer is currently the fourth most common form of cancer but is third in cancer-associated deaths in USA (1). In 2011, it is projected that >150 000 new colon cancer cases will arise and nearly 50 000 will die in USA (1). Colon cancer can arise from several factors, including genetic predisposition and chronic inflammation. Chronic colonic inflammation is a hallmark of inflammatory bowel disease (IBD). IBD patients have a 4- to 20-fold increased risk of developing colon carcinoma as compared with the general population (2). Twenty percent of all IBD patients will develop colon cancer within 30 years after detection and with a >50% mortality rate (3). Colitis-associated cancer (CAC) accounts for 1–2% of all colorectal cancer cases (4).
A major player in the progression of IBD and inflammation-induced colon cancer is the upregulation of pro-inflammatory cytokines such as tumor necrosis factor alpha (TNF-α), interleukin (IL) 6 and IL-1β (IL-1β) by myeloid cells (5). Prolonged inflammation via the activated pro-inflammatory cells leads to oxidative stress, which can induce DNA damage and mutations (5). These cytokines also help promote tumor progression by providing pro-growth signals, promote proliferation and increase the expression of anti-apoptotic factors to the colonic epithelial cells (5). Both TNF-α and IL-1β can upregulate the expression of cyclooxygenase 2 (COX2), inducible nitric oxide synthase (iNOS) and IL-6 (5). IL-1β can induce c-Jun-N-terminal kinase, nuclear factor kappa B (NFκB) and extracellular signal-regulated kinase activation (6). TNF-α can promote the activation of activator protein-1, NFκB and mitogen-activated protein kinase (5). The actions of TNF-α and IL-1β are mediated by NFκB, a transcription factor that plays a major role in growth, proliferation, survival, cell invasion and metastasis, all of which contribute to tumorigenesis (5). In mouse models of CAC, NFκB activity is first initiated in the non-lymphoid myeloid cells to help promote increased cytokine production and pro-growth signals (7). This signal is maintained later on by the pro-inflammatory T cells to produce more pro-growth and pro-inflammatory cytokines for the colonic enterocytes (7). In the colonic epithelium, NFκB is constitutively active, thus leading to anti-apoptosis, enhanced growth and angiogenesis (5). Colon cancer cells that have constitutive active NFκB are more resistant to chemotherapy and radiotherapy (5). NFκB can also elevate the expression of several pro-inflammatory cytokines such as TNF-α, IL-1β and IL-6 (5). IL-6 is a cytokine that promotes T cell survival, myeloid cell recruitment, influences cell survival and growth and influences extracellular signal-regulated kinase and AKT activity (5). IL-6 causes the activation of signal transducer and activator of transcription 3 (STAT3), which promotes survival and growth (5). STAT3 has been shown to help maintain constitutive NFκB activation in colon cancer cells (8). A recent study demonstrated that the TNF-α blocker etaner-cept reduced the number of colon tumors in an experimental colitis-induced colon cancer mouse model (9).
S-adenosylmethionine (SAMe) is an important and naturally occurring biomolecule found in all mammalian cells (10). SAMe is the primary methyl donor for all transmethylation reactions and vital for polyamine synthesis (10). Both SAMe and its metabolite 5-methylthioadenosine (MTA) can reduce pro-growth signals. SAMe and MTA can abrogate leptin signaling in HepG2 liver cancer cells by reducing extracellular signal-regulated kinase and phosphoinositide 3-kinase/AKT signaling (11). SAMe and MTA can also reduce the mitogenic effects of insulin-like growth factor-1, epidermal growth factor and leptin in colon cancer cells (12). In addition, SAMe and MTA can induce apoptotic cell death in both liver and colon cancer cells, albeit by different mechanisms (13,14). Moreover, SAMe and MTA are hepatoprotective and are non-apoptotic to normal colon cells (13,14). Our laboratory and others have shown that SAMe and MTA can reduce the lipopolysaccharide (LPS)-mediated increase in the expression of inflammatory cytokines like TNF-α and iNOS in mouse macrophages in vitro as well as mouse livers in vivo (15–17).
The main objectives of this study were to determine if SAMe/MTA treatment can prevent or reduce inflammation-induced colon carcinogenesis, identify signaling pathways that SAMe/MTA affect and identify the mechanisms of SAM/MTA in altering gene expression. Our study showed that SAMe and MTA are able to reduce inflammation-induced colon tumorigenesis by affecting multiple signaling pathways. Surprisingly, unlike the liver, SAMe and MTA did neither affect TNF-α nor iNOS expression. Our results demonstrate that SAMe and MTA may serve as potential chemopreventive agents in inflammation-induced colon cancer.
Materials and methods
Materials
SAMe in the disulfate p-toluene sulfonate powder form was a generous gift from Gnosis SRL (Cairate, Italy). MTA and azoxymethane (AOM) were purchased from Sigma–Aldrich (St Louis, MO). Dextran sulfate sodium salt (DSS) (MW 40 000–50 000) was purchased from USB Corporation (Cleveland, OH). Antibodies used for either western and/or immunohistochemistry to phospho-Tyr 705-STAT3, total STAT3, IL-6, IL-10, β-catenin, active caspase 3, phospho-AKT, total AKT, histone H3 and β-actin were purchased from Cell Signaling Technology (Danvers, MA), whereas the p50 and p65 NFκB antibodies were purchased from Abcam (Cambridge, MA). Human recombinant IL-6 (rIL-6) was purchased from Cell Signaling Technology. All other reagents were of analytical grade and obtained from commercial sources.
Cell culture and SAMe, MTA and rIL-6 treatments
Colo 205 colon cancer cells were purchased from American Type Culture Collection (Manassas, VA) and grown according to their suggested conditions. Fetal bovine serum was obtained from Gemini Bio-Products (West Sacramento, CA). Cells were grown at 37°C in a 5% CO2 humidified incubator. Approximately 250 000–300 000 Colo 205 cells were grown to ∼40–50% confluency on six well plates and media replaced with fresh media prior to treatment. Cells were treated with 40 ng/ml of rIL-6 for 48 h and given either 1 mM SAMe or 0.5 mM MTA during the last 3, 6 or 12 h of rIL-6 treatment.
AOM/DSS experimental inflammation-induced colon cancer model
A total of 50 five-week-old male Balb/c mice were administered an intraperitoneal injection with 12.5 mg/kg of AOM. Two days post-AOM injection, the mice were separated into three groups (20 control, 15 SAMe and 15 MTA) and given daily vehicle (1× phosphate-buffered saline), 100 mg/kg/day SAMe or 75 mg/kg/day MTA via their water supply for the entire duration of the experiment. Water consumption was recorded after every change of SAMe (changed every 2 days), MTA (changed once a week) or control (changed once a week). The concentration of SAMe and MTA solutions were determined based on the average amount of water a Balb/c mice consumed per day as shown by Bachmanov et al. (18). The mice consumed 6 ml on average daily and consumption was comparable among the three groups during the duration of the experiment. Five days after the AOM injection, the mice were given 3% DSS via the water supply for 5 days to induce colonic inflammation. During DSS treatment, the vehicle, SAMe (100 mg/kg/day) or MTA (75 mg/kg/day) was administered via oral gavage instead. The mice were allowed to recover for 16 days before this process is repeated two more times (for a total of three cycles). The mice were killed 10 days after the last cycle. SAMe and MTA treatment were well tolerated and exerted no influence on body weight of the mice. A scheme of the treatment protocol is shown in Supplementary Figure 1, available at Carcinogenesis online. The mouse colons were isolated and slit open longitudinally for tumor count and size determination using a dissecting microscope. Tumor load was determined by summing all the diameters of the colonic tumors for any given mouse (19). Tumors were excised for RNA and protein isolation for gene expression analysis using real-time polymerase chain reaction and western blot analysis, respectively. Non-tumorous colonic epithelia were scraped from the middle and proximal portions of the colon. Other colons were fixed in 10% fresh formalin and sections were cut out to embed in paraffin for immunohistochemical analysis. The mouse procedure protocols, use and the care of the animals were reviewed and approved by the Institutional Animal Care and Use Committee at the University of Southern California.
SAMe, S-adenosylhomocysteine and MTA levels from AOM/DSS tumor tissue
Metabolite levels from tumors of AOM/DSS-, AOM/DSS + SAMe- and AOM/DSS + MTA-treated mice were determined as described previously (12).
Messenger RNA isolation and quantitative expression studies
Total RNA was isolated from AOM/DSS, AOM/DSS + SAMe, AOM/DSS + MTA or Colo 205 cells using Tissue/Cell RNA Miniprep Kit (Bioland Scientific, Cerritos, CA) according to the manufacturer’s suggested protocol. 0.5 μg of total RNA was reverse transcribed using MMLV-RT Kit (Invitrogen, Carlsbad, CA) in a 20 μl reaction volume and from that 2 μl of the reaction volume was added to 1× Roche universal master mix and the appropriate Taqman probe for quantitative real-time polymerase chain reaction on the Light Cycler 480 (Roche, Indianapolis, IN). Taqman probes for caspase-8 (FLICE)-like inhibitory protein (cFLIP), methionine adenosyltransferase 2A (MAT2A), MAT2B, methylthioadenosine phosphorylase (MTAP), COX2, IL-1β, NOS2, TNF-α, IL-6, IL-10, STAT3, glyceraldehydes 3-phosphate dehydrogenase housekeeping gene, p50 and p65 were obtained from Applied Biosystems (Foster City, CA). Expression of various genes was normalized to glyceraldehydes 3-phosphate dehydrogenase.
Histological analysis of colonic tumors in the AOM/DSS-treated mice
Five micromolar cut paraffin-embedded sections were immunostained with antibodies against β-catenin, active caspase 3, IL-6 and phospho-STAT3. The immunostaining was done as described previously (20). Proliferating cell nuclear antigen (PCNA) detection was done using the PCNA staining kit from Invitrogen. Hematoxylin and eosin staining was done by the Histology Core of the USC Liver Disease Research Center. For immunohistochemical quantification, a total of five fields at ×100 magnification, using the MetaMorph imaging software (Woburn, MA), were randomly selected (minimum of 1000 cells total) and positive nuclei or cells were counted and expressed as a percentage of the total. Control sets with no antibody showed no staining.
Protein isolation and western blot analysis
Nuclear and cytoplasmic extracts were isolated from the tumors of the various AOM/DSS-treated mouse groups using the CelLytic NuCLEAR Extraction Kit according to the manufacturer’s suggested protocol (Sigma–Aldrich). For Colo 205-treated cells, the 1× phosphate-buffered saline-washed cells were incubated in RIPA buffer for 30 min at 4°C with gentle agitation. The homogenate was spun down at maximum speed for 10 min at 4°C and supernatant isolated for the whole-cell extract. A total of 5 μg of nuclear or cytoplasmic extract or 10 μg of Colo 205 whole-cell extract was used for western analysis as described previously (21).
Statistical analysis
Data are given as mean ± standard error of the mean. Statistical analysis was performed using analysis of variance and Fisher’s test. For protein levels, ratios of proteins to β-actin or histone H3 housekeeping densitometric values were compared. Significance was defined by P < 0.05.
Results
Effects of SAMe and MTA treatment on tumor multiplicity, size and load in an experimental inflammation-induced colon cancer model
Daily treatment of either 100 mg/kg of SAMe or 75 mg/kg of MTA to AOM/DSS mice decreased the average number of tumors from ∼15.9 to 10 or 12, respectively (Figure 1A). SAMe reduced the average size of the tumors from 2.27 to 2 mm (Figure 1B). Despite having a lesser effect on tumor multiplicity, MTA reduced the average tumor size even more (average size: 1.76 mm) than SAMe treatment (Figure 1B, see Supplementary Table 1, available at Carcinogenesis online, for stratified data). Both SAMe and MTA treatment also reduced tumor load by 43 and 40%, respectively (Figure 1C). SAMe or MTA treatment alone, in the absence of AOM and DSS treatments (n = 6 animals each), had no effect on the colonic epithelium (data not shown).
Fig. 1.
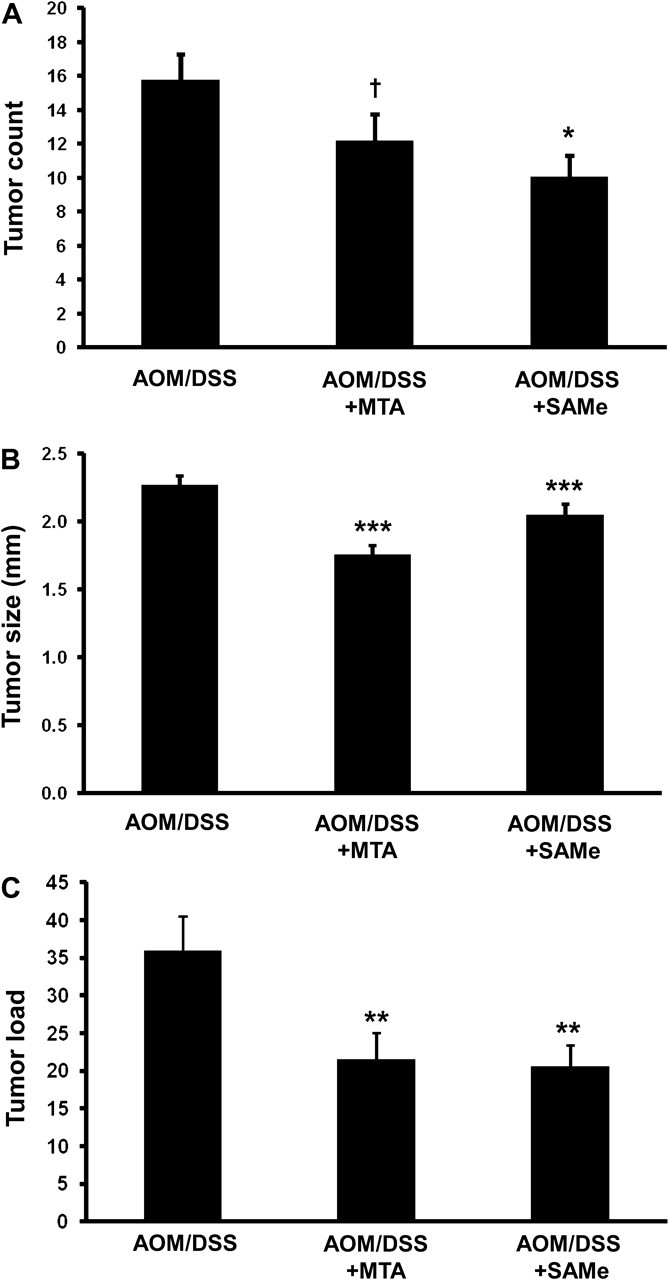
SAMe and MTA treatment reduced tumor multiplicity, size and tumor load in AOM/DSS-treated mice. AOM/DSS mice were treated with 100 mg/kg/day of SAMe or 75 mg/kg/day of MTA as described in Materials and methods. (A) Average tumor count, (B) tumor size and (C) tumor load were measured from 20 AOM/DSS control, 15 AOM/DSS + SAMe and 15 AOM/DSS + MTA mice. †P < 0.005 versus AOM/DSS, *P < 0.05 versus AOM/DSS, ***P < 0.001 versus AOM/DSS and **P < 0.01 versus AOM/DSS.
Levels of SAMe, S-adenosylhomocysteine and MTA following SAMe and MTA treatments in the AOM/DSS tumors
High-performance liquid chromatography measurements of SAMe, S-adenosylhomocysteine (SAH) and MTA levels (all expressed as nanomolars/milligram protein) in 12 tumors of AOM/DSS-treated mice were 1.87 ± 0.19, 1.23 ± 0.13 and 0.57, respectively. SAMe treatment of 10 tumors was able to raise both the intracellular SAMe and MTA levels in the tumor tissue to 2.77 ± 0.3 (P < 0.01 versus AOM/DSS) and 0.85 ± 0.09 (P < 0.01 versus AOM/DSS), whereas SAH levels (1.45 ± 0.20) were not significantly different. MTA treatment of 10 tumors elevated SAMe levels to 2.43 ± 0.22 (P < 0.05 versus AOM/DSS), SAH levels to 1.72 ± 0.15 (P < 0.05 versus AOM/DSS) and MTA levels to 0.94 ± 0.11 (P < 0.01 versus AOM/DSS).
Molecular targets of SAMe and MTA in the AOM/DSS-treated mice
SAMe and MTA have been shown to affect the expression of a variety of transcription factors and genes involved in growth and apoptosis (10–13,22). The expression of cytokines, growth factors and transcription factors known to be upregulated during chronic inflammation in the colon, such as COX2, IL-1β, NOS2, TNF-α, IL-6, IL-10 and STAT3 are confirmed elevated in the AOM/DSS mouse model (Figure 2A) (5). TNF-α via NFκB can elevate cFLIP expression and we showed that SAMe and MTA can reduce its expression to promote apoptosis in colon cancer cells (7,13). The gene products for MAT2A and MAT2B, responsible for SAMe biosynthesis in non-hepatic tissues, are overexpressed in liver cancer (23,24) and MAT2A is overexpressed in colon cancer (12); however, it is unknown whether these genes are also elevated in inflammation-induced colon cancer. In the AOM/DSS-treated mice, only MAT2A expression was upregulated by 2-fold in tumor tissue (Figure 2A). MTAP is responsible for MTA metabolism and is upregulated in colon cancer cell lines and in the normal mucosa of AOM/DSS-treated mice (25,26). We found that MTAP expression is also elevated in the tumor tissue of AOM/DSS-treated mice (Figure 2A). Both p50 (NFκB1) and p65 (RelA) expression are upregulated in this model (Figure 2A). MTA treatment reduced the expression of all the genes tested with the exception of NOS2 (iNOS) and TNF-α in the colonic tumors of AOM/DSS-treated mice (Figure 2B). SAMe treatment also reduced the expression of cFLIP, MTAP, IL-6, IL-10, STAT3, NFκB1 and RelA but had no effect on the expression of MAT2A, MAT2B, COX2, iNOS and TNF-α (Figure 2B).
Fig. 2.

Gene expression of pro-inflammatory, pro-growth cytokines and transcription factors of SAMe- and MTA-treated AOM/DSS mice. Quantitative real-time polymerase chain reaction was done to measure messenger RNA levels of genes important during inflammation-induced colon cancer. (A) Expression profile of genes following AOM/DSS treatment, comparing the tumor over adjacent non-tumorous mucosa. (B) Effect of SAMe or MTA treatment on the tumor tissue of the same genes. Results are from 10 mice per group, at least one tumor per mouse was examined. *P < 0.05 versus AOM/DSS, ***P < 0.001 versus AOM/DSS, †P < 0.005 versus AOM/DSS and **P < 0.01 versus AOM/DSS.
Effects of SAMe and MTA in tumor growth and apoptosis, β-catenin, IL-6 and STAT3 activation in the AOM/DSS-treated mice
PCNA staining shows that SAMe or MTA was able to reduce proliferation in the treated tumors by 45 and 56% as compared with the AOM/DSS control, respectively (Figure 3, top row). In contrast, SAMe and MTA increased apoptosis by 4.9- and 8.5-fold, respectively, as indicated by increased staining for active caspase 3 (Figure 3, second row). β-catenin, a gene commonly misregulated in colon cancer, can induce the expression of a variety of genes involved in growth and proliferation (27). SAMe and MTA treatment reduced β-catenin staining in these tumors by 61 and 46%, respectively (Figure 3, third row; see Supplementary Figure 2, available at Carcinogenesis online, for higher magnification view). IL-6 is a growth-promoting cytokine, which induces STAT3 phosphorylation to activate the expression of many genes involved in growth and proliferation (5). SAMe and MTA treatment lowered the amount of IL-6-positive cells in the tumors from 21.7 to 13 and 7.3%, respectively (Figure 3, fourth row). In the lymphoid aggregates found within the colonic epithelium of AOM/DSS-treated mice, SAMe and MTA reduced the amount of IL-6-positive cells from 28.7 to 6.3 and 7%, respectively (Supplementary Figure 3, available at Carcinogenesis online). The number of phosphorylated STAT3 in both the tumor cells and lymphoid aggregate cells were also similarly reduced by SAMe and MTA (Figure 3, bottom row, Supplementary Figure 3, available at Carcinogenesis online). Western blot analysis showed that p65 and p50 protein expression in the AOM/DSS tumors were reduced after SAMe or MTA treatment by 60–80% (Figure 4A). In addition, protein expression for IL-6 in tumors of AOM/DSS mice was reduced by 64% for MTA and 48% for SAMe treatment (Figure 4B). MTA-treated AOM/DSS mice saw a reduction of IL-10 by ∼49%, whereas SAMe only reduced its expression by 23% (Figure 4B).
Fig. 3.
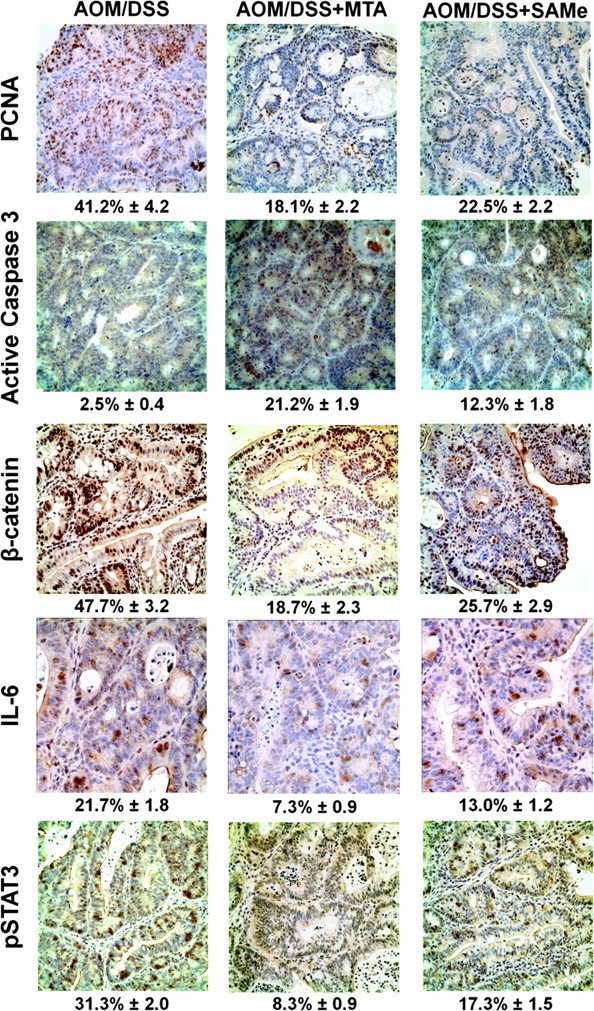
SAMe and MTA treatment reduced proliferation, β-catenin activation and IL-6 signaling while inducing apoptosis. Immunohistochemical analysis of SAMe- and MTA-treated AOM/DSS mice with PCNA, active caspase 3, β-catenin, IL-6 and phosphorylated STAT3. Representative immunohistochemical staining from tumors of at least three mice per group (three tumors per mouse) are shown. Numbers below each immunohistochemical staining refer to average percentage of positively stained cells ± standard error of the mean.
Fig. 4.

SAMe and MTA treatment reduced NFκB, IL-6 and IL-10 expression in tumors of AOM/DSS-treated mice. Western blot analysis of nuclear extracts from the tumors of AOM/DSS control, AOM/DSS + SAMe and AOM/DSS + MTA mice were done as described in Materials and methods. (A) p50 and p65 expression. The values were normalized to histone H3. (B) Cytoplasmic extract of the AOM/DSS-treated mice was used to look at IL-6 and IL-10 expression. The values were normalized to actin. Densitometric values are shown in the graphs below the western blots. Results represent mean ± standard error of the mean from three mice per group. †P < 0.05 versus AOM/DSS, ***P < 0.001 versus AOM/DSS.
Effects of SAMe and MTA on STAT3 and AKT activation
Phosphorylation of both STAT3 and AKT are important for its activity (28,29). SAMe and MTA greatly reduced STAT3 phosphorylation by >80% (Figure 5A and C). AKT, part of the phosphoinositide 3-kinase signaling pathway, is a kinase that is involved in growth promotion. In addition, it can act on STAT3 phosphorylation via mTOR signaling (5). SAMe and MTA treatment of AOM/DSS mice reduced tumor AKT phosphorylation by 73 and 67%, respectively (Figure 5B and C).
Fig. 5.
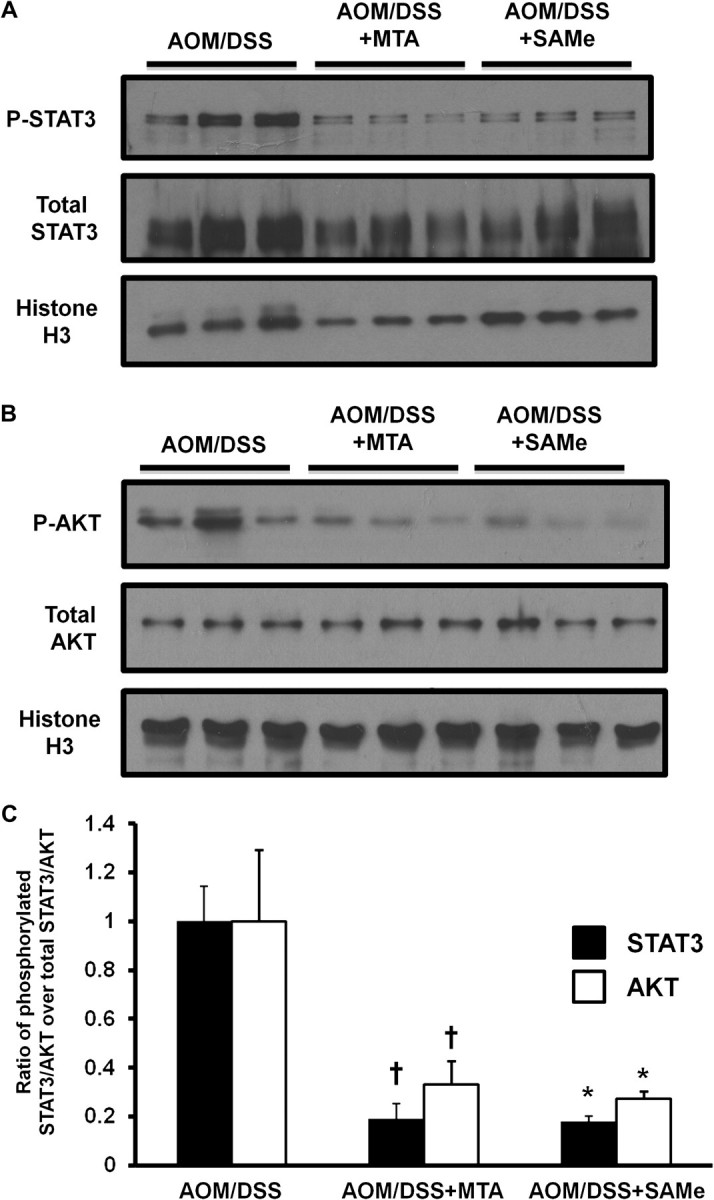
SAMe and MTA treatment lowered the activation of STAT3 and AKT in the tumors of AOM/DSS-treated mice. Western blot analyses using nuclear extracts of the AOM/DSS-treated mice were done as described in Materials and methods for (A) phosphorylated and total STAT3 and (B) phosphorylated and total AKT. The values are represented as the ratio of the phosphorylated protein over the total protein from three mice per group. These values were normalized to histone H3. (C) Densitometric values are shown for the western blots. †P < 0.005 versus AOM/DSS, *P < 0.05 versus AOM/DSS.
Effects of SAMe and MTA on IL-6 signaling and IL-10 expression
The effects of IL-6 are primarily mediated by phosphorylated STAT3 (5) and IL-10 is one of its downstream targets (30). SAMe and MTA treatment reduced levels of IL-6, phosphorylated STAT3 and IL-10 in the colonic tumors as compared with AOM/DSS control mice (Figures 2B, 4B and 5A). To gain further insight on the molecular mechanisms of how SAMe and MTA inhibit IL-6 signaling and IL-10 expression, we used Colo 205 colon cancer cells, which exhibit increased IL-10 expression following rIL-6 treatment (30). Figure 6A shows that rIL-6 induction of IL-10 expression in Colo 205 colon cancer cells can be reduced by SAMe treatment by 30–35%. MTA treatment reduced basal IL-10 expression by 76–82% and reduced IL-6-induced IL-10 expression by 82–86% at all time points (Figure 6A). To examine whether MTA’s inhibitory effect on IL-10 expression is transcriptional or posttranscriptional, Colo 205 cells were pretreated with 5 μg/ml of actinomycin D for 1 h before 0.5 mM MTA treatment for 1–3 h. MTA had no effect on IL-10 messenger RNA stability (data not shown). Since IL-6 signaling is mediated by STAT3, we tested whether the inhibition of SAMe and MTA’s of IL-6-mediated IL-10 induction is via the loss of STAT3 activation. Treatment with MTA for 3–12 h was able to reduce rIL-6-mediated STAT3 phosphorylation by 40–75%, whereas SAMe treatment had no effect on STAT3 phosphorylation at these time points (Figure 6B).
Fig. 6.

MTA treatment lowered basal IL-10 expression and blocked IL-6-induced IL-10 expression by inhibiting STAT3 activation. Colo 205 cells were treated with rIL-6 for 48 h. During the last 3–12 h, cells were treated with either 1 mM SAMe or 0.5 mM MTA. (A) messenger RNA levels of IL-10 after SAMe or MTA treatment alone or after rIL-6 induction. *P < 0.001 versus control, †P < 0.001 versus rIL-6, **P < 0.005 versus control and ††P < 0.005 versus rIL-6. (B) Western blot analysis using whole-cell lysates from Colo 205 cells treated with rIL-6 ± SAMe or ± MTA was done as described in Materials and methods for phosphorylated and total STAT3. The values are expressed as a ratio of the phosphorylated STAT3 over the total STAT3. All values were normalized to actin control. Results represent mean ± standard error of the mean of four to five independent experiments. *P < 0.05 versus rIL-6, †P < 0.01 versus rIL-6.
Discussion
Colon cancer is one of the most common malignancies afflicting the world today. Some of the important contributors to colon carcinogenesis are WNT/β-catenin, transforming growth factor beta, k-Ras, p53 and inflammation (5). Inflammation is one of the main processes driving tumor progression in CAC (5). TNF-α and IL-6 are the two pro-inflammatory cytokines involved in CAC, which upregulate the activity of NFκB and STAT3, respectively (5). During chronic inflammation, NFκB and STAT3 are the primary mediators of these cytokine actions, which provide pro-survival, growth and angiogenesis signals for the preneoplastic colon epithelial cells (5). A recent report by Popivanova et al. (9) showed the potential of inhibiting TNF-α to reduce tumorigenesis in an inflammation-induced colon cancer mouse model system. Since SAMe and MTA have been shown to reduce LPS-induced TNF-α expression in Kupffer cells, RAW macrophages and in whole liver (15–17), we tested whether SAMe and MTA can also reduce inflammation-induced colon tumorigenesis.
In this study, we examined the effect of SAMe and MTA on the well-established AOM/DSS mouse model system, which mimics inflammation-induced colon carcinogenesis. In addition to the inhibitory effects that SAMe and MTA have on TNF-α expression in whole liver and macrophages, they both exert selective pro-apoptotic effect in colon cancer cells but not normal colon epithelial cells (13,15–17). A key mechanism identified was the ability of these agents to inhibit cFLIP expression, which is often increased in colon cancer (13). Our results showed that daily treatment of 100 mg/kg of SAMe or 75 mg/kg of MTA can reduce tumor multiplicity, size and tumor load (Figure 1). There are several comparable studies on chronic inflammation (multiple DSS treatments)-induced colon cancer. Popivanova et al. showed that the TNF-α blocker etanercept reduced tumor multiplicity by 46% (9), which is comparable with the potency of SAMe (36% reduction) (Figure 1A). Other anti-inflammatory agents such as the antioxidant mesalamine or its derivative sulfasalazine, commonly used to treat IBD, reduced tumor multiplicity by 44 and >80%, respectively (31). However, there are some discrepancies in results. Only lower doses of mesalamine (75 mg/kg body weight) were able to inhibit tumor multiplicity, whereas higher doses (225 mg/kg body weight) had a significantly lower potency (8.3% reduction) (32). Kohno et al. using the same dose of sulfasalazine for 2 extra weeks reduced tumor multiplicity by 57% (33). Although the ability of SAMe and MTA to reduce tumor multiplicity is not as potent, both reduced tumor load by at least 40% (Figure 1C). This suggests that SAMe and MTA have less of an effect on tumor initiation and a greater influence on the later stages of tumor growth and progression. Immunohistochemical and western blot analyses show the reduction of the proliferation marker PCNA (Figure 3) and pro-growth signaling pathways such as phosphoinositide 3-kinase/AKT, WNT/β-catenin, IL-6 and NFκB, all supporting the inhibitory effects of SAMe and MTA on growth (Figures 4 and 5). These results are consistent with past studies that demonstrate the ability of SAMe and MTA to attenuate growth-promoting signals (11,12).
SAMe and especially MTA inhibited the expression of many of the genes involved in growth and survival in the colonic tumors. MTA treatment reduced the expression of the pro-survival gene cFLIP, pro-growth genes MAT2A, MAT2B and IL-6, pro-inflammatory genes COX2 and IL-1β, the anti-inflammatory cytokine IL-10 and transcription factors STAT3 and NFκB (Figure 2B). Interestingly, SAMe has no effect on MAT2A, MAT2B, IL-1β and COX2 (Figure 2B); yet, the intracellular SAMe and MTA levels are similar for both SAMe- and MTA + AOM/DSS-treated groups. However, only MTA treatment significantly raised SAH levels, which is consistent with its known inhibitory effect on SAH hydrolase (34). SAH is a powerful inhibitor of all methylation reactions (35). This could influence the expression of several genes that may be regulated directly or indirectly by DNA or protein methylation. Treatment of 5-aza-deoxycytodine, a DNA methylation inhibitor, reactivated the expression of IL-1β in HL-60 human monocytes and human cultured chondrocytes (36,37). This is the first report of MTA inhibiting the pro-inflammatory agents IL-1β expression in inflammation-induced colonic tumors. IL-1β, an important cytokine for proliferation, differentiation and apoptosis, is expressed early in inflammation-induced colon tumorigenesis (5). COX2 is a target of IL-1β signaling and thus its inhibition by MTA may be influenced by IL-1β.
Downregulation of cFLIP and MAT2A by MTA is consistent with our previous studies in colon cancer cell lines (12,13). MTAP upregulation in the tumors of AOM/DSS-treated mice confirms the results of Bataille et al. (Figure 2A) (25). This upregulation is contrary to what is found in other cancers where MTAP is normally downregulated (38). Bataille et al. suggested that MTAP may negatively affect interferon-γ signaling, which is involved in growth suppression (25). The inhibitory effect of SAMe and MTA on MTAP expression may be due to its reduction of TCF/β-catenin signaling since MTAP is a WNT target gene (25). The action of SAMe and MTA on MTAP may potentially alleviate its inhibitory actions toward interferon-γ signaling, thus enabling tumor growth suppression by interferon-γ.
SAMe and MTA reduced colon tumor multiplicity size and load in a TNF-α-independent manner. This was totally unexpected since SAMe and MTA can inhibit LPS-induced TNF-α expression in liver Kupffer cells, RAW mouse macrophages and whole liver (15–17). Both SAMe and MTA also lowered the expression of IL-6 and its target gene IL-10 in AOM/DSS-derived tumors (Figures 2B and 5B). This is the opposite of what is seen in LPS-induced RAW mouse macrophages where Song et al. showed that SAMe treatment prior to LPS stimulation elevated both IL-6 and IL-10 protein expression (39). This is not the first instance where SAMe and MTA demonstrated different effects in comparing liver with colon cancer cells. In liver cancer, SAMe and MTA can induce apoptosis via induction of Bcl-Xs expression, whereas in the colon cancer cells, Bcl-Xs expression was unaffected and cFLIP expression was downregulated (13,40). Consistent with previous in vitro findings of SAMe and MTA selectively inducing apoptosis in colon cancer cells by downregulating cFLIP (13), they also lowered cFLIP expression and induced apoptosis in AOM/DSS-derived tumors (Figure 3).
SAMe and MTA treatment of AOM/DSS mice lowered the expression of NFκB and STAT3, both of which are important in promoting survival and growth during colon tumorigenesis (Figure 2B). Since NFκB activates TNF-α and iNOS, it is unclear why SAMe and MTA had no effect on TNF-α expression. Other signal transduction mechanisms unaffected by SAMe or MTA remain to be identified that maintain the expression of these cytokines. STAT3 is the primary effector of IL-6 signaling and aids in maintaining NFκB activation in tumors (8). Constitutive activation of STAT3 and NFκB is important to maintain tumor growth and survival (5). In Colo 205 cells, rIL-6 can induce the expression of IL-10 via STAT3 activation (30). We used this in vitro model to examine IL-10 expression and IL-6 signaling. MTA, in as little as 3 h, almost totally inhibited IL-6-induced IL-10 expression by reducing the level of phosphorylated STAT3 (Figure 6). MTA also lowered basal IL-10 messenger RNA level, most likely at the transcriptional level since messenger RNA stability was unaffected. However, unlike the in vivo mouse experiments, SAMe had a much smaller effect on IL-6-induced IL-10 expression, as evident by the lack of inhibition of STAT3 phosphorylation (Figure 6). The lack of SAMe effect in the Colo 205 cells may be attributed to the possibility that SAMe’s effect is mediated by MTA instead. Exogenous SAMe is very unstable in media and can spontaneously convert to MTA (16,41). In the in vivo AOM/DSS study, SAMe is continuously administered to mice for the duration of the experiment, to the point where we see an overall increase in MTA levels comparable with those of MTA treatment in the colonic tumors. In the in vitro Colo 205 experiments, SAMe treatment was only for up to 12 h and in that time SAMe’s conversion to MTA (1.3%/h) is not enough to see the effect exhibited by MTA (12).
In summary, SAMe and MTA treatment attenuated inflammation-induced colon tumor multiplicity, size and tumor load. This effect is independent of TNF-α and iNOS. These treatments induced apoptosis and inhibited many signaling pathways important in colon carcinogenesis, including β-catenin, IL-6 signaling, pro-inflammatory cytokine IL-1β and several pro-growth and proliferation pathways. MTA appears to influence IL-6 signaling by preventing STAT3 activation (Supplementary Figure 4, available at Carcinogenesis online). This can disrupt the cross talk between STAT3 and NFκB to maintain constitutive activation during inflammation-induced tumorigenesis. Disruption of this pathway leads to the reduction of constitutive STAT3 and NFκB activation within the colon tumor cells. Inhibiting this cycle may make the colon cancer cells more susceptible to chemotherapy. The molecular mechanisms responsible for the effects of SAMe and MTA on these signaling pathways are the subject of future investigation. Since SAMe and MTA are found in our bodies and SAMe appears safe for chronic use, they may be ideal candidates for chemoprevention of inflammation-induced colon cancer.
Supplementary material
Supplementary Table 1 and Figures 1–4 can be found at http://carcin.oxfordjournals.org/
Funding
National Institutes of Health grant (AT004896 to S.C.L., J.M.M.); and Plan Nacional of I+D SAF 2011-29851 [to J.M.M.].
Supplementary Material
Acknowledgments
Colo 205 colon cancer cells were provided by the Cell Culture Core and colonic tissue sectioning, hematoxylin and eosin staining and immunohistochemistry were performed by the Histology Core of the University of Southern California Research Center for Liver Diseases (P30DK48522).
Conflict of Interest Statement: None declared.
Glossary
Abbreviations
- AOM
azoxymethane
- CAC
colitis-associated cancer
- cFLIP
caspase-8 (FLICE)-like inhibitory protein
- COX2
cyclooxygenase 2
- DSS
dextran sulfate sodium salt
- IBD
inflammatory bowel disease
- IL
interleukin
- iNOS
inducible nitric oxide synthase
- LPS
lipopolysaccharide
- MAT
methionine adenosyltransferase
- MTA
methylthioadenosine
- MTAP
methylthioadenosine phosphorylase
- NFκB
nuclear factor kappa B
- PCNA
proliferating cell nuclear antigen
- rIL-6
recombinant IL-6
- SAH
S-adenosylhomocysteine
- SAMe
S-adenosylmethionine
- STAT3
signal transducer and activator of transcription 3
- TNF-α
tumor necrosis factor alpha
References
- 1.American Cancer Society. Cancer Facts and Figures 2011. Atlanta, GA: American Cancer Society; 2011. [Google Scholar]
- 2.DeCosse JJ, et al. Colorectal cancer: detection, treatment, and rehabilitation. CA Cancer J. Clin. 1994;44:27–42. doi: 10.3322/canjclin.44.1.27. [DOI] [PubMed] [Google Scholar]
- 3.Lakatos PL, et al. Risk for colorectal cancer in ulcerative colitis: changes, causes and management strategies. World J. Gastroenterol. 2008;14:3937–3947. doi: 10.3748/wjg.14.3937. [DOI] [PMC free article] [PubMed] [Google Scholar]
- 4.Mattar MC, et al. Current management of inflammatory bowel disease and colorectal cancer. Gastrointest. Cancer Res. 2011;4:53–61. [PMC free article] [PubMed] [Google Scholar]
- 5.Terzic J, et al. Inflammation and colon cancer. Gastroenterology. 2010;138:2101–2114. doi: 10.1053/j.gastro.2010.01.058. [DOI] [PubMed] [Google Scholar]
- 6.Liu W, et al. Cyclooxygenase-2 is up-regulated by interleukin-1 beta in human colorectal cancer cells via multiple signaling pathways. Cancer Res. 2003;63:3632–3636. [PubMed] [Google Scholar]
- 7.Karin M. Nuclear factor-kappaB in cancer development and progression. Nature. 2006;441:431–436. doi: 10.1038/nature04870. [DOI] [PubMed] [Google Scholar]
- 8.Lee H, et al. Persistently activated Stat3 maintains constitutive NF-kappaB activity in tumors. Cancer Cell. 2009;15:283–293. doi: 10.1016/j.ccr.2009.02.015. [DOI] [PMC free article] [PubMed] [Google Scholar]
- 9.Popivanova BK, et al. Blocking TNF-alpha in mice reduces colorectal carcinogenesis associated with chronic colitis. J. Clin. Invest. 2008;118:560–570. doi: 10.1172/JCI32453. [DOI] [PMC free article] [PubMed] [Google Scholar]
- 10.Lu SC, et al. Role of methionine adenosyltransferase and S-adenosylmethionine in alcohol-associated liver cancer. Alcohol. 2005;35:227–234. doi: 10.1016/j.alcohol.2005.03.011. [DOI] [PubMed] [Google Scholar]
- 11.Ramani K, et al. Leptin's mitogenic effect in human liver cancer cells requires induction of both methionine adenosyltransferase 2A and 2beta. Hepatology. 2008;47:521–531. doi: 10.1002/hep.22064. [DOI] [PMC free article] [PubMed] [Google Scholar]
- 12.Chen H, et al. Role of methionine adenosyltransferase 2A and S-adenosylmethionine in mitogen-induced growth of human colon cancer cells. Gastroenterology. 2007;133:207–218. doi: 10.1053/j.gastro.2007.03.114. [DOI] [PubMed] [Google Scholar]
- 13.Li TW, et al. S-adenosylmethionine and methylthioadenosine inhibit cellular FLICE inhibitory protein expression and induce apoptosis in colon cancer cells. Mol. Pharmacol. 2009;76:192–200. doi: 10.1124/mol.108.054411. [DOI] [PMC free article] [PubMed] [Google Scholar]
- 14.Ansorena E, et al. S-adenosylmethionine and methylthioadenosine are antiapoptotic in cultured rat hepatocytes but proapoptotic in human hepatoma cells. Hepatology. 2002;35:274–280. doi: 10.1053/jhep.2002.30419. [DOI] [PubMed] [Google Scholar]
- 15.Ara AI, et al. S-adenosylmethionine inhibits lipopolysaccharide-induced gene expression via modulation of histone methylation. Hepatology. 2008;47:1655–1666. doi: 10.1002/hep.22231. [DOI] [PMC free article] [PubMed] [Google Scholar]
- 16.Chawla RK, et al. S-adenosylmethionine deficiency and TNFα in lipopolysaccharide-induced hepatic injury. Am. J. Physiol. Gastrointest. Liver Physiol. 1998;38:G125–G129. doi: 10.1152/ajpgi.1998.275.1.G125. [DOI] [PubMed] [Google Scholar]
- 17.Hevia H, et al. 5'-Methylthioadenosine modulates the inflammatory response to endotoxin in mice and in rat hepatocytes. Hepatology. 2004;39:1088–1098. doi: 10.1002/hep.20154. [DOI] [PubMed] [Google Scholar]
- 18.Bachmanov AA, et al. Food intake, water intake, and drinking spout side preference of 28 mouse strains. Behav. Genet. 2002;32:435–443. doi: 10.1023/a:1020884312053. [DOI] [PMC free article] [PubMed] [Google Scholar]
- 19.Grivennikov S, et al. IL-6 and Stat3 are required for survival of intestinal epithelial cells and development of colitis-associated cancer. Cancer Cell. 2009;15:103–113. doi: 10.1016/j.ccr.2009.01.001. [DOI] [PMC free article] [PubMed] [Google Scholar]
- 20.Yang H, et al. A mouse model of cholestasis-associated cholangiocarcinoma and transcription factors involved in progression. Gastroenterology. 2011;141:378–388. doi: 10.1053/j.gastro.2011.03.044. [DOI] [PMC free article] [PubMed] [Google Scholar]
- 21.Chen L, et al. Impaired liver regeneration in mice lacking methionine adenosyltransferase 1A. FASEB J. 2004;18:914–916. doi: 10.1096/fj.03-1204fje. [DOI] [PubMed] [Google Scholar]
- 22.Andreu-Perez P, et al. Methylthioadenosine (MTA) inhibits melanoma cell proliferation and in vivo tumor growth. BMC Cancer. 2010;10:265. doi: 10.1186/1471-2407-10-265. [DOI] [PMC free article] [PubMed] [Google Scholar]
- 23.Cai J, et al. Differential expression of methionine adenosyltransferase genes influences the rate of growth of human hepatocellular carcinoma cells. Cancer Res. 1998;58:1444–1450. [PubMed] [Google Scholar]
- 24.Yang H, et al. Expression pattern, regulation, and functions of methionine adenosyltransferase 2beta splicing variants in hepatoma cells. Gastroenterology. 2008;134:281–291. doi: 10.1053/j.gastro.2007.10.027. [DOI] [PMC free article] [PubMed] [Google Scholar]
- 25.Bataille F, et al. Strong expression of methylthioadenosine phosphorylase (MTAP) in human colon carcinoma cells is regulated by TCF1/[beta]-catenin. Lab. Invest. 2005;85:124–136. doi: 10.1038/labinvest.3700192. [DOI] [PubMed] [Google Scholar]
- 26.Suzuki R, et al. Global gene expression analysis of the mouse colonic mucosa treated with azoxymethane and dextran sodium sulfate. BMC Cancer. 2007;7:84. doi: 10.1186/1471-2407-7-84. [DOI] [PMC free article] [PubMed] [Google Scholar]
- 27.Clevers H. Wnt breakers in colon cancer. Cancer Cell. 2004;5:5–6. doi: 10.1016/s1535-6108(03)00339-8. [DOI] [PubMed] [Google Scholar]
- 28.Itoh N, et al. Phosphorylation of Akt/PKB is required for suppression of cancer cell apoptosis and tumor progression in human colorectal carcinoma. Cancer. 2002;94:3127–3134. doi: 10.1002/cncr.10591. [DOI] [PubMed] [Google Scholar]
- 29.Yu H, et al. STATs in cancer inflammation and immunity: a leading role for STAT3. Nat. Rev. Cancer. 2009;9:798–809. doi: 10.1038/nrc2734. [DOI] [PMC free article] [PubMed] [Google Scholar]
- 30.Herbeuval JP, et al. Recruitment of STAT3 for production of IL-10 by colon carcinoma cells induced by macrophage-derived IL-6. J. Immunol. 2004;172:4630–4636. doi: 10.4049/jimmunol.172.7.4630. [DOI] [PubMed] [Google Scholar]
- 31.De Robertis M, et al. The AOM/DSS murine model for the study of colon carcinogenesis: from pathways to diagnosis and therapy studies. J. Carcinog. 2011;10:9. doi: 10.4103/1477-3163.78279. [DOI] [PMC free article] [PubMed] [Google Scholar]
- 32.Clapper ML, et al. 5-Aminosalicylic acid inhibits colitis-associated colorectal dysplasias in the mouse model of azoxymethane/dextran sulfate sodium-induced colitis. Inflamm. Bowel Dis. 2008;14:1341–1347. doi: 10.1002/ibd.20489. [DOI] [PubMed] [Google Scholar]
- 33.Kohno H, et al. Ursodeoxycholic acid versus sulfasalazine in colitis-related colon carcinogenesis in mice. Clin. Cancer Res. 2007;13:2519–2525. doi: 10.1158/1078-0432.CCR-06-2727. [DOI] [PubMed] [Google Scholar]
- 34.Ferro AJ, et al. Inactivation of S-adenosylhomocysteine hydrolase by 5'-deoxy-5'-methylthioadenosine. Biochem. Biophys. Res. Commun. 1981;100:523–531. doi: 10.1016/s0006-291x(81)80208-2. [DOI] [PubMed] [Google Scholar]
- 35.Clarke S, et al. S-adenosylmethionine-Dependent Methyltransferases: Potential Targets in Homocysteine-Linked Pathology. Cambridge, UK: Cambridge University Press; 2001. pp. 63–78. [Google Scholar]
- 36.Hashimoto K, et al. DNA demethylation at specific CpG sites in the IL1B promoter in response to inflammatory cytokines in human articular chondrocytes. Arthritis Rheum. 2009;60:3303–3313. doi: 10.1002/art.24882. [DOI] [PMC free article] [PubMed] [Google Scholar]
- 37.Wessels I, et al. Changes in chromatin structure and methylation of the human interleukin-1beta gene during monopoiesis. Immunology. 2010;130:410–417. doi: 10.1111/j.1365-2567.2009.03243.x. [DOI] [PMC free article] [PubMed] [Google Scholar]
- 38.Kirovski G, et al. Down-regulation of methylthioadenosine phosphorylase (MTAP) induces progression of hepatocellular carcinoma via accumulation of 5'-deoxy-5'-methylthioadenosine (MTA) Am. J. Pathol. 2011;178:1145–1152. doi: 10.1016/j.ajpath.2010.11.059. [DOI] [PMC free article] [PubMed] [Google Scholar]
- 39.Song Z, et al. S-adenosylmethionine (SAMe) modulates interleukin-10 and interleukin-6, but not TNF, production via the adenosine (A2) receptor. Biochim. Biophys. Acta. 2005;1743:205–213. doi: 10.1016/j.bbamcr.2004.12.001. [DOI] [PubMed] [Google Scholar]
- 40.Yang H, et al. S-adenosylmethionine and its metabolite induce apoptosis in HepG2 cells: role of protein phosphatase 1 and Bcl-x(S) Hepatology. 2004;40:221–231. doi: 10.1002/hep.20274. [DOI] [PubMed] [Google Scholar]
- 41.Clarke SG. Inhibition of mammalian protein methyltransferases by 5’-methylthioadenosine (MTA): a mechanism of action of dietary SAMe? Enzymes. 2006;24:467–493. doi: 10.1016/S1874-6047(06)80018-1. [DOI] [PubMed] [Google Scholar]
Associated Data
This section collects any data citations, data availability statements, or supplementary materials included in this article.