

Abstract
The blood flow dynamics of a stenosed, subject-specific, carotid bifurcation were numerically simulated using the spectral element method. Pulsatile inlet conditions were based on in vivo color Doppler ultrasound measurements of blood velocity. The results demonstrated the transitional or weakly turbulent state of the blood flow, which featured rapid velocity and pressure fluctuations in the post-stenotic region of the internal carotid artery during systole and laminar flow during diastole. High-frequency vortex shedding was greatest downstream of the stenosis during the deceleration phase of systole. Velocity fluctuations had a frequency within the audible range of 100–300 Hz. Instantaneous wall shear stress within the stenosis was relatively high during systole (~25-45 Pa) compared to that in a healthy carotid. In addition, high spatial gradients of wall shear stress were present due to flow separation on the inner wall. Oscillatory flow reversal and low pressure were observed distal to the stenosis in the internal carotid artery. This study predicts the complex flow field, the turbulence levels and the distribution of the biomechanical stresses present in vivo within a stenosed carotid artery.
Keywords: Carotid artery bifurcation, Stenosis, Spectral element method, Hemodynamics, Turbulence, Wall shear stress
Introduction
Atherothrombotic carotid stenoses, followed by ischemic strokes, are one of the leading causes of mortality and morbidity in western countries (Murray and Lopez, 1997). The presence of a high-grade stenosis, manifested by plaque deposits, can result in transition to turbulence, which may produce audible sounds (bruit) discernible by a physician. (At typical hemodynamic Reynolds numbers (Re), blood flow does not exhibit the inertial range of scales associated with fully turbulent flow and might be more accurately described as highly unsteady or chaotic. For brevity, we refer to this state as turbulent or transitional.)
Many studies have been conducted to characterize local hemodynamics and their role on the early development of atherosclerosis. Atherosclerotic prone sites are often localized at bifurcations, junctions and regions of high-curvature, which are also regions of low wall shear stress (WSS) and flow disruption (Caro et al., 1969; Davies et al., 1988; Glagov et al., 1988; Ku et al., 1985; Zarins et al., 1983).
Regions downstream of severe constrictions, post-stenotic regions, can experience a significantly different biomechanical environment than healthy vessels due to turbulence. The WSS within the stenosis is usually high because of flow acceleration due to area reduction. High WSS and the presence of turbulence may damage the endothelial cells (Fry, 1968; Hellums, 1977) and play a role in platelet activation (Ramstack et al., 1979) or plaque rupture (Gertz and Roberts, 1990). In addition, the large spatial WSS gradient associated with turbulence is thought to enhance mass transport into the arterial wall, which may weaken the plaque and make it vulnerable to rupture (DePaola et al., 1992). High temporal shear gradients are shown to stimulate endothelial cell proliferation (White et al., 2001; Ojha, 1994). Moreover, Loree et al. (1991) demonstrated that turbulent pressure fluctuations are elevated by the severity of stenosis and may induce plaque injury.
Laser Doppler anemometry (LDA) measurements on in vitro stenosis models have provided insight into the turbulent characteristics in post-stenotic regions (Ahmed and Giddens, 1984; Cassanova and Giddens, 1978; Deshpande and Giddens, 1980; Lieber and Giddens, 1990). Several authors have conducted numerical studies of stenotic flows using turbulence models (Birchall et al., 2006; Ghalichi et al., 1998; Ryval et al., 2004; Stroud et al., 2002; Varghese and Frankel, 2003; Younis and Berger, 2004). Birchall et al. (2006) reported simulations with turbulence models in nine carotid arteries and emphasized the importance of using subject-specific geometries.
Recently, direct numerical simulation (DNS) has been employed in idealized stenosis geometries. The advantage of DNS is that it is particularly well-suited to the transitional regimes where turbulence models can have difficulty. Mittal et al. (2003) simulated pulsatile flow in an idealized stenosis geometry, a planar channel with one-sided semicircular constriction, by using finite difference/spectral-based DNS and large-eddy simulations, with resolution of ~655,000 points. They reported transition to turbulence for Reynolds numbers higher than 1000 with principal pressure and velocity fluctuations driven by the periodic formation of Kelvin-Helmholtz type rollers. Sherwin and Blackburn (2006) examined the instabilities and transition to turbulence of steady and pulsatile flow in an axisymmetric tube with an idealized 75% stenosis using both linear stability analysis and DNS. They used a spectral/spectral-element approach with polynomial order of up to N = 9, corresponding to ~2 million points, and observed transition to turbulence under pulsatile conditions at Reynolds number Re = 535 and under steady inlet conditions at Re = 722. While these idealized geometries differ from the subject-specific geometry presented here, all of the above studies report turbulence-associated complex flow characteristics and demonstrate the level of detail that can be obtained using DNS compared to turbulence models. Varghese et al. (2007a, 2007b) have used spectral elements to simulate transition under steady and pulsatile conditions in a configuration similar to Sherwin and Blackburn (2006), save that their stenosis featured a 5% eccentricity.
In the present study, we investigate transitional flow characteristics in a subject-specific carotid bifurcation with a stenosis by using the spectral element method (SEM). All scales of fluid motion are resolved and no turbulence model is employed. Validation of the code against laser Doppler anemometry measurements of transitional flow in arteriovenous graft models have been reported in Lee et al. (2007) and Loth et al. (2003). The results of a convergence study for the current geometry are reported in Fischer et al. (2007).
Methods
Images of a stenosed carotid bifurcation in a patient were acquired using a computerized X-ray tomography scanner (high speed CTI, GE Medical Systems, UK) with an axial spacing of 0.5 mm (256×256 pixels). The calculated pixel size was 0.5×0.5 mm and a total of 160 axial images were acquired. As noted in a recent survey by Thomas et al. (2005), aged or diseased carotids can exhibit a variety of deformations and tortuous morphologies that exhibit significant departures from an idealized case. The geometry considered here (Fig. 1) is an example of such a departure. It features a sharp bend at the end of the stenosis and significant non-coplanarity. The vessel diameters are: common carotid artery (CCA), 0.77 cm; external carotid artery (ECA), 0.29 cm; internal carotid artery (ICA), 0.46 cm; and ICA stenosis, 0.34 cm. Based on the ICA outlet, the stenosis corresponds to a 45% area reduction. To generate the numerical model, the images were processed to manually remove small branching vessels and the lumen geometry was segmented in order to obtain cross-sectional contours. Image pixelation effects in the contours were removed with a non-shrinking smoothing algorithm. An automated meshing procedure (Lee et al., 2002; Verma et al., 2005) was used to generate a high-quality mesh with balanced resolution in each branch and minimal deformation for each of the K = 2544 hexahedral elements. Surface curvature was represented by isoparametric mappings derived from C1 bicubic patches on the vessel surface. (The mesh is available on www.biofluids.net/BioMesh.)
Fig. 1.
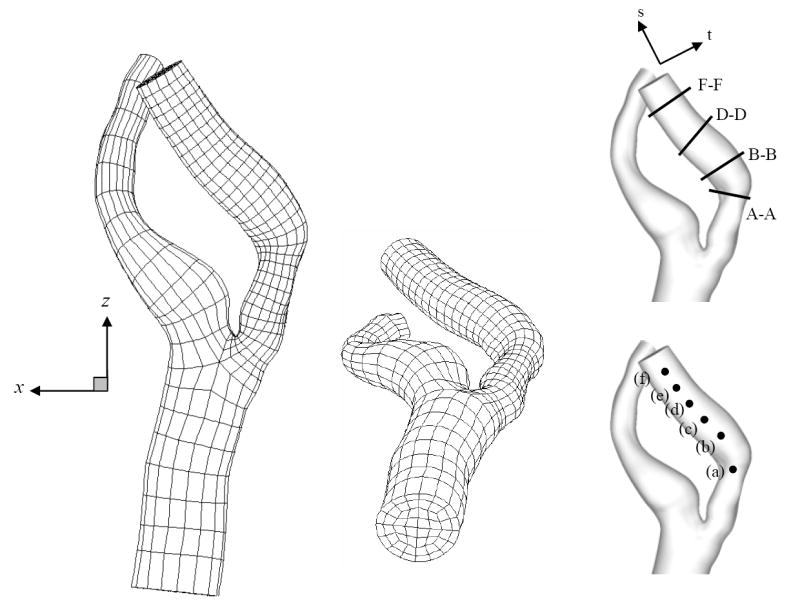
Spectral element mesh with K = 2544 elements based on CT scan images of in vivo stenosed carotid. Insets figure denote the plotting location for velocity time traces (a)-(f) (Fig. 12) and cross-section slices for spatial velocity variation A-A, B-B, D-D and F-F (Figs. 5, 6 and 9).
Color Doppler ultrasound (Acuson 129XP/10, Siemens, Germany) was used to obtain the pulsatile velocity in the carotid bifurcation. A velocity time trace was measured in the CCA, ECA and ICA by positioning the Doppler sample volume on the center of each vessel. The mean centerline velocity during the cardiac cycle was measured to be ~25cm/s, which is slightly lower than values reported by Holdsworth et al. (1999). The blood density and dynamic viscosity were taken to be ρ = 1.05 g/cm3 and μ = 0.035 g/cm-s, respectively. The Reynolds numbers ReCCA = 4ρ Q/π μD based on the CCA inlet diameter D were approximately 266 and 911, for the mean and peak flow rates Q, respectively. The local Reynolds numbers in the ICA stenosis Restenosis = 4 ρ (0.59Q)/πμ Dstenosis were 355 and 1217 for the mean and peak flow rates, respectively. The flow waveform used for the inlet flow boundary condition of the CCA is shown in Fig. 2. The heart rate was 80 beats/min, corresponding to a period of T = 0.75 seconds for one cardiac cycle. The corresponding Womersley number( ) was 5.96.
Fig. 2.
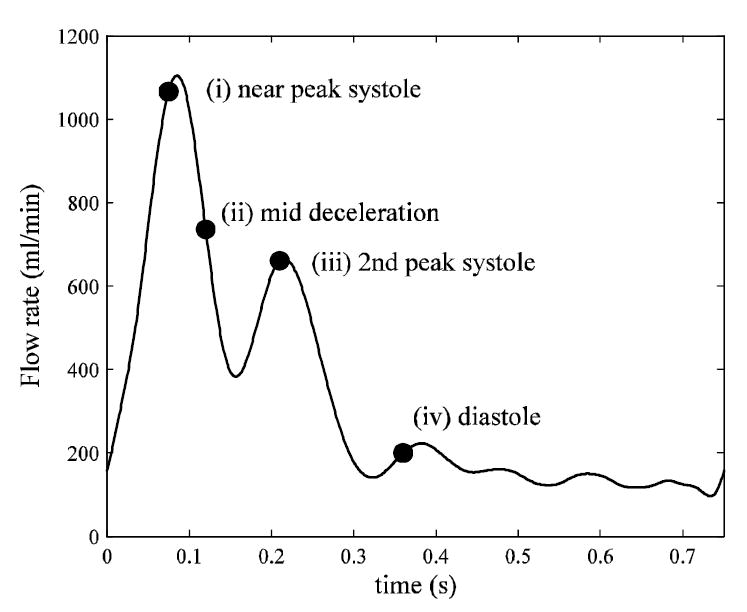
Flow waveform used for inlet flow boundary condition (CCA) based on color Doppler ultrasound measurements in vivo.
The three-dimensional, unsteady, incompressible Navier-Stokes equations were solved with the assumptions of rigid vessel walls and constant viscosity (Newtonian fluid). The boundary conditions imposed at the CCA inlet were Womersley profiles based on the flowrate obtained from the ultrasound measurement. Stress-free boundary conditions were imposed on both ECA and ICA outlets. The flow division was based on the time averaged flow rate through ICA and ECA. The ICA flow rate was obtained from the ECA and CCA flow rate and mass conservation since measurements within the ICA were difficult due to turbulence-induced spectral broadening. Because the relative phase of the flow waveforms was not available, a constant flow division between the ICA and ECA (59:41) was assumed. The division was enforced by adjusting the flow rates at the outlets with auxiliary unsteady Stokes solutions at each time step. Further details of the boundary condition treatment are given in Fischer et al. (2007) and Lee et al. (2007).
The Navier-Stokes equations are discretized using the SEM, which was introduced by Patera (1984). Essentially, a high-order finite element method, the SEM derives from a decomposition of the computational domain into K hexahedral (curvilinear brick) elements coupled with local function representations based on stable tensor-product Lagrange polynomials of degree N, to yield n ~ KN3 gridpoints. As with global spectral methods, the use of tensor-product forms in the SEM allows for matrix-free operator evaluations that require only O(Nn) work and O(n) storage. With typical expansion orders of N = 5-11, the SEM contrasts sharply with the p-type finite element method, which has O(N3n) work and storage complexities and is thus practically limited to N < ~5. The principal attraction of the SEM is that the numerical truncation error decays exponentially with N. The rapid convergence and ability to handle relatively complex domains makes the SEM well suited for the simulation of transitional and weakly turbulent flows where, because of the small physical dissipation, small scale structures persist over relatively long distances and times and can thus accumulate uncontrolled phase errors. As with any numerical method, one must resolve the structures and boundary layers in the flow, which sets a lower bound on n. Once the relevant dynamical structures are resolved, the high-order approximations rapidly reduce the numerical error and are manifestly effective in marginally resolved cases.
Our spectral element code, described in Fischer et al. (2007), is highly parallel, employs high-order stabilizing filters and state-of-the art multilevel solvers. It has been validated by detailed comparisons with laser Doppler anemometry measurements for transitional flow in arteriovenous graft geometries (Lee et al., 2007; Loth et al., 2003). For the current geometry, convergence tests were conducted at peak systolic flow rates with polynomial orders N = 7, 9, and 11 (respectively, ~888,000, ~1,854,000, and ~3,386,000 grid points). The results of the study (Fischer et al., 2007) indicated grid convergence in the ICA mean and r.m.s. velocity distributions at N = 9, which is the value used in the current study. Time integration was based on a third-order semi-implicit scheme with time step dt = 10-5 seconds chosen to satisfy the Courant stability criterion. Once the relevant dynamical structures are resolved, the rapid error reduction attained with high-order methods makes them particularly effective in marginally resolved situations.
Ten cardiac cycles were computed, with each cycle requiring approximately 20 hours of CPU time on 256 processors of the TSC1 platform at Pittsburgh Supercomputing Center. The last six of the cycles were used to obtain the ensemble-averaged velocity field at 50 time points during the cardiac cycle:
where ti := i×T/50, i = 0,…, 50. In addition, we define the velocity fluctuation, u′ := u –<u>, and the square-root of turbulent kinetic energy (STKE), .
Results
The flow remains laminar in the CCA and ECA, but transitions to turbulence within the ICA during the systolic phase. A typical flow structure near peak systole is indicated in Fig. 3, which shows coherent structures identified by the λ2 criterion of Jeong and Hussain (1995). The CCA exhibits a strong central vortex that changes in strength throughout the cardiac cycle but does not change in topology. Flow in the ICA is more complex, with an axially-aligned vortex pair threading through the stenosis and significant vortex break-up in the post-stenotic region. The resultant small scale structures are rapidly advected during systole and give rise to rapid temporal as well as spatial variation in local hemodynamic stresses.
Fig. 3.
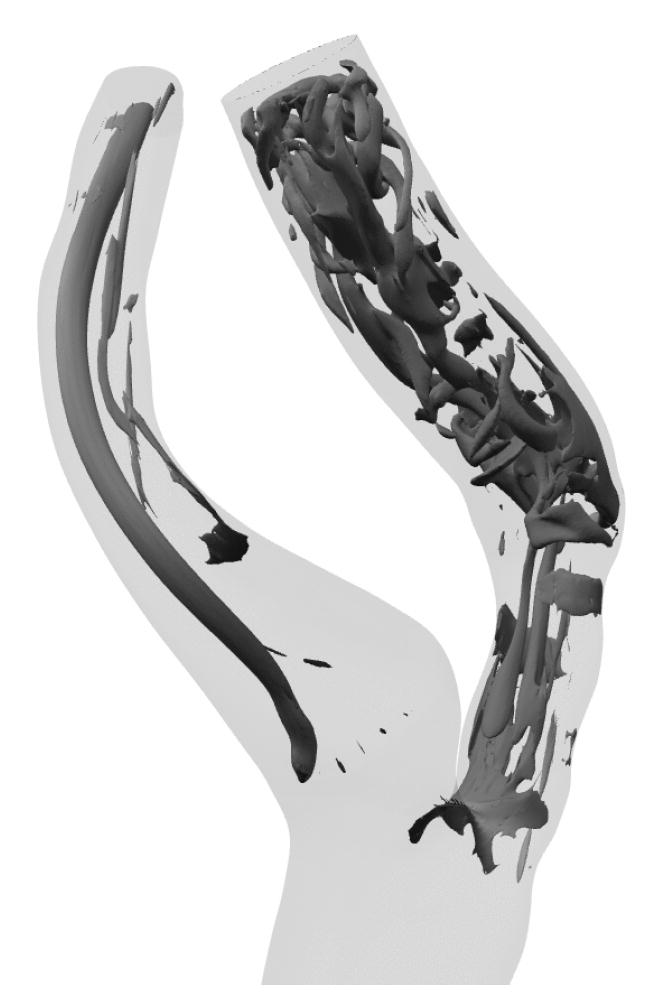
Coherent vortical structures within ICA at systolic peak identified by the λ2 criterion of Jeong and Hussain (1995).
The ensemble-averaged velocity profiles at the mid-plane of the bifurcation are shown in Fig. 4 at four different time points corresponding to: near peak systole, mid-deceleration, near the second systolic peak, and diastole (see time points in Fig. 2). Many of the velocity profiles are skewed towards one wall within the ICA and ECA due to significant curvature. The flow in the CCA retains a Womersley profile until the split between the ICA and ECA. The ICA is relatively straight in the stenosis and then turns sharply inward causing velocity profiles to be skewed toward the outer wall. Throughout the cardiac cycle, the ICA flow separates just downstream of the apex. Farther downstream, the flow separates on both the inner and outer walls, just distal of the stenosis. Strong Dean flow patterns are observed near the peak systole and mid-deceleration phases, as seen in the ensemble-averaged streamwise velocity distributions and instantaneous in-plane distributions of Figs. 5 and 6, respectively. The patterns are, however, asymmetric and rather complex due to the lumen irregularity. The transverse velocity downstream of the stenosis (B-B and D-D) is significant—as high as one-third of the streamwise velocity.
Fig. 4.
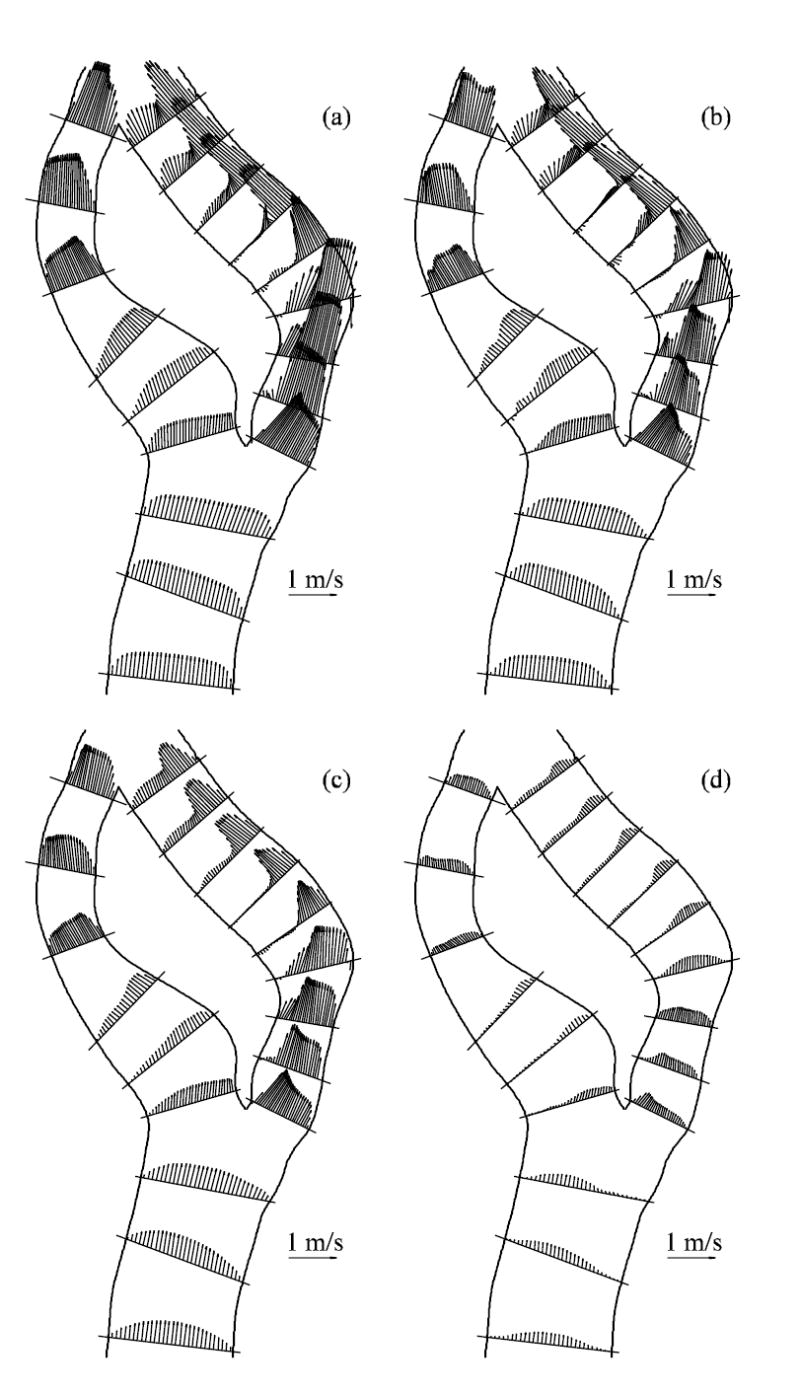
Ensemble-averaged velocity vectors plots on the mid-plane of the bifurcation at various flow phases (a) near peak systole, (b) mid-deceleration phase, (c) near second systolic peak and (d) diastole. See Fig. 2 for time points.
Fig. 5.
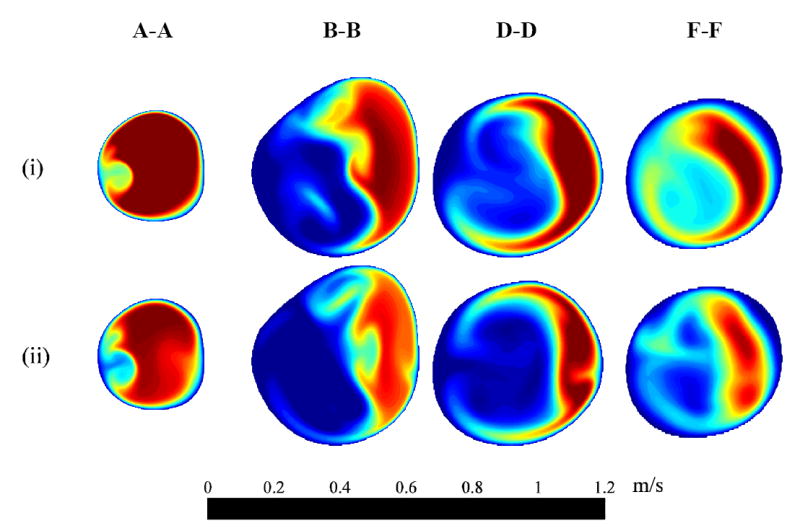
Ensemble-averaged streamwise velocity 〈us〉 distribution at four cross-sections (i) near peak systole and (ii) mid-deceleration phase. See Figs. 1 and 2 for cross-section locations and time points, respectively.
Fig. 6.
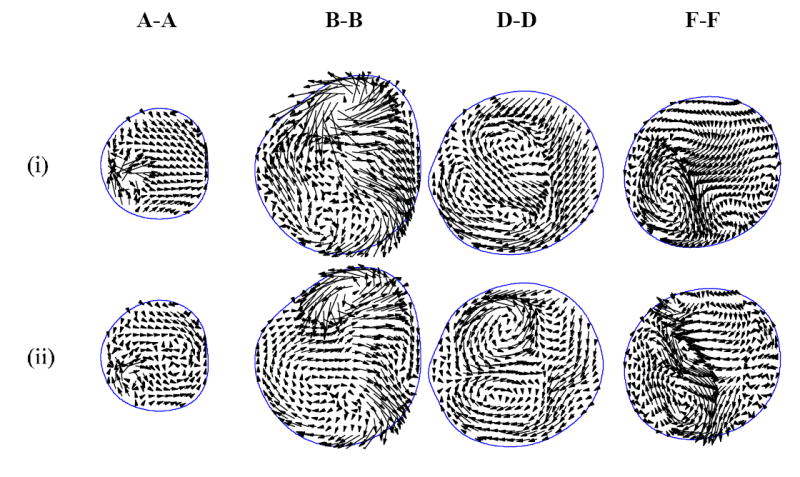
Instantaneous in-plane velocity vectors at four cross-sections (i) near peak systole and (ii) mid-deceleration phase. See Figs. 1 and 2 for cross-section locations and time points, respectively.
The temporal variation of the flow is illustrated in Fig. 7 by contours of instantaneous transverse vorticity, ωy, in the mid-plane surface (passing through the branch centerlines). The flow separates from the apex, forming a long shear layer that does not reattach to the inner wall. This shear layer roughly defines a boundary that separates a slow flow region (left of the shear layer) and high-speed jet associated with the Dean’s flow (right of the shear layer). At near peak systole and mid-deceleration (Fig. 7a and 7b), the shear layer becomes unstable, rolls up and the jet eventually breaks down. The ICA flow becomes nearly laminar prior to the second systolic peak (not shown), and then disturbed to a smaller degree during the second systolic peak (Fig. 7c).
Fig. 7.
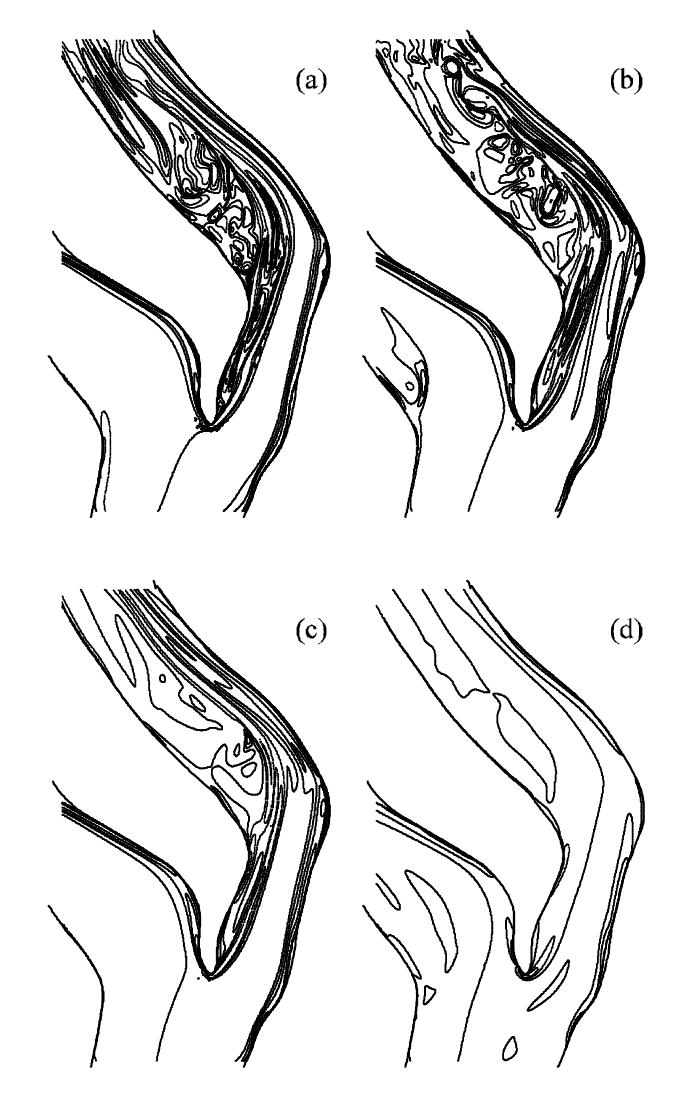
Instantaneous transverse vorticity ωy contour plots on the mid-plane of the bifurcation at various flow phases: (a) near peak systole, (b) mid-deceleration phase, (c) near second systolic peak and (d) diastole (ωy = -2000, -1000, -500, 0, 250, 500, 1000, -500, 0, 250, 500, 2000 s-1). See Fig. 2 for time points.
Fig. 8 shows the STKE distribution at the bifurcation mid-plane. The STKE is greatest in the post-stenotic region and peaks during systolic deceleration. The apex- and stenosis-induced shear layers combine to form a thicker shear layer during systolic acceleration (Fig. 8a). These two layers interact more strongly during mid-deceleration (Fig. 8b). The turbulence is greatly reduced after mid-deceleration but does persist until the diastolic phase begins. The distribution of the Reynolds shear stress (RSS) at various cross-sections is shown in Fig. 9. The RSS is relatively small, though nonzero, at the stenosis exit (A-A). Moving through the post-stenotic region, the RSS distribution progresses from the vessel interior outward towards the walls, clearly indicating that the turbulence observed in this flow is not wall generated but is instead generated by the separation/shear layer phenomena described above.
Fig. 8.
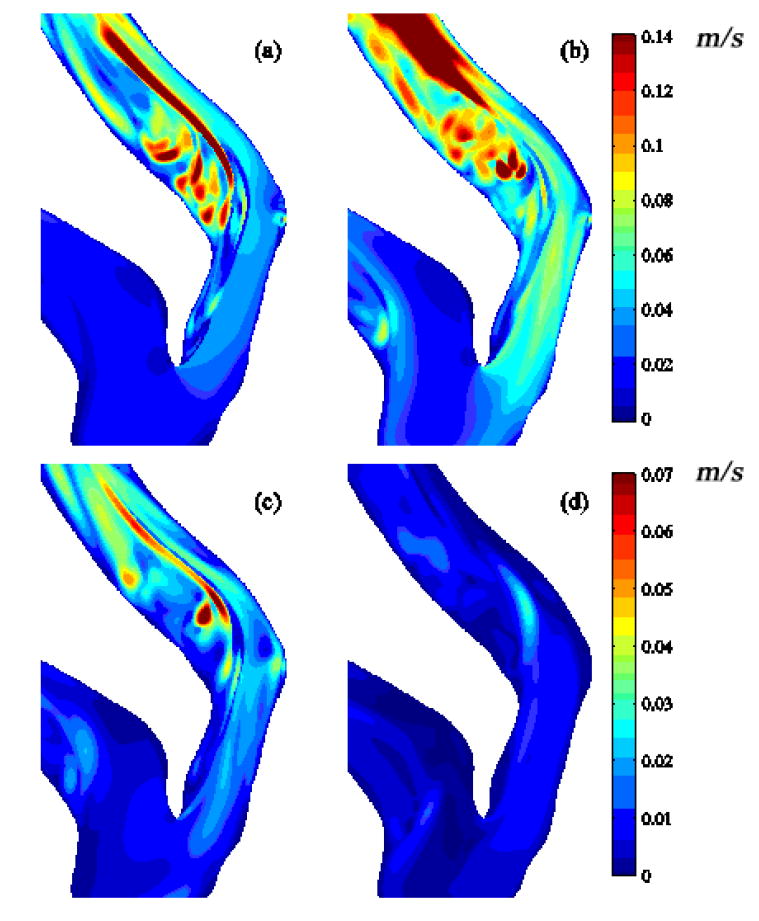
Mid-plane distribution of k½: (a) near peak systole, (b) mid-deceleration phase, (c) near second systolic peak and (d) diastole. See Fig. 2 for time points.
Fig. 9.
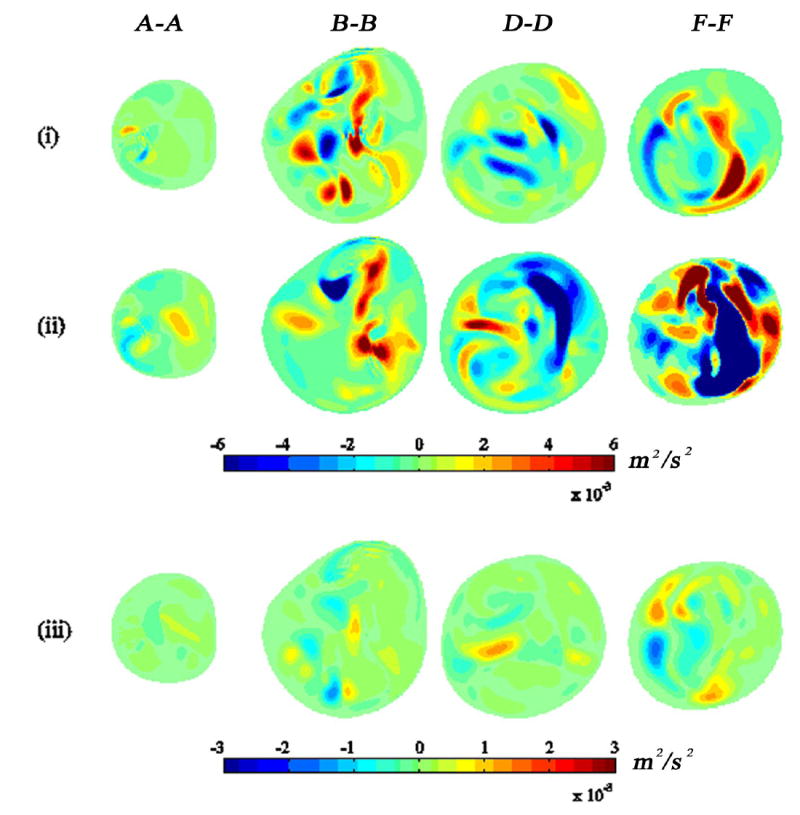
Reynolds shear stress 〈us′ut′〉 at various flow phases: (i) near peak systole, (ii) mid-deceleration phase, and (iii) near second systolic peak at four cross-section locations. See Figs. 1 and 2 for cross-section locations and time points, respectively.
The ensemble-averaged pressure distribution on the wall (Fig. 10) shows generally low pressure downstream of the stenosis and the lowest pressure at the distal end of stenosis. Regions of locally low pressure were located on the inner wall of curvature similar to that for Dean-flow. The ensemble-averaged WSS distribution (Fig. 11) shows high shear stress within stenosis and outer wall of ICA, corresponding to high velocity-gradient with skewed velocity profile. During peak systole, the instantaneous WSS values within the stenosis and at the outer wall where the jet impinges are 25-45 and 35-70 Pa, respectively. Recirculation zones are characterized by patches of low WSS in the ICA, where the largest regions are associated with the apex-induced separation and the stenosis-induced separation along the inner wall.
Fig. 10.
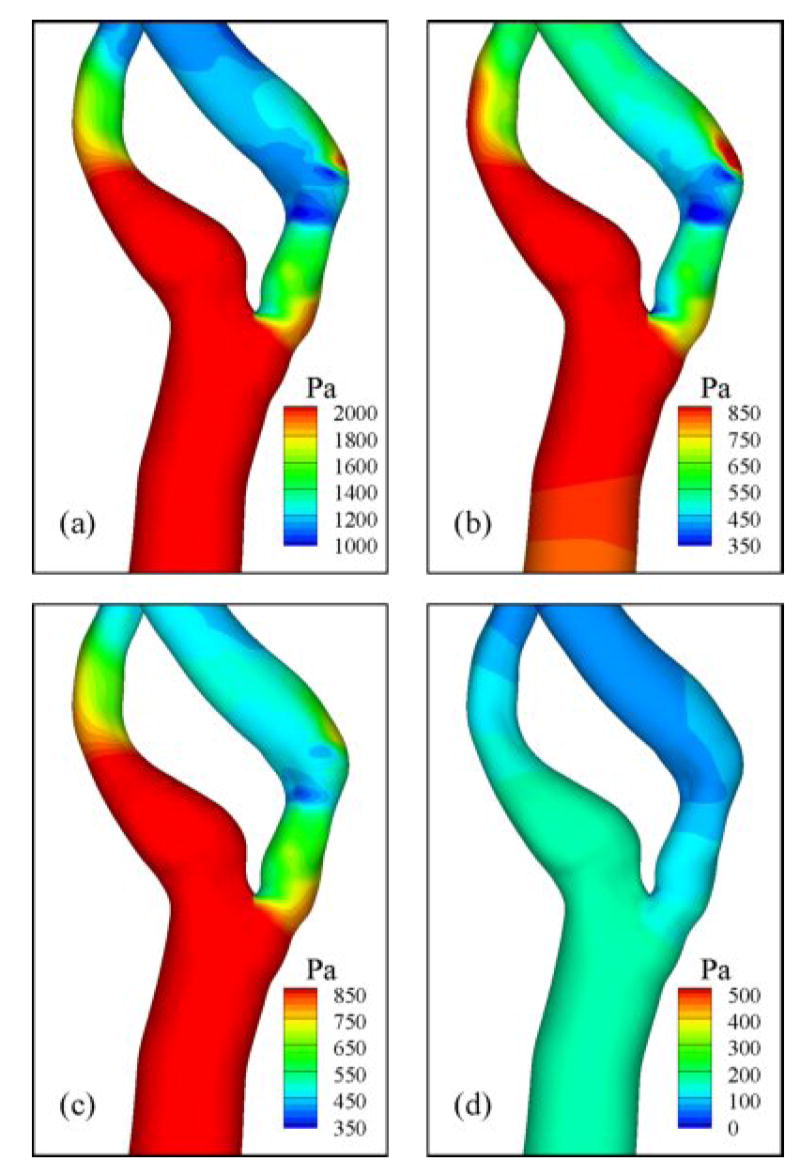
Ensemble-averaged pressure distribution at various flow phases: (a) near peak systole, (b) mid-deceleration phase, (c) near second systolic peak, and (d) diastole. See Fig. 2 for time points.
Fig. 11.
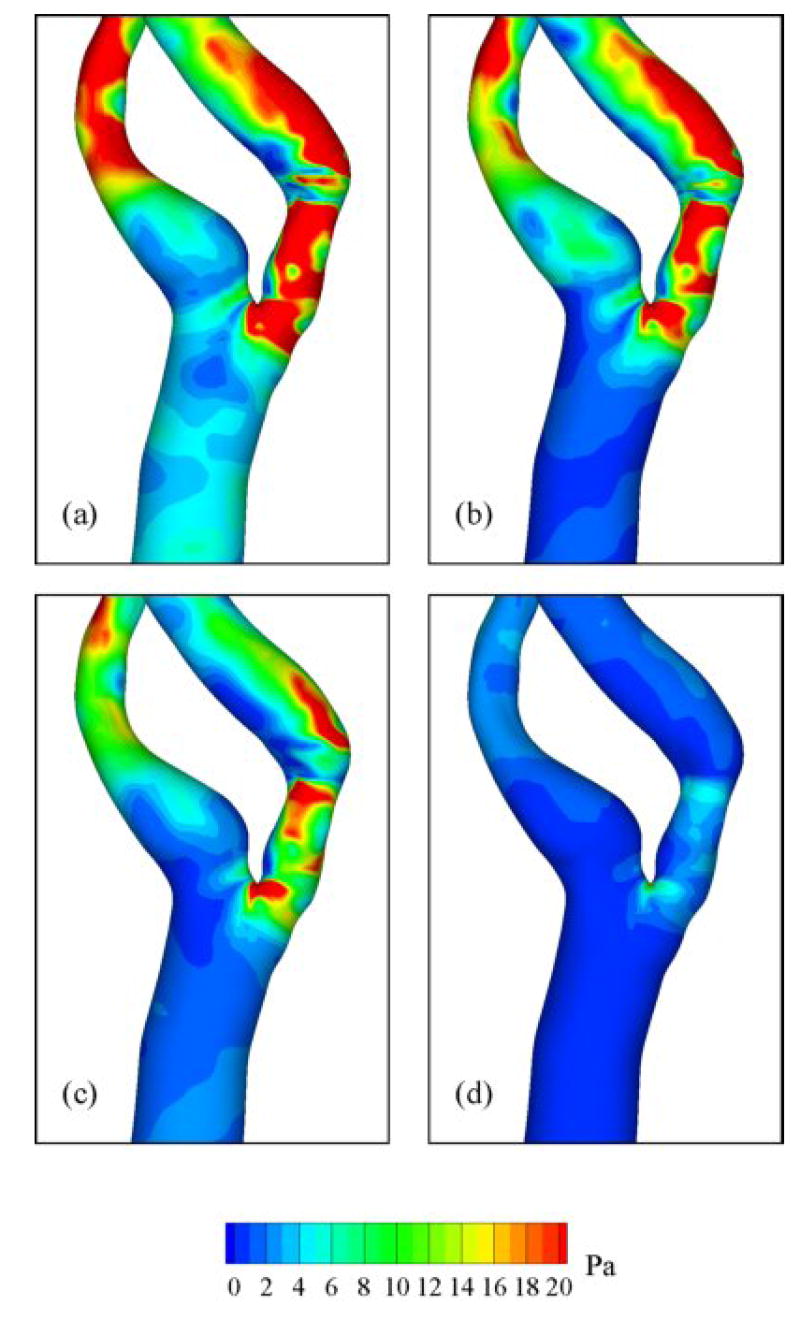
Ensemble-averaged WSS distribution at various flow phases: (a) near peak systole, (b) mid-deceleration phase, (c) near second systolic peak, and (d) diastole. See Fig. 2 for time points.
Detailed temporal characteristics are depicted in the time traces of the axial component of velocity (Fig. 12) for specific locations within the ICA (a–f, see Fig. 1 for locations), where the onset of transitional flow fluctuations can roughly be determined. Flow disturbances with random fluctuations are observed downstream of the stenosis at locations (b)–(f) with the largest fluctuations located at the most distal point (f). Fluctuations were only present during systolic phase. Note that the magnitude of the velocity in the post-stenotic time traces (b-f) is significantly smaller than that at (a) due to the skewed velocity profile, which shifts the peak away from the centerline where the trace data were collected. As one moves distal from the stenosis, there is a general increase in the centerline velocities deriving from the jet break-up and entrainment. The frequency content of the time traces is quantified in Fig. 13, which shows distinct peaks at 60, 120, 160, 200, and 300 Hz at various positions (c)–(f). The shift of the peaks in moving from (e) to (f) is primarily due to the increased centerline velocity at (f), as the alternative explanation of a broadening of the range spatial scales is not indicated (e.g., Figs. 3 and 7).
Fig. 12.
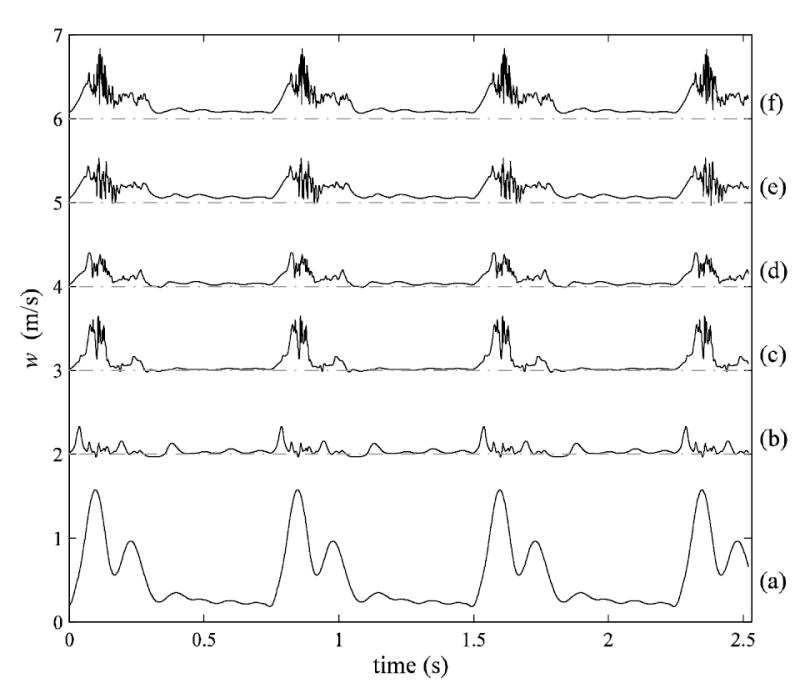
Time traces of z-component velocity at six streamwise locations (see Fig. 1) for four cardiac cycles. There is an offset in velocity at each location to view each trace more clearly.
Fig. 13.
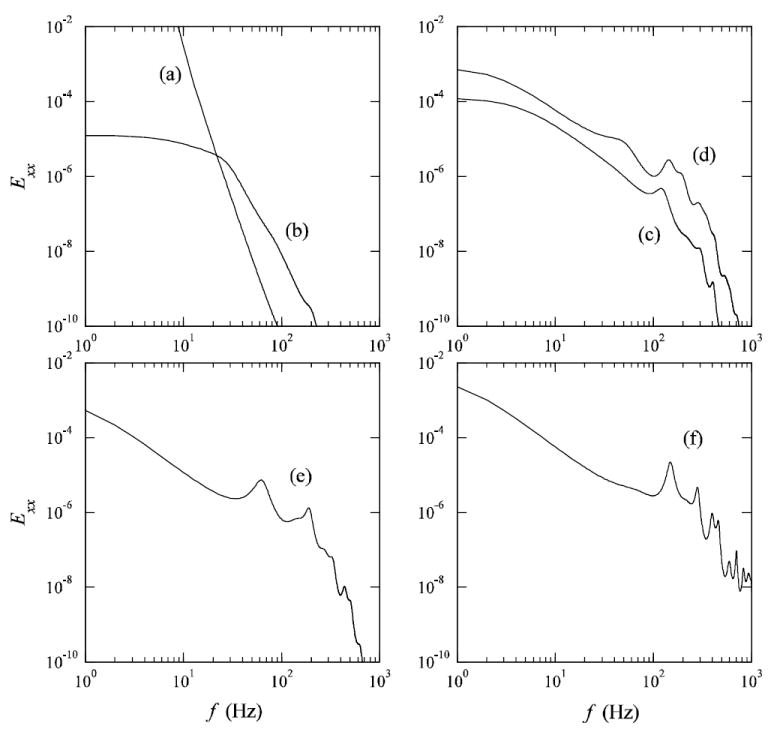
Frequency spectra of z-component velocity corresponding to the time traces in Fig. 12.
Discussion
The present numerical study examines the detailed flow field within a subject-specific carotid bifurcation with a stenosis. The flow is weakly turbulent inside the ICA during the systolic phase and laminar during diastole while it remains laminar within the CCA and ECA throughout the cardiac cycle. Transition to turbulence with high velocity fluctuations is most prominent during the deceleration phase (Figs. 7-9), which is similar to the observation in transient pipe flow by He and Jackson (2000). This elevated disturbance in the decelerating phase was also observed by Long et al. (2001). The jet flow exiting the stenosis and impinging on the outer wall distal to the ICA (Fig. 4) with high WSS (Fig. 11) is characteristic of flow in severe stenosis and has been previously observed (Birchall et al., 2006; Long et al., 2001).
Flow downstream of the stenosis was not a pure periodic oscillation as reported by Plett et al. (2001), but more complex and chaotic (Figs. 7, 8, and 12). Significant turbulence was developed in the separation region about 0.5D downstream of the stenosis and the highest turbulence intensity was present between 1D and 2D downstream of stenosis. The fluctuations in this flow were not restricted to the post-stenotic region, but were also (weakly) present within the stenosis (Fig. 9) near the peak Reynolds number, Restenosis = 1217. The fluctuations in RSS correlated with the location of the vortex pair emanating from the apex of the bifurcation (Fig. 3). The peak RSS was associated with flow separation in the post-stenotic region, rather than resulting from shear at the vessel walls.
High temporal and spatial wall shear stress gradients were observed not only in post-stenotic region, but also within the stenosis. While high WSS is generally expected within the stenosis due to the marked rise in velocity, flow separation and low WSS were identified at the inner wall of stenosis, resulting in high spatial variability of WSS magnitude on the throat of stenosis. Such variability has been implicated in plaque weakening through enhanced mass transport (DePaola et al., 1992).
The smallest (Kolmogorov) scale of eddies for fully developed isotropic turbulence can be estimated using the relationship of η = (ν3/ε)1/4. Here, ν and ε are kinematic viscosity and turbulent dissipation, respectively. This relationship, however, can still provide rough idea of the smallest eddy scale of the post-stenotic flow. Turbulent dissipation can be further approximated by ε ~ (2k/3)3/2/l, where l is the characteristic length of the largest turbulent eddy (the radius of distal ICA was considered). Papoutsakis (1991) found that the turbulent eddies may directly interact with blood elements through energy transfer if their scale is comparable to blood cells. The Kolmogorov length scale of the present simulation was ~67μm during deceleration phase, which is an order of magnitude greater than the typical length scale of an erythrocyte (~7μm). On the other hand, the maximum turbulent Reynolds shear stress was ~29 Pa which is greater than the value (10-16.5 Pa) where platelet damage occurs (Hung et al., 1976; Williams, 1974).
Instantaneous peak-to-peak pressure fluctuation of ~266 Pa (2mmHg) was observed at approximately 2D downstream of the stenosis during systolic deceleration. The largest pressure drop, ~1300 Pa (10 mmHg), between the proximal and distal ends of the stenosis was observed at peak systole. The variation of pressure drop in pulsatile flow produces oscillating compressive stress on the deposited plaque and may increase a risk of plaques rupture. Perktold and Rappitsch (1995) showed that the overall flow characteristics within a healthy carotid did not change significantly with a compliant wall model. Although the presence of the plaque may greatly reduce wall compliance (Cavalcanti, 1995), evidence show that the wall compliance can considerably alter the post-stenotic flow field and subject the stenotic region under significant compressive stresses (Bathe and Kamm, 1999; Tang et al., 2001, Li et al.). Further work will be needed to understand the effect of wall compliance on the flow field in subject-specific, severely diseased carotid as the irregular 3D shape may heighten the effects of wall compliance.
The present simulation has been carried out on the Newtonian assumption. Gijsen et al. (1999) and Chen and Lu (2004) have reported significant difference when a non-Newtonian model was employed in steady bifurcation model. In contrast, Perktold et al. (1991) and Lee and Steinman (2007) showed only minor influence of shear thinning fluid compared to the Newtonian flow.
In conclusion, the present work describes transitional flow patterns within a patient-specific stenosed carotid artery and the resultant biomechanical environment to which the artery walls are exposed. The simulation demonstrated several complex flow features (e.g., vortices in the stenosis interior, strong Dean’s flow, and shear-layer destabilization) associated with the vessel geometry. The transition to a weakly turbulent state was marked by rapid velocity and pressure fluctuations in the post-stenotic region of the internal carotid artery. Further research on patients may help elucidate the role of carotid hemodynamics on plaque vulnerability. Once such relationships are understood, hemodynamic simulations might provide clinically relevant information for risk assessment and surgical planning.
Acknowledgments
This work was supported by the Whitaker Foundation (RG-01-0198); National Institutes of Health, RO1 Grant (2RO1HL55296-04A2); U.S. Dept. of Energy under Contract DE-AC02-06CH11357; the NSF Pittsburgh Supercomputing Center; Computational Science Graduate Fellowship, Office of Science, U.S. Department of Energy; University of Illinois at Chicago Graduate Fellowship; Gates Millennium Scholarship Program, Bill & Melinda Gates Foundation.
Footnotes
Publisher's Disclaimer: This is a PDF file of an unedited manuscript that has been accepted for publication. As a service to our customers we are providing this early version of the manuscript. The manuscript will undergo copyediting, typesetting, and review of the resulting proof before it is published in its final citable form. Please note that during the production process errors may be discovered which could affect the content, and all legal disclaimers that apply to the journal pertain.
References
- Ahmed SA, Giddens DP. Pulsatile poststenotic flow studies with laser Doppler anemometry. Journal of Biomechanics. 1984;17:695–705. doi: 10.1016/0021-9290(84)90123-4. [DOI] [PubMed] [Google Scholar]
- Bathe M, Kamm RD. A fluid-structure interaction finite element analysis of pulsatile blood flow through a compliant stenotic artery. Journal of Biomechanical Engineering. 1999;121:361–369. doi: 10.1115/1.2798332. [DOI] [PubMed] [Google Scholar]
- Birchall D, Zaman A, Hacker J, Davies G, Mendelow D. Analysis of haemodynamic disturbance in the atherosclerotic carotid artery using computational fluid dynamics. European Radiology. 2006;16:1074–1083. doi: 10.1007/s00330-005-0048-6. [DOI] [PubMed] [Google Scholar]
- Caro CG, Fitz-Gerald JM, Schroter RC. Arterial wall shear and distribution of early atheroma in man. Nature. 1969;223:1159–1160. doi: 10.1038/2231159a0. [DOI] [PubMed] [Google Scholar]
- Cassanova RA, Giddens DP. Disorder distal to modeled stenoses in steady and pulsatile flow. Journal of Biomechanics. 1978;11:441–453. doi: 10.1016/0021-9290(78)90056-8. [DOI] [PubMed] [Google Scholar]
- Cavalcanti S. Hemodynamics of an artery with mild stenosis. Journal of Biomechanics. 1995;28:387–399. doi: 10.1016/0021-9290(94)00084-h. [DOI] [PubMed] [Google Scholar]
- Chen J, Lu XY. Numerical investigation of the non-Newtonian blood flow in a bifurcation model with a non-planar branch. Journal of Biomechanics. 2004;37:1899–1911. doi: 10.1016/j.jbiomech.2004.02.030. [DOI] [PubMed] [Google Scholar]
- Davies MJ, Woolf N, Rowles PM, Pepper J. Morphology of the endothelium over atherosclerotic plaques in human coronary arteries. British Heart Journal. 1988;60:459–464. doi: 10.1136/hrt.60.6.459. [DOI] [PMC free article] [PubMed] [Google Scholar]
- Davies PF, Remuzzi A, Gordon EJ, Dewey CF, Jr, Gimbrone MA., Jr Turbulent fluid shear stress induces vascular endothelial cell turnover in vitro. Proceedings of the National Academy of Sciences USA. 1986;83:2114–2117. doi: 10.1073/pnas.83.7.2114. [DOI] [PMC free article] [PubMed] [Google Scholar]
- DePaola N, Gimbrone MA, Jr, Davies PF, Dewey CF., Jr Vascular endothelium responds to fluid shear stress gradients. Arteriosclerosis Thrombosis. 1992;12:1254–1257. doi: 10.1161/01.atv.12.11.1254. [DOI] [PubMed] [Google Scholar]
- Deshpande MD, Giddens DP. Turbulence measurements in a constricted tube. Journal of Fluid Mechanics. 1980;97:65–89. [Google Scholar]
- Fischer PF, Kruse GW, Loth F. Spectral element methods for transitional flows in complex geometries. Journal on Scientific Computing. 2002;17:81–98. [Google Scholar]
- Fischer PF, Loth F, Lee SE, Lee SW, Smith DS, Bassiouny HS. Simulation of high Reynolds number vascular flows. Computer Methods in Applied Mechanics and Engineering. 2007;196:3049–3060. [Google Scholar]
- Fry DL. Acute vascular endothelial changes associated with increased blood velocity gradients. Circulation Research. 1968;22:165–197. doi: 10.1161/01.res.22.2.165. [DOI] [PubMed] [Google Scholar]
- Gertz SD, Roberts WC. Hemodynamic shear force in rupture of coronary arterial atherosclerotic plaques. American Journal of Cardiology. 1990;66:1368–1372. doi: 10.1016/0002-9149(90)91170-b. [DOI] [PubMed] [Google Scholar]
- Ghalichi F, Deng X, De Champlain A, Douville Y, King M, Guidoin R. Low reynolds number turbulence modeling of blood flow in arterial stenoses. Biorheology. 1998;35:281–294. doi: 10.1016/s0006-355x(99)80011-0. [DOI] [PubMed] [Google Scholar]
- Gijsen FJ, van de Vosse FN, Janssen JD. The influence of the non-Newtonian properties of blood on the flow in large arteries: Steady flow in a carotid bifurcation model. Journal of Biomechanics. 1999;32:601–608. doi: 10.1016/s0021-9290(99)00015-9. [DOI] [PubMed] [Google Scholar]
- Glagov S, Zarins CK, Giddens DP, Ku DN. Hemodynamics and atherosclerosis. Insights and perspectives gained from studies of human arteries. Archives of Pathology and Laboratory Medicine. 1988;112:1018–1031. [PubMed] [Google Scholar]
- He S, Jackson JD. A study of turbulence under conditions of transient flow in a pipe. Journal of Fluid Mechanics. 2000;408:1–38. [Google Scholar]
- Hellums JD. The resistance to oxygen transport in the capillaries relative to that in the surrounding tissue. Microvascular Research. 1977;13:131–136. doi: 10.1016/0026-2862(77)90122-4. [DOI] [PubMed] [Google Scholar]
- Holdsworth DW, Norley CJ, Frayne R, Steinman DA, Rutt BK. Characterization of common carotid artery blood-flow waveforms in normal human subjects. Physiological Measurement. 1999;20:219–240. doi: 10.1088/0967-3334/20/3/301. [DOI] [PubMed] [Google Scholar]
- Hung TC, Hochmuth RM, Joist JH, Sutera SP. Shear-induced aggregation and lysis of platelets. Transactions American Society for Artificial Internal Organs. 1976;22:285–291. [PubMed] [Google Scholar]
- Ku DN, Giddens DP, Zarins CK, Glagov S. Pulsatile flow and atherosclerosis in the human carotid bifurcation. Positive correlation between plaque location and low oscillating shear stress. Arteriosclerosis. 1985;5:293–302. doi: 10.1161/01.atv.5.3.293. [DOI] [PubMed] [Google Scholar]
- Lee SE. M.S thesis. University of Illinois at Chicago; Chicago: 2002. Solution method for transitional flow in a vascular bifurcation based on in vivo medical images. [Google Scholar]
- Lee S-W, Smith DS, Loth F, Fischer PF, Bassiouny HS. Experimental and numerical simulation of transitional flow in a blood vessel junction. Numerical Heat Transfer Part A. 2007;51:1–22. [Google Scholar]
- Lee S-W, Steinman DA. On the relative importance of rheology for image-based CFD models of the carotid bifurcation. Journal of Biomechanical Engineering. 2007;129:273–278. doi: 10.1115/1.2540836. [DOI] [PubMed] [Google Scholar]
- Li M, Beech-Brandt JJ, Easson WJ, Hoskins PR. Numerical Simulation of Pulsatile Flow Through a Compliant Stenotic Tube. Proceedings of the Third IASTED International Conference on Biomechanics. 2005:157–162. [Google Scholar]
- Lieber BB, Giddens DP. Post-stenotic core flow behavior in pulsatile flow and its effects on wall shear stress. Journal of Biomechanics. 1990;23:597–605. doi: 10.1016/0021-9290(90)90052-5. [DOI] [PubMed] [Google Scholar]
- Long Q, Xu XY, Ramnarine KV, Hoskins P. Numerical investigation of physiologically realistic pulsatile flow through arterial stenosis. Journal of Biomechanics. 2001;34:1229–1242. doi: 10.1016/s0021-9290(01)00100-2. [DOI] [PubMed] [Google Scholar]
- Loree HM, Kamm RD, Atkinson CM, Lee RT. Turbulent pressure fluctuations on surface of model vascular stenoses. American Journal Physiology. 1991;261:H644–650. doi: 10.1152/ajpheart.1991.261.3.H644. [DOI] [PubMed] [Google Scholar]
- Loth F, Fischer PF, Arslan N, Bertram CD, Lee SE, Royston TJ, Shaalan WE, Bassiouny HS. Transitional flow at the venous anastomosis of an arteriovenous graft: Potential activation of the erk1/2 mechanotransduction pathway. Journal of Biomechanical Engineering. 2003;125:49–61. doi: 10.1115/1.1537737. [DOI] [PubMed] [Google Scholar]
- Mittal SP, Simmons SP, Najjar F. Numerical study of pulsatile flow in a constricted channel. Journal of Fluid Mechanics. 2003;485:337–378. [Google Scholar]
- Murray CJ, Lopez AD. Alternative projections of mortality and disability by cause 1990-2020: Global burden of disease study. Lancet. 1997;349:1498–1504. doi: 10.1016/S0140-6736(96)07492-2. [DOI] [PubMed] [Google Scholar]
- Nagel T, Resnick N, Dewey CF, Jr, Gimbrone MA., Jr Vascular endothelial cells respond to spatial gradients in fluid shear stress by enhanced activation of transcription factors. Arteriosclerosis, Thrombosis, and Vascular Biology. 1999;19:1825–1834. doi: 10.1161/01.atv.19.8.1825. [DOI] [PubMed] [Google Scholar]
- Ojha M. Wall shear stress temporal gradient and anastomotic intimal hyperplasia. Circulation Research. 1994;74:1227–1231. doi: 10.1161/01.res.74.6.1227. [DOI] [PubMed] [Google Scholar]
- Papoutsakis ET. Fluid-mechanical damage of animal cells in bioreactors. Trends in Biotechnology. 1991;9:427–437. doi: 10.1016/0167-7799(91)90145-8. [DOI] [PubMed] [Google Scholar]
- Patera AT. A spectral element method for the Navier-Stokes equations. Journal of Computational Physics. 1984;54:468–488. [Google Scholar]
- Perktold K, Rappitsch G. Computer simulation of local blood flow and vessel mechanics in a compliant carotid artery bifurcation model. Journal of Biomechanics. 1995;28:845–856. doi: 10.1016/0021-9290(95)95273-8. [DOI] [PubMed] [Google Scholar]
- Perktold K, Resch M, Florian H. Pulsatile non-newtonian flow characteristics in a three-dimensional human carotid bifurcation model. Journal of Biomechanical Engineering. 1991;113:464–475. doi: 10.1115/1.2895428. [DOI] [PubMed] [Google Scholar]
- Plett MI, Beach KW, Dunmire B, Brown KG, Primozich JF, Strandness E., Jr In vivo ultrasonic measurement of tissue vibration at a stenosis: A case study. Ultrasound in Medicine and Biology. 2001;27:1049–1058. doi: 10.1016/s0301-5629(01)00408-2. [DOI] [PubMed] [Google Scholar]
- Ramstack JM, Zuckerman L, Mockros LF. Shear-induced activation of platelets. Journal of Biomechanics. 1979;12:113–125. doi: 10.1016/0021-9290(79)90150-7. [DOI] [PubMed] [Google Scholar]
- Ryval J, Straatman AG, Steinman DA. Two-equation turbulence modeling of pulsatile flow in a stenosed tube. Journal of Biomechanical Engineering. 2004;126:625–635. doi: 10.1115/1.1798055. [DOI] [PubMed] [Google Scholar]
- Sherwin SJ, Blackburn HM. Three-dimensional instabilities and transition of steady and pulsatile axisymmetric stenotic flows. Journal of Fluid Mechanics. 2005;533:297–327. [Google Scholar]
- Stroud JS, Berger SA, Saloner D. Numerical analysis of flow through a severely stenotic carotid artery bifurcation. Journal of Biomechanical Engineering. 2002;124:9–20. doi: 10.1115/1.1427042. [DOI] [PubMed] [Google Scholar]
- Tang D, Yang C, Kobayashi S, Ku DN. Steady flow and wall compression in stenotic arteries: A three-dimensional thick-wall model with fluid-wall interactions. Journal of Biomechanical Engineering. 2001;123:548–557. doi: 10.1115/1.1406036. [DOI] [PubMed] [Google Scholar]
- Thomas JB, Antiga L, Che SL, Milner JS, Steinman DA, Spence JD, Rutt BK. Variation in the carotid bifurcation geometry of young versus older adults: Implications for geometric risk of atherosclerosis. Stroke. 2005;36:2450–2456. doi: 10.1161/01.STR.0000185679.62634.0a. [DOI] [PubMed] [Google Scholar]
- Varghese SS, Frankel SH. Numerical modeling of pulsatile turbulent flow in stenotic vessels. Journal of Biomechanical Engineering. 2003;125:445–460. doi: 10.1115/1.1589774. [DOI] [PubMed] [Google Scholar]
- Varghese SS, Frankel SH, Fischer P. Direct Numerical Simulation of Stenotic Flows, Part I: Steady Flow. Journal of Fluid Mechanics. 2007a;582:253–280. [Google Scholar]
- Varghese SS, Frankel SH, Fischer P. Direct Numerical Simulation of Stenotic Flows, Part II: Pulsatile Flow. Journal of Fluid Mechanics. 2007b;582:281–318. [Google Scholar]
- Verma C, Fischer PF, Lee SE, Loth F. An all-hex meshing strategy for bifurcation geometries in vascular flow simulation. Proceedings of 14th International Meshing Roundtable Conference; San-Deigo, CA. 2005. [Google Scholar]
- White CR, Haidekker M, Bao X, Frangos JA. Temporal gradients in shear, but not spatial gradients, stimulate endothelial cell proliferation. Circulation. 2001;103:2508–2513. doi: 10.1161/01.cir.103.20.2508. [DOI] [PubMed] [Google Scholar]
- Williams AR. Release of serotonin from human platelets by acoustic microstreaming. Journal of the Acoustical Society of America. 1974;56:1640–1649. doi: 10.1121/1.1903490. [DOI] [PubMed] [Google Scholar]
- Younis BA, Berger SA. A turbulence model for pulsatile arterial flows. Journal of Biomechanical Engineering. 2004;126:578–584. doi: 10.1115/1.1798032. [DOI] [PubMed] [Google Scholar]
- Zarins CK, Giddens DP, Bharadvaj BK, Sottiurai VS, Mabon RF, Glagov S. Carotid bifurcation atherosclerosis. Quantitative correlation of plaque localization with flow velocity profiles and wall shear stress. Circulation Research. 1983;53:502–514. doi: 10.1161/01.res.53.4.502. [DOI] [PubMed] [Google Scholar]