

Abstract
A previous study (1) suggested that individuals with Gulf War Illness (GWI) had reduced quantities of the neuronal marker N-acetyl aspartate (NAA) in the basal ganglia and pons. This study aimed to determine whether NAA is reduced in these regions and to investigate correlations with other possible causes of GWI, such as psychological response to stress in a large cohort of Gulf war veterans. Individuals underwent tests to determine their physical and psychological health and to identify veterans with (n=81) and without (n=97) GWI. When concentrations of NAA and ratios of NAA to creatine- and choline-containing metabolites were measured in the basal ganglia and pons, no significant differences were found between veterans with or without GWI, suggesting that GWI is not associated with reduced NAA in these regions. Veterans with GWI had significantly higher rates of Post Traumatic Stress Disorder (PTSD), supporting the idea that GWI symptoms are stress-related.
Keywords: Gulf War Illness, N-acetyl aspartate, post traumatic stress disorder, Haley Syndrome, magnetic resonance spectroscopic imaging
INTRODUCTION
Gulf War Illness (GWI) is a multi-symptom condition reported by veterans of the 1990–1991 Gulf war (2,3). Symptoms, unexplained by standard clinical diagnoses, include chronic fatigue, neurological symptoms and neurocognitive impairment among others (4). While a variety of causative agents have been proposed, including exposure to stress (5), depleted uranium (6), vaccinations (7), pyridostygmine bromide (8), pesticides (9), sarin (10) and others (9), it is not clear which is the most likely causative factor (11,12,13).
Haley et al. used magnetic resonance spectroscopy (MRS) to examine the resonances of three major brain chemicals, NAA and creatine- and choline- containing metabolites (Cr and Cho, respectively) in 22 individuals with GWI (1, 14). In the basal ganglia and pons of subjects with GWI (1) and particularly in a subgroup of 12 individuals with neurological symptoms termed Syndrome 2, there was a decreased ratio of NAA to Cr (NAA/Cr), indicating decreased neuronal mass (15). Symptomatic individuals had lower levels of the Q alloform of the PON1 gene product, a paraoxonase involved in organophosphate metabolism (16), suggesting that reduced neuronal mass due to exposure to sarin nerve gas during deployment could explain the symptoms of GWI in terms of regional brain injury (17).
Our goals were to replicate these results in a larger sample of Gulf War veterans and to investigate the relationships of GWI to NAA concentrations or NAA ratios, alcohol consumption, depression, neuropsychological tests, PTSD status and symptoms and PON1 enzyme activity. We used magnetic resonance spectroscopic imaging (MRSI) to measure metabolites in larger samples in the same brain regions and in the gray matter (GM) and white matter (WM) of the major lobes, the hippocampus and the brainstem and explored correlations between GWI symptoms and NAA, Cr, and Cho measures from these regions.
MATERIALS AND METHODS
This study was approved by the UCSF and VA Committees on Human Research, and the Department of Defense Human Subjects Research Review Board (Fort Detrick, MD). All patients provided informed consent prior to study.
Research participants
Gulf War veterans were recruited between 2002 and 2007 through contacts with physicians at VA GWI clinics in Northern California, fliers distributed to Veterans hospitals and clinics, brochures distributed to other programs serving Gulf War veterans and 30,219 recruitment letters mailed to a list of veterans of the Gulf War provided to us by the Department of Defense. The purpose of the study was made clear to all potential research participants.
A screening phone call established that potential participants had served in the Persian Gulf War (this was later verified through VA records) and excluded individuals with potentially confounding factors such as a history of psychotic or neurologic illnesses that could account for GWI symptoms or the inability to undergo the neuroimaging studies due to metallic implants or severe claustrophobia.
Exclusionary medical or neurological/psychiatric conditions that could explain GWI symptoms were identified by a general medical exam, standard clinical blood tests and a Structured Clinical Interview for DSM-IV Disorders (SCID) (18).
GWI was diagnosed using three different questionnaires based on the Center for Disease Control (CDC) criteria, primarily symptoms of musculoskeletal pain, fatigue and neurocognitive dysfunction following deployment to the Persian Gulf War zone, and administered on three separate occasions. We classified individuals as having GWI (n=81) if they endorsed at least two of the same symptoms on all three questionnaires. Controls (n=97) endorsed no single symptom more than once, and Intermediates (n=101) had all other combinations of responses. We administered a self report questionnaire provided by Dr. Haley identical to that used in previous reports to further categorize the individuals with GWI into three distinct primary Haley syndromes (19). As Syndrome 2, “Confusion-ataxia”, characterized by problems with balance and thinking, is considered the most severe (20, 21), we included only these individuals in the statistical analysis in an effort to reveal more statistically significant relationships.
Clinical tests
We used the Clinician Administered PTSD Scale (CAPS) (22) both for a categorical PTSD diagnosis and as a continuous measure of PTSD symptoms and the PTSD Checklist (23) and the Mississippi Combat Scale (24) to assess self report PTSD symptoms. We also administered the Lifetime Drinking History (25) and the Hamilton Depression Scale tests to screen for other potential confounding factors.
Participants underwent a brief neurological screening to assess mental status, cranial nerves, motor status, coordination, gait and sensory function. All participants were given neuropsychological tests including the Wechsler Adult Intelligence Scale III (Wechsler,1997), Test of Memory Malingering (27), Conner’s Continuous Performance Test (28), Wechsler Memory Scale III logical memory subtest (29), Brief Visuospatial Memory Test (30), Trail Making Tests A & B (31,32,33), California Verbal Learning Test (34), Grooved Pegboard (35,36), Wide Range Achievement Test III reading and spelling subtests (37), Short Categories Test (38) and Controlled Oral Word Association Test FAS and Animals (39,40). Grip strength (41) was measured to assess lateralizing brain damage. The Fregly Ataxia Test (42) was administered to quantify motor function as a possible indicator of changes in the basal ganglia. Participants completed series of self-report questionnaires including the Pittsburgh Sleep Quality Index (43), Trauma History Questionnaire (44), Symptom Checklist-90-Revised (45), Beck Depression Inventory (46), Disease Burden Assessment (SF-36V) (47) and Desert Storm Trauma Questionnaire (48).
PON1 genotype and activity was determined using published methods (49).
Magnetic resonance
Spectroscopy - Day 1
MRI and 1H MRS: 3D T1-weighted gradient echo MRI (MPRAGE, TR/TE/TI = 10/4/300 ms, (1 × 1 × 1.5) mm3 resolution, angulated perpendicular to the long axis of the hippocampus); DSE MRI (TR/TE1/TE2 = 5000/20/80 ms, (1 × 1 × 3) mm2 resolution, 50 contiguous slices angulated along an imaginary line connecting the genu and splenium of the corpus callosum −10°); PRESS (Point-Resolved Spectroscopy) 1H MRS single volume spectroscopy from left and right basal ganglia and from the pons (TR/TE = 1800/135 ms, 256 averages; basal ganglia spectra centered on the border between putamen and globus pallidus: (20 × 40 × 16) mm3 left-right × anterior-posterior × inferior-superior; pons (17 × 17 × 17) mm3) (Figure 1).
Figure 1.
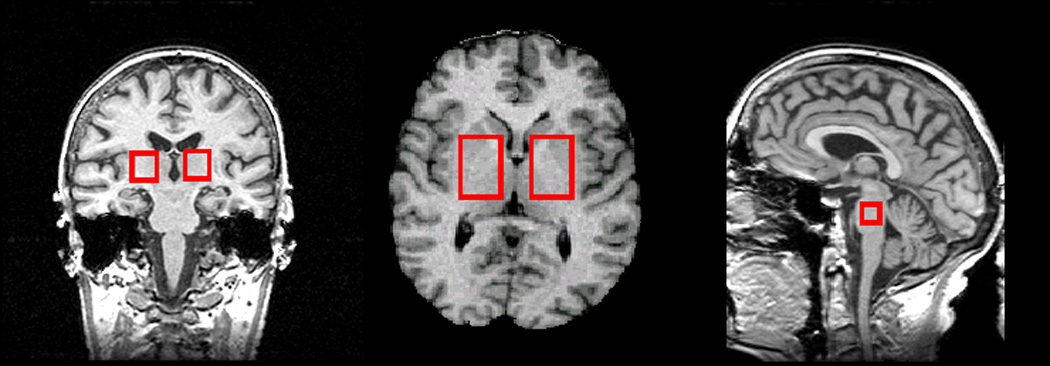
Voxel placement in the right and left basal ganglia (left and middle) and pons (right) for single voxel MR spectroscopy (see Methods for details).
Spectroscopy - Day 2
MRI sequences from day one were repeated, followed by multislice 1H MRSI (TR/TE/TI = 1970/135/170 ms, three laterally unrestricted axially oblique 15 mm thick slices, angulated as the DSE MRI, (280 × 280) mm2 field-of-view, 36 × 36 phase encoding steps with circular k-space sampling). Typical slice positioning (Figure 2) allowed imaging of metabolites in the basal ganglia, the WM and GM of all major lobes, midbrain and cerebellum. Lastly, we acquired 1H PRESS MRSI in the mesial temporal lobe including the hippocampus (TR/TE = 1800/135 ms, the PRESS volume of (100 × 80 × 15) mm3 angulated along the long axis of the hippocampus, (210 × 210) mm2 field-of-view, 24 × 24 phase encoding steps with circular k-space sampling).
Figure 2.

Slice placement for multislice MR spectroscopic imaging (MRSI)
MRI and MRS, and MRSI processing
Whole brain three-tissue intensity based segmentation was rendered on T1-weighted MRI, which assigned a probability of WM, GM or cerebrospinal fluid (CSF) to each slice as previously described (50). Using a non-linear fluid transformation, we warped each brain to a marked atlas template to determine lobar regions and sub-cortical nuclei in each subject (50). We combined these localized markings with the segmentation results to obtain right and left frontal, temporal, parietal and occipital volumes of GM, WM and CSF for each subject, in addition to volumes of brainstem, cerebellum and right and left thalami, lenticular nuclei and caudate. Automated baseline correction and fitting of MRS data used a parametric model of known spectral components (metabolites) to fit metabolite resonances and a nonparametric fit of the baseline (51,52,53). Resonances for NAA, Cr- and Cho-containing metabolites were fitted and peak area ratios calculated. For absolute metabolite quantification, peak areas were normalized to the median signal intensity from CSF in the lateral ventricles determined from the proton-density-weighted MRI obtained in the same session as the metabolite data. To account for different GM, WM and CSF contributions to the spectral regions of interest between subject, the subject-specific spectroscopy voxels were aligned with the corresponding subject-specific tissue-segmented and lobar labeled MRI data obtained in the same imaging session and tissue fractions were calculated as previously described (54). Due to both excessive patient movement during MRI and technical problems with the additional quantitation procedures, about 25% of spectra (equally distributed across the three groups) were unavailable for molar quantitation. Spectral processing yielded NAA, Cr, and Cho concentrations in institutional units (i.u.), not corrected for relaxation times, as well as ratios of NAA/Cr, NAA/Cho, Cr/Cho and NAA/(Cr+Cho) in pons, cerebellum, midbrain, and right and left basal ganglia and from WM and GM in the frontal, parietal, temporal and occipital lobes.
Statistical Analysis
Statistical analysis was aimed at detection of a significant group effect for Gulf War Illness diagnosis or Haley Syndrome 2. Participants with Intermediate diagnosis of GWI were excluded from initial analysis as our aim compared GWI with controls. The linear modeling framework (55) was used to determine effects of GWI or Haley Syndrome 2 diagnostic groups on all outcomes. The response variable of the model was the MRI/MRS/MRSI regional measure and the explanatory variables were group (Gulf War status or Haley Syndrome 2 status), gender, age, CAPS score, Beck Depression Inventory score and total lifetime drinking. The models were fitted using SAS 8.2 (http://www.sas.com). A hierarchical design was used in which a set of plausible models was assessed by the sequential addition or removal of variables. Nested models were compared using F-tests applied across all outcome measures of a particular type, i.e. from a particular imaging type (MRI, MRS or MRSI) or across all neuropsychological outcome measures. The explanatory covariates were retained for all outcomes of a type provided they were significant for a large proportion (>20%) of outcomes at the alpha = 10% level or if they were considered scientifically imperative to include. The uniformity of the model was imposed within each outcome type to ensure consistent model structure across outcome measures, enabling the comparison of results across outcomes and avoiding overfitting. The simultaneous testing strategy also helped to eliminate confounding variables and the problem of chance variables being found significant. Because gender was a significant covariate for many regional MRI, MRS and MRSI measures and the number of females was small, the analysis was re-run using data from the males only and the gender variable omitted.
RESULTS
Study group characteristics
Persian Gulf War veterans were solicited primarily through fliers and direct mailing. Approximately 1384 packets of information about the study were mailed to veterans who then passed the screening phone call and 279 veterans with no exclusionary factors underwent all research related procedures generally completed within two days.
There were no significant differences of age, education, gender, race, military status at the beginning of the Gulf War conflict or military status at the time of the study between the GWI, intermediate and control groups (Table 1). However, individuals with GWI had a significantly higher rate of PTSD as diagnosed by the DSM-IV criteria and a significantly higher CAPS score, indicating greater PTSD symptomatology (Table 1).
Table 1.
Characteristics of study groups.
| Control | Intermediate | Gulf War Illness | ||
|---|---|---|---|---|
| n (female) | 97 (15) | 101 (7) | 81 (7) | |
| Haley Syndrome 2 | 2 | 9 | 21 | |
| Age (years) | 44.6 ± 9.9 | 45.1 ± 9.8 | 44.6 ± 8.8 | |
| Education (years) | 14.7 ± 2.1 | 14.6 ± 2.9 | 14.3 ± 1.8 | |
| Race (n) | White | 61 | 58 | 52 |
| Black | 16 | 15 | 11 | |
| Hispanic | 9 | 16 | 9 | |
| American Indian | 0 | 2 | 1 | |
| Asian | 3 | 3 | 2 | |
| Pacific Islander | 4 | 2 | 2 | |
| Other | 4 | 3 | 2 | |
| No data | 0 | 2 | 2 | |
| Military status at start of Operation Desert Shield (n) | Active duty | 70 | 68 | 58 |
| National Guard | 9 | 8 | 6 | |
| Reserves | 17 | 23 | 15 | |
| Non-military civilian | 1 | 0 | 0 | |
| No data | 0 | 2 | 2 | |
| Present Military status (n) | Active duty | 0 | 1 | 0. |
| National Guard | 4 | 4 | 1 | |
| Reserves | 16 | 8 | 6 | |
| Civilian | 77 | 86 | 72 | |
| No data | 0 | 2 | 2 | |
| Current CAPS Score | 6.0 ±2.1* | 18.9 ±24.9* | 28.2 ±29.2* | |
| individuals with PTSD (%) | 3.1 ** | 17.8 ** | 34.6 ** | |
N= total number of individuals. Number of females included in the total given in parentheses.
PTSD = meets DSM-IV criteria for diagnosis, 3 individuals do not have these data.
CAPS score range: 0–136, comprising 17 PTSD symptoms: Each symptom can be scored 0–8
p<0.05, Kruskal-Wallis χ2 test indicates groups differ significantly, GWI> Intermediate, Control
p<0.05 χ2 test indicates groups differ significantly, GWI> Intermediate, Control
PON1 genotype and enzymatic activities
There were no differences in PON1 genotype, or paraoxonase activity between non-symptomatic veteran controls and those with GWI or Haley Type 2 syndrome (data not shown).
Concentrations and ratios of brain metabolites
MRS studies showed that all study groups had very similar measures of regional metabolite concentrations. No statistically significant differences were found between metabolite concentrations of individuals with GWI and the control group using either standard t-tests that did not account for other variables, or the full linear model. Absolute metabolite concentrations and the resonance area ratios for the right basal ganglia (mean +/− SD) in males only are shown in Table 2. Of all males enrolled in the study, 17% of the controls, 24% of the intermediates and 31% of the GWI individuals did not have right basal ganglia spectral data for analyses for the following reasons: data acquisition was not performed (either because the participant did not agree to MR scanning, or did not complete the MR examination) or spectral data quality was considered insufficient for computation of metabolite ratios. It is unclear to what extent the higher percentage of missing data in GWI might be related to illness or if it affected our ability to detect group differences. Nevertheless, right basal ganglia showed no significant metabolite group differences (ratios or absolute concentrations). Of the seven measures given in Table 2, six show an effect in the unexpected direction, with an estimated effect size between 0.01 and 0.19, and the measure in the expected direction had an effect size of 0.0. Overall, this clearly indicated that the data support the absence of any clinically relevant effects.
Table 2.
Single volume MRS results, right basal ganglia, uncorrected data, males only
| Metabolite | Control | n | Intermediate | n | GWI | n | Effect size (Control vs. GWI) |
|---|---|---|---|---|---|---|---|
| NAA (i.u.) | 1538 ± 284 | 49 | 1619 ± 252 | 53 | 1591 ± 270 | 38 | +0.19 |
| Cr (i.u.) | 948 ± 161 | 49 | 999 ± 123 | 53 | 961 ± 148 | 38 | +0.08 |
| Cho (i.u.) | 337 ± 62 | 49 | 344 ± 50 | 53 | 341 ± 62 | 38 | +0.01 |
| NAA/Cr | 1.63 ± 0.15 | 68 | 1.63 ± 0.17 | 71 | 1.67 ± 0.12 | 51 | +0.02 |
| NAA/Cho | 4.60 ± 0.47 | 68 | 4.70 ± 0.57 | 71 | 4.71 ± 0.49 | 51 | +0.02 |
| Cho/Cr | 0.36 ± 0.04 | 68 | 0.35 ± 0.05 | 71 | 0.36 ± 0.04 | 51 | 0 |
| NAA/(Cho + Cr) | 1.20 ± 0.10 | 68 | 1.21 ± 0.11 | 71 | 1.23 ± 0.08 | 51 | +0.03 |
All data are given as mean ± standard deviation.
There were no significant group differences in data from the left basal ganglia and pons (data not shown). Additionally, there were no statistical differences in metabolite concentrations in the mesial temporal lobe including hippocampus and brainstem determined by PRESS SI (n=97) and multislice MRSI (n=97) between GWI and control groups. Even when multiple comparisons were not accounted for, we found no significant group differences for any of the metabolite measures in GM and WM of the main lobes, thalami, lenticular nuclei, caudate, brainstem, cerebellar vermis and hippocampi. Furthermore, exploration of structural imaging measurements including hippocampal volume, volumes of all subcortical structures and the GM, WM or CSF volumes of the right or left frontal, parietal, temporal or occipital lobes showed no differences between any of the groups, even without correcting significance levels for multiple comparisons. Additionally, a comparison of individuals with Haley Syndrome 2 (with single voxel MRS n=32; PRESS SI n=15; MRSI n=15) with the veteran control group revealed no significant differences in any measures with either t-tests or linear analysis.
Explanatory variables
The explanatory variables of depression and alcohol use were significant at the 0.1 level for less than 5% of the regional measures in the linear model and were therefore dropped from the model. Additionally, the linear model analyses were rerun with the CAPS score dropped as an explanatory variable in order to check that PTSD symptomatology was not masking any effect, but there were still no significant differences between the GWI and control groups.
DISCUSSION
Our MRS findings do not replicate the previous reports by Haley et al. (1) of reduced NAA/Cr in the basal ganglia and pons. We studied a larger number of GWI individuals than reported by Haley (n=81 vs n=22 symptomatic veterans, including 51 males with metabolite ratio information), compared them to a larger number of control veterans without symptoms (n=97 vs n=18, including 68 males with metabolite ratio information), and we employed virtually identical methods for patient assessment and MRI/MRS. Furthermore, we used MRSI in 97 GWI participants and controls, an additional MRS method to examine metabolite spectra from the basal ganglia and pons, and to explore areas of the brain not previously targeted. We believe, therefore, that the discrepancy in the results is unlikely due to less stringent spectroscopic techniques or to a lack of statistical power for our study. The time elapsed between Haley’s study (1) and acquisition of our data (2 to 7 years) may be associated with a normalization of brain abnormalities, although classifying symptoms persisted. Taken together, our inability to demonstrate changes in brain NAA in patients with GWI suggests that reduced NAA, if it ever occurred, is not a long-lasting feature of GWI. The lack of neuropsychological differences between GWI and control participants in our study also supports the idea that elapsed time between combat exposure and participation in this study may have obscured any differences that once existed.
We found no differences between control and GWI groups in PON1 genotypes or paraoxonase activities. These results do not support the view that exposure to sarin or other organophosphates is responsible for GWI symptoms and are in agreement with the Veterans Administration Research Advisory Committee on Gulf War Veterans’ Illnesses which concluded that evidence for an association between GWI and low-level exposure to nerve agents such as sarin is “inconsistent or limited” (56). However, differences were found between GW veterans with suspected sarin exposure and unexposed veterans in a recent study (57) that showed exposed veterans to have reduced total brain GM and hippocampal volumes compared to unexposed controls. Positive correlations were also found between total WM volume and measures of executive function and visuospatial abilities in this group (57).
The major significant difference between GWI and control groups was a higher prevalence of PTSD and higher CAPS scores in the GWI group, indicating greater PTSD symptoms. A recent study found that GW veterans who recovered from PTSD had larger hippocampal volumes that those with chronic PTSD or current depression, suggesting that smaller hippocampal volume may be a risk factor for lack of recovery from PTSD or a reversible, state dependent PTSD effect (58). While the symptoms of PTSD and GWI have little in common, the effect of psychological stress on general health is well-documented (59). Deployment to the Gulf War resulted in higher risks for both PTSD and chronic fatigue syndrome (60) and studies of veterans returning from the Gulf War suggested that many of the symptoms of GWI are caused by exposure to stress (e.g. 11,12). GWI is a multi-symptom syndrome with significant overlap with diseases such as fibromyalgia, chronic fatigue syndrome, depression and irritable bowel syndrome. PTSD is a potential causative agent of fibromyalgia (61,62), chronic fatigue syndrome (61) and irritable bowel syndrome (63), and is often co-morbid with depression. Potential mechanisms for these links include disturbance of cortisol levels (64), thyroid hormone (65) and elevated nitric oxide/peroxynitrite (66). These findings, taken together with our results, support the idea that psychological stress, mediated by metabolic means, is a significant causative factor in GWI.
The Veterans Administration Research Advisory Committee on Gulf War Veterans’ Illnesses concluded that “GWI is associated with diverse biological alterations that most prominently affect the brain and nervous system” (56). While our studies do not support changes in brain NAA levels and ratios, there is the possibility of other neurological changes. Psychological stress may also be just one factor contributing to GWI. Kang et al. (67) found that the higher rate of chronic fatigue syndrome in Gulf War veterans was only partially correlated with the degree of stress experienced while deployed and suggested that the increased risk of GWI might be related to “an additional unique environmental factor”. Pyridostygmine bromide pills used as prophylaxis treatment against nerve agents and exposure to pesticides have been causally associated with GWI (56) and their effects on the central nervous system may be potentiated by stress in animal models (56,68). Furthermore, the combination of multiple chemical exposures and stress may have more potent effects than one factor alone (56).
As we observed no significant changes in brain NAA, Cr or Cho measures nor significant regional brain volume loss in patients with GWI, but instead a higher prevalence of PTSD and PTSD symptoms, we conclude that this symptom complex is most likely related to exposure to psychological stress during deployment and not to loss of or persistent injury to neurons in the basal ganglia and pons.
ACKNOWLEDGMENTS
This study was supported by Department of Defense grant DAMD17-01-1-0764, entitled ’Magnetic Resonance and Spectroscopy of the Human Brain in Gulf War Illness’, awarded to the Northern California Institute for Research and Education from the Department of Defense Gulf War Illnesses Research Program, US Army Medical Research and Materiel Command. This study was also supported by NIH/NIEHS Grant ES09883. This material is the result of work supported with resources and the use of facilities at the San Francisco Veterans Affairs Medical Center.
The authors thank Dr. Robert Haley, University of Texas, Dallas, TX, Col. Karl Friedl, US Army Medical Research and Materiel Command, Joselyn Lindgren, Anne Bruce, Tanya Greenfield, Linda Abadjian, Jennifer Merrill, Phillip Insel, Rebecca Richter, Frank Ezekiel and Dallas Veitch for their technical support and assistance.
REFERENCES
- 1.Haley RW, Marshall WW, McDonald GG, Daugherty MA, Petty F, Fleckenstein JL. Brain abnormalities in Gulf War syndrome: evaluation with 1H MR spectroscopy. Radiology. 2000;215:807–817. doi: 10.1148/radiology.215.3.r00jn48807. [DOI] [PubMed] [Google Scholar]
- 2.Iversen A, Chalder T, Wessely S. Gulf War Illness: lessons from medically unexplained symptoms. Clin Psychol Rev. 2007;27:842–854. doi: 10.1016/j.cpr.2007.07.006. [DOI] [PubMed] [Google Scholar]
- 3.Gronseth GS. Gulf war syndrome: a toxic exposure? A systematic review. Neurol Clin. 2005;23:523–540. doi: 10.1016/j.ncl.2004.12.011. [DOI] [PubMed] [Google Scholar]
- 4.Unwin C, Blatchley N, Coke W, Ferry S, Hotopf M, Hull L, Ismail K, Palmer I, David A, Wessely S. Health of UK servicemen who served in Persian Gulf War. Lancet. 1999;353:169–178. doi: 10.1016/S0140-6736(98)11338-7. [DOI] [PubMed] [Google Scholar]
- 5.Engel CC, Liu X, McCarthy BD, Miller RF, Ursano R. Relationship of physical symptoms to posttraumatic stress disorder among veterans seeking care for gulf war-related health concerns. Psychosom Med. 2000;62:739–745. doi: 10.1097/00006842-200011000-00001. [DOI] [PubMed] [Google Scholar]
- 6.McDiarmid MA, Keogh JP, Hooper FJ, McPhaul K, Squibb K, Kan R, DiPino R, Anderson L. Health effects of depleted uranium on exposed Gulf War veterans. Environ Res. 2000;82:168–180. doi: 10.1006/enrs.1999.4012. [DOI] [PubMed] [Google Scholar]
- 7.Hotopf M, David A, Hull L, Ismail K, Unwin C, Wessely S. Role of vaccinations as risk factors for ill health in veterans of the Gulf war: cross sectional study. BMJ. 2000;320:1363–1367. doi: 10.1136/bmj.320.7246.1363. [DOI] [PMC free article] [PubMed] [Google Scholar]
- 8.Friedman A, Kaufer D, Shemer J, Hendler I, Soreq H, Tur-Kaspa Pyridostigmine brain penetration under stress enhances neuronal excitability and induces early immediate transcriptional response. Nat Med. 1996;2:1382–1385. doi: 10.1038/nm1296-1382. [DOI] [PubMed] [Google Scholar]
- 9.Abou-Donia MB, Wilmarth KR, Jensen KF, Oehme FW, Kurt TL. Neurotoxicity resulting from coexposure to PB, DEET and permethrin: implications of Gulf War chemical exposures. J. Toxicol. Environ. Health. 1996;48:35–56. doi: 10.1080/009841096161456. [DOI] [PubMed] [Google Scholar]
- 10.McCauley LA, Rischitelli G, Lambert WE, Lasarev M, Sticker DL, Spencer PS. Symptoms of Gulf War veterans possibly exposed to organophosphate chemical warfare agents at Khamisiyah, Iraq. Int J Occup Enviro Health. 2001;7:79–89. doi: 10.1179/107735201800339515. [DOI] [PubMed] [Google Scholar]
- 11.Wegman DH, Woods NF, Bailar JC. Invited commentary: How would we know a Gulf War syndrome if we saw one? Am J Epidemiol. 1997;146:704–711. doi: 10.1093/oxfordjournals.aje.a009344. [DOI] [PubMed] [Google Scholar]
- 12.Ford JD, Campbell KA, Storzbach D, Binder LM, Anger WK, Rohlman DS. Posttraumatic stress symptomatology is associated with unexplained illness attributed to Persian Gulf War military service. Psychosom Med. 2001;63:842–849. doi: 10.1097/00006842-200109000-00019. [DOI] [PubMed] [Google Scholar]
- 13.Binns JH, et al. Research Advisory Committee on Gulf War Veterans' Illnesses. Veterans Administration; 2004. Scientific Progress in Understanding Gulf War Veterans' Illnesses: Report and Recommendations. [Google Scholar]
- 14.Miller BL. A review of chemical issues in 1H NMR spectroscopy: N-acetyl aspartate, creatine and choline. NMR Biomed. 1991;4:47–52. doi: 10.1002/nbm.1940040203. [DOI] [PubMed] [Google Scholar]
- 15.Haley RW, Kurt TL, Hom J. Is there a Gulf War Syndrome? Searching for syndromes by factor analysis of symptoms. JAMA. 1997;277:215–222. [PubMed] [Google Scholar]
- 16.Davies HG, Richter RJ, Keifer M, Broomfield CA, Sowalla J, Furlong CE. The effect of the human serum paraoxonase polymorphism is reversed with diazoxon, soman and sarin. Nat Genet. 1996;14:334–336. doi: 10.1038/ng1196-334. [DOI] [PubMed] [Google Scholar]
- 17.Haley RW, Billecke S, La Du BN. Association of low PON1 type Q (type A) arylesterase activity with neurologic symptom complexes in Gulf War veterans. Toxicol Appl Pharmacol. 1999;157:227–233. doi: 10.1006/taap.1999.8703. [DOI] [PubMed] [Google Scholar]
- 18.First MB, Spitzer RL, Williams JBW, Gibbon M. Structured Clinical Interview for DSM-IV (SCID-I) New York: New York State Psychiatric Institute, Biometrics Research; 1999. [Google Scholar]
- 19.Haley RW, Kurt TL, Hom J. Is there a Gulf War Syndrome? Searching for syndromes by factor analysis of symptoms. JAMA. 1997;277:215–222. [PubMed] [Google Scholar]
- 20.Haley RW, Marshal WW, McDonald GG, Daugherty MA, Petty F, Fleckenstein JL. Brain abnormalities in Gulf War syndrome: evaluation with 1H MR spectroscopy. Radiology. 2000;215:807–817. doi: 10.1148/radiology.215.3.r00jn48807. [DOI] [PubMed] [Google Scholar]
- 21.Hom J, Haley RW, Kurt TL. Neuropsychological correlates of Gulf War syndrome. Arch Clin Neuropsychol. 1997;12:531–544. [PubMed] [Google Scholar]
- 22.Blake DD, Weathers FW, Nagy LM, Kaloupek DG, Gusman FD, Charney DS, Keane TM. The development of a Clinician-Administered PTSD Scale. J. Trauma Stress. 1995;8:75–90. doi: 10.1007/BF02105408. [DOI] [PubMed] [Google Scholar]
- 23.Blanchard EB, Jones-Alexander J, Buckley TC, Forneris CA. Psychometric properties of the PTSD Checklist (PCL) Behav Res The. 1996;34:669–673. doi: 10.1016/0005-7967(96)00033-2. [DOI] [PubMed] [Google Scholar]
- 24.Keane TM, Caddell JM, Taylor KL. Mississippi Scale for Combat-Related Posttraumatic Stress Disorder: three studies in reliability and validity. J Consult Clin Psychol. 1988;56:85–90. doi: 10.1037//0022-006x.56.1.85. [DOI] [PubMed] [Google Scholar]
- 25.Sobell LC, Sobell MB, Riley DM. The reliability of alcohol abusers' self-reports of drinking and life events that occurred in the distant past. J Stud Alcohol. 1988;49:225–232. doi: 10.15288/jsa.1988.49.225. [DOI] [PubMed] [Google Scholar]
- 26.Wechsler D. Wechsler Adult Intelligence Scale-III Administration and Scoring Manual. San Antonio: TX: The Psychological Corporation; 1997. [Google Scholar]
- 27.Tombaugh TN. Test of Memory Malingering (TOMM) New York, NY: Multi Health Systems; 1994. [Google Scholar]
- 28.Conners CK, Staff MHS, editors. Conners’ Continuous Performance Test II: Computer Program for Windows Technical Guide and Software Manual. North Tonwanda, NY: Multi-Health Systems; 2000. [Google Scholar]
- 29.Wechsler D. Wechsler Memory Scale. Third Edition ed. San Antonio, TX: The Psychological Corporation; 1997. [Google Scholar]
- 30.Benedict R. Brief Visuospatial Memory Test – Revised. Odessa, FL: Professional Manual. Psychological Assessment Resources, Inc.; 1997. [Google Scholar]
- 31.Reitan RM. Validity of the Trail Making test as an indicator of organic brain damage. Percept Mot Skills. 1958;8:271–276. [Google Scholar]
- 32.Corrigan JD, Hinkeldey MS. Relationships between parts A and B of the Trail Making Test. J Clin Psychol. 1987;43:402–409. doi: 10.1002/1097-4679(198707)43:4<402::aid-jclp2270430411>3.0.co;2-e. [DOI] [PubMed] [Google Scholar]
- 33.Gaudino EA, Geisler MW, Squires NK. Construct validity in the Trail Making Test: What makes Part B harder? J. Clin. Exp. Neuropsychol. 1995;17:529–535. doi: 10.1080/01688639508405143. [DOI] [PubMed] [Google Scholar]
- 34.Delis DC, Kramer JH, Kaplan E, Ober B. The California verbal learning test: Research edition. Research ed. New York: The Psychological Corporation; 1987. [Google Scholar]
- 35.Heaton RK, Grant I, Matthews CG. Comprehensive norms for an expanded Halstead-Reitan Battery Demographic Corrections, Research Findings, and clinical applications. Odessa, FL: Psychological Assessment Resources, Inc.; 1991. [Google Scholar]
- 36.Heaton RK, Grant I, Butters N the HNRC group. The HNRC 500--neuropsychology of HIV infection at different disease stages. J Int Neuropsychol Soc. 1995;1:231–251. doi: 10.1017/s1355617700000230. [DOI] [PubMed] [Google Scholar]
- 37.Wilkinson GS. Administration Manual. Delaware: Wide Range Inc.; 1993. Wide Range Achievement Test-III. [Google Scholar]
- 38.Wetzel L, Boll TJ. Short Category Test, Booklet Format. Los Angeles, CA: Western Psychological Services; 1987. [Google Scholar]
- 39.Benton AB, Hamsher K. Multilingual Aphasia Examination: Word Fluency. Iowa: University of Iowa Department of Neurology and Psychology; 1983. [Google Scholar]
- 40.Ruff RM, Light RH, Parker SB, Levin HS. Benton Controlled Oral Word Association Test: reliability and updated norms. Arch Clin Neuropsychol. 1996;11:329–338. [PubMed] [Google Scholar]
- 41.Reitan RM, Davidson LA. Clinical Neuropsychology: Current Status and Applications. Washington, DC: H. Winston; 1974. [Google Scholar]
- 42.Fregly AR, Smith MJ, Graybiel A. Revised normative standards of performance of men on a quantitative ataxia test battery. Acta Otolaryngo. 1973;75:10–16. doi: 10.3109/00016487309139631. [DOI] [PubMed] [Google Scholar]
- 43.Buysse DJ, Reynolds CF, Monk TH, Berman SR, Kupfer DJ. The Pittsburgh Sleep Quality Index: a new instrument for psychiatric practice and research. Psychiatry Res. 1989;28:193–213. doi: 10.1016/0165-1781(89)90047-4. [DOI] [PubMed] [Google Scholar]
- 44.Green BL. Psychometric review of the Trauma History Questionnaire (THQ) In: Stamm BH, editor. Measurement of stress, trauma and adaptation. Lutherville, MD: Sidran Press; 1996. [Google Scholar]
- 45.Derogatis L, Lazarus L. SCL-90--R, Brief symptom inventory, and matching clinical rating scales. 217–248. In: Maruish ME, editor. The use of psychological testing for treatment planning and outcome assessment. Hillsdale, NJ: Lawrence Erlbaum Associates, Inc.; 1994. [Google Scholar]
- 46.Beck AT, Ward CH, Mendelson M, Mock J, Erbaugh J. An inventory for measuring depression. Arch Gen Psychiatry. 1961;4:561–571. doi: 10.1001/archpsyc.1961.01710120031004. [DOI] [PubMed] [Google Scholar]
- 47.Kazis LE. The Veterans Sf-36 Health Status Questionnaire: Development and Application in the Veterans Health Administration. The Monitor. The Medical Outcomes Trust. 2000:5. [Google Scholar]
- 48.Southwick SM, Morgan A, Nagy LM, Bremner D, Nicolaou AL, Johnson DR, Rosenheck R, Charney DS. Trauma-related symptoms in veterans of Operation Desert Storm: a preliminary report. Am J Psychiatry. 1993;150:1524–1528. doi: 10.1176/ajp.150.10.1524. [DOI] [PubMed] [Google Scholar]
- 49.Richter RJ, Furlong CE. Determination of paraoxonase (PON1) status requires more than genotyping. Pharmacogenetics. 1999;9:745–753. [PubMed] [Google Scholar]
- 50.Cardenas VA, Studholme C, Meyerhoff DJ, Song E, Weiner MW. Chronic active heavy drinking and family history of problem drinking modulate regional brain tissue volumes. Psychiatry Res. 2005;138:115–130. doi: 10.1016/j.pscychresns.2005.01.002. [DOI] [PubMed] [Google Scholar]
- 51.Soher BJ, Young K, Bernstein A, Aygula Z, Maudsley AA. GAVA: spectral simulation for in vivo MRS applications. J Magn Reson. 2007;185:291–299. doi: 10.1016/j.jmr.2007.01.005. [DOI] [PMC free article] [PubMed] [Google Scholar]
- 52.Soher BJ, Pattany PM, Matson GB, Maudsley AA. Observation of coupled 1H metabolite resonances at long TE. Magn Reson Med. 2005;53:1283–1287. doi: 10.1002/mrm.20491. [DOI] [PMC free article] [PubMed] [Google Scholar]
- 53.Soher BJ, Young K, Govindaraju V, Maudsley AA. Automated spectral analysis III: application to in vivo proton MR spectroscopy and spectroscopic imaging. Magn Reson Med. 1998;40:822–831. doi: 10.1002/mrm.1910400607. [DOI] [PubMed] [Google Scholar]
- 54.Schuff N, Amend D, Knowlton R, Norman D, Fein G, Weiner MW. Age-related metabolite changes and volume loss in hippocampus by proton MR spectroscopic imaging and MRI neurobiology of aging. Neurobiology of Aging. 1999;20:279–285. doi: 10.1016/s0197-4580(99)00022-6. [DOI] [PMC free article] [PubMed] [Google Scholar]
- 55.McCulloch CE, Searle SR, Neuhaus JM. Generalized, Linear, and Mixed Models. 2nd ed. Hoboken, NJ: John Wiley & Sons, Inc.; 2008. [Google Scholar]
- 56.Binns JH, et al. Gulf War Illness and the Health of Gulf War Veterans: Scientific Findings and Recommendations. Washington, DC: Department of Veterans Affairs; 2008. [Google Scholar]
- 57.Chao LL, Rothlind JC, Cardenas VA, Meyerhoff DJ, Weiner MW. Effects of low-level exposure to sarin and cyclosarin during the 1991 Gulf War on brain function and brain structure in US veterans. NeuroToxicology. 2010;31:493–501. doi: 10.1016/j.neuro.2010.05.006. [DOI] [PMC free article] [PubMed] [Google Scholar]
- 58.Apfel BA, Ross J, Hlavin J, Meyerhoff DJ, Metzler TJ, Marmar CR, Weiner MW, Schuff N, Neylan TC. Hippocampal Volume Differences in Gulf War Veterans with Current versus Lifetime PTSD Symptoms. Submitted to Biological Psychiatry. doi: 10.1016/j.biopsych.2010.09.044. [DOI] [PMC free article] [PubMed] [Google Scholar]
- 59.Ader R. Psychoneuroimmunology. Burlington, MA: Elsevier Academic Press; 2007. [Google Scholar]
- 60.Kang HK, Mahan CM, Lee KY, Magee CA, Murphy FM. Illnesses among United States veterans of the Gulf War: a population-based survey of 30,000 veterans. J. Occup Environ Med. 2000;42:491–501. doi: 10.1097/00043764-200005000-00006. [DOI] [PubMed] [Google Scholar]
- 61.Roy-Burne P, Smith WR, Goldberg J, Afari N, Buchwald D. Psychol Med. 2004;34:363–368. doi: 10.1017/s0033291703008894. [DOI] [PubMed] [Google Scholar]
- 62.Boscarino JA. Posttraumatic stress disorder and physical illness: results from clinical and epidemiological studies. Ann N Y Acad Sci. 2004;1032:141–153. doi: 10.1196/annals.1314.011. [DOI] [PubMed] [Google Scholar]
- 63.Klooker TK, Braak B, Painter RC, de Rooij SR, van Elburg RM, van den Wijngaard RM, Rosebloom TJ, Boeckxstaens GE. Exposure to Severe Wartime Conditions in Early Life is Associated With an Increased Risk of Irritable Bowel Syndrome: A Population-Based Cohort Study. Am J Gastroenterol. 2009 June 9; doi: 10.1038/ajg.2009.282. [Epub ahead of print] [DOI] [PubMed] [Google Scholar]
- 64.Weissbecker I, Floyd A, Dedert E, Slamon P, Sephton S. Childhood Trauma and diurnal cortisol disruption in fibromyalgia syndrome. Psychoneuroendocrinology. 2006;3:312–324. doi: 10.1016/j.psyneuen.2005.08.009. [DOI] [PubMed] [Google Scholar]
- 65.Garrison RL, Breeding PP. A metabolic basis for fibromyalgia and its related disorders: the possible role of resistance to thyroid hormone. Med. Hypotheses. 2003;61:182–189. doi: 10.1016/s0306-9877(02)00294-3. [DOI] [PubMed] [Google Scholar]
- 66.Pall ML. Prevalence of post-traumatic stress disorder in fibromyalgia patients: overlapping syndromes or post-traumatic fibromyalgia syndrome? Semin Arthritis Rheum. 2001;32:38–50. doi: 10.1053/sarh.2002.33719. [DOI] [PubMed] [Google Scholar]
- 67.Kang HK, Natelson BH, Clare MM, Lee KY, Murphy FM. Post-traumatic stress disorder and chronic fatigue-like illness among Gulf War veterans: A population-based survey or 30,000 veterans. Am J Epidemiol. 2003;157:141–148. doi: 10.1093/aje/kwf187. [DOI] [PubMed] [Google Scholar]
- 68.Lamproglou I, Barbier L, Diserbo M, Fauvelle F, Fauquette W, Amourette C. Repeated stress in combination with pyridostigmine Part 1: Long-term behavioural consequences. Behav Brain Res. 2009;197:310–310. doi: 10.1016/j.bbr.2008.08.031. [DOI] [PubMed] [Google Scholar]