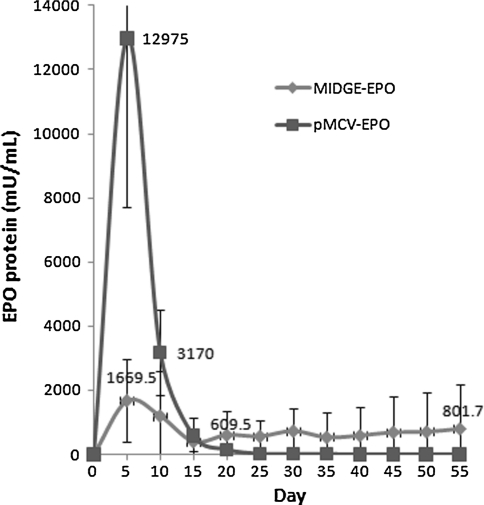
Fig. 4.
Nucleofection of MIDGE-EPO resulted in stable EPO expression in hMSC. Analysis of EPO level in the supernatant of nucleofected cells was determined by ELISA. Blue line represents the EPO expression by the MIDGE-EPO-nucleofected cells (N = 5), red line represents EPO expression by the pMCV-EPO-nucleofected cells (N = 2). (color figure online)

