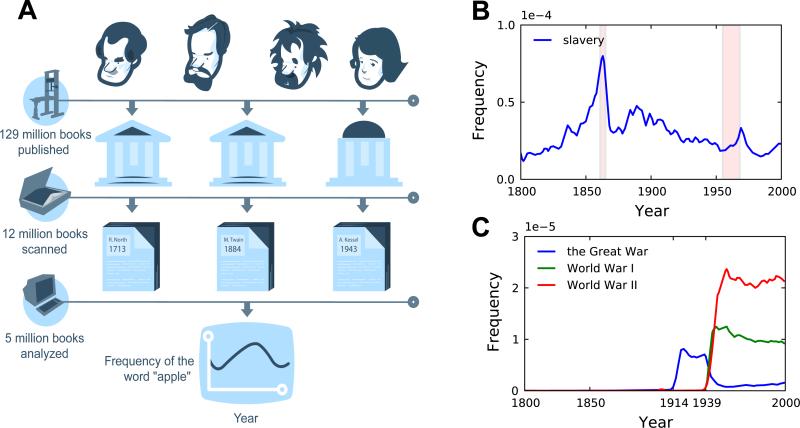
Fig. 1.
‘Culturomic’ analyses study millions of books at once. (A) Top row: authors have been writing for millennia; ~129 million book editions have been published since the advent of the printing press (upper left). Second row: Libraries and publishing houses provide books to Google for scanning (middle left). Over 15 million books have been digitized. Third row: each book is associated with metadata. Five million books are chosen for computational analysis (bottom left). Bottom row: a culturomic ‘timeline’ shows the frequency of ‘apple’ in English books over time (1800-2000). (B) Usage frequency of ‘slavery’. The Civil War (1861-1865) and the civil rights movement (1955-1968) are highlighted in red. The number in the upper left (1e-4) is the unit of frequency. (C) Usage frequency over time for ‘the Great War’ (blue), ‘World War I’ (green), and ‘World War II’ (red).

