Abstract
An image reconstruction formula is presented for photoacoustic computed tomography that accounts for conversion between longitudinal and shear waves in a planar-layered acoustic medium. We assume the optical absorber that produces the photoacoustic wave field is embedded in a single fluid layer and any elastic solid layers present are separated by one or more fluid layers. The measurement aperture is assumed to be planar. Computer simulation studies are conducted to demonstrate and investigate the proposed reconstruction formula.
1. INTRODUCTION
Photoacoustic computed tomography (PCT) is a rapidly emerging imaging technique that combines optical image contrast with ultrasound detection principles [1–4]. In PCT, the object of interest is illuminated with an optical or microwave field, and acoustic wave fields are generated via the photoacoustic effect [2,3]. These wave fields are measured outside the object by use of wideband ultrasonic transducers and employed to numerically reconstruct an image that depicts the spatially variant optical absorption properties of the object. Because the optical absorption properties of tissue are highly related to its molecular constitution, biomedical applications of PCT can reveal the pathological condition of the tissue [5,6] and therefore facilitate a wide range of diagnostic tasks [2,7–12].
The image reconstruction problem in PCT can be interpreted as an inverse source problem [13]. A variety of analytic image reconstruction algorithms have been developed for three-dimensional (3D) PCT assuming canonical measurement apertures [2,14–20]. Most existing PCT image reconstruction algorithms assume the object of interest is embedded in an infinite, homogeneous, dispersion-free medium. Significant distortions and artifacts can appear in the reconstructions when the object’s speed of sound and density distributions are spatially variant [21,22], posses dispersive or absorptive properties [23,24], or are embedded in a finite medium for which acoustic boundary conditions need to be incorporated [25,26]. Compensating for these variations in the acoustical properties of an object and the medium in which it is embedded remain an important area of current research [27–32].
All PCT image reconstruction algorithms developed to date assume that the to-be-imaged optical absorber is embedded in a fluid acoustic medium that supports only pressure waves. However, elastic solids support generation and propagation of a second type of ultrasonic waves, shear waves, whose effects have not yet been accounted for in PCT image reconstruction algorithms. The modeling of solids in PCT is an important step toward quantitative transcranial PCT [33,34]. Previous studies in PCT through the skull using algorithms that do not account for shear waves or the strong acoustic heterogeneities inherent in transcranial imaging exhibit obvious distortions [34]. The acoustic properties of the skull have been well modeled for transcranial ultrasound imaging applications [35–38].
In this work, we develop a PCT reconstruction formula for applications in which a planar detection surface is employed and the to-be-imaged optical absorber is embedded in a planar-layered acoustic medium in which one or more of the layers can be an elastic solid. The optical absorber that produces the photoacoustic wave field is assumed to be embedded in a single fluid layer and any elastic solid layers present are separated by one or more fluid layers. The speed of sound, density, and thickness of each layer, and number of layers are assumed to be known. The reconstruction formula is mathematically exact and accounts for multiple reflections of the induced photoacoustic wave field between the layers of the medium, shear waves in the solid layers, and absorptive and dispersive effects in the layers. Similar to classic PCT reconstruction formulas for a planar measurement geometry, the reconstruction formula is based upon a mapping between the 3D Fourier components of the sought-after absorbed optical energy density distribution and the 3D Fourier components of the measured pressure data that correspond to propagating wave modes. In the special case where none of the layers are elastic solids, the developed reconstruction formula degenerates into a previously developed one for layered fluid media [26]. Computer simulation studies are conducted to demonstrate and investigate the proposed method.
2. BACKGROUND: CANONICAL FORMULATION OF PCT WITH A PLANAR MEASUREMENT APERTURE
The standard imaging model for PCT is derived from the acoustic wave equation in either the space–time or space–frequency domain. The space–frequency domain representation p̃(r, ω) of the acoustic field is related to the space–time representation p(r, t) by a Fourier transform, viz.,
| (1) |
where ω denotes the temporal frequency, , and r = (x, y, z). In a fluid medium, the acoustic field obeys an inhomogeneous Helmholtz equation:
| (2) |
where k = ω/c is the wavenumber, is the local speed of sound, ρ is the equilibrium density, Γ = λ/CP, λ is the thermal expansion coefficient, CP is the specific heat capacity (at constant pressure), A(r) is the absorbed optical energy density, and H(ω) describes the one-dimensional (1D) Fourier transform of the temporal profile of the exciting optical or microwave pulse. In Cartesian coordinates, we express A(r) as A(x, y, z). The pressure field away from the acoustic source can be expressed as
| (3) |
where G(r, r′, ω) is an appropriate Green function and V denotes the support volume of A(r). Equation (3) represents an imaging model for PCT expressed in the temporal frequency domain. The required Green function can only be found analytically when the medium is homogeneous or when certain symmetries exist in the system [18,26]. Otherwise, numerical methods must be employed to estimate the Green function needed to specify the imaging model in Eq. (3). The inverse problem in PCT is to determine an estimate of A(r) based on knowledge of p̃(r, ω) and H(ω).
In the case where the medium is acoustically homogeneous with speed of sound c and the measurement aperture corresponds to a plane, taken to be z = 0 without loss of generality, a Fourier transform-based solution to the inverse problem has been established [18,19]. Let p̄(kx, ky, ω) denote the two-dimensional (2D) spatial Fourier transform of the pressure data p̃(x, y, z, ω) evaluated on the measurement plane z = 0:
| (4) |
Similarly, let 𝒜(kx, ky, kz) denote the 3D Fourier transform of A(x, y, z):
| (5) |
It has been demonstrated [18] that certain values of 𝒜(kx, ky, kz) can be determined from the measured pressure data:
| (6) |
One notes that the kz coordinate of 𝒜(kx · ky, kz) is found via a nonlinear mapping of kx, ky, and ω. From knowledge of the estimated Fourier components, a low-pass filtered estimate of A(r) can be determined by use of the 3D inverse Fourier transform [39]. The range of kx, ky, and kz over which 𝒜 may be estimated is related to both the excitation pulse (the values of ω for which H(ω) is nonzero) and the detector (the spatial resolution in acquiring p̃). In Section 3, a generalization of Eq. (6) is established for the case where the optical absorber described by A(r) is embedded in a stratified planar acoustic medium in which at least one of the layers is assumed to be an elastic solid.
3. PCT IMAGE RECONSTRUCTION FORMULA FOR LAYERED ACOUSTIC MEDIA THAT INCLUDE ELASTIC SOLIDS
A. Dyadic Green Function Construction for Homogeneous Media
Elastic solids are characterized by two parameters that describe the stiffness of the solid. These parameters, the Lame coefficients (λ, μ), along with the density of the solid, fully characterize the acoustic response of the material. Fluids can be considered as a special case of an elastic solid in which μ = 0. The boundary conditions for elastic waves involving solids are best understood with respect to the particle displacement caused by the acoustic wave. The vector-valued displacement, u(r, ω), in a fluid is related to the pressure by two relations [40]:
| (7) |
| (8) |
Computing the gradient of Eq. (2) and substituting from Eq. (7) yields the wave equation for the displacement field produced by the photoacoustic effect:
| (9) |
In order to determine the particle displacement away from the source, the method of dyadic Green functions can be employed. In a fluid, the dyadic Green function takes the form [41]
| (10) |
where G0 is the Green function for a homogeneous medium. The angular spectrum decomposition for G0 is given by [42]
| (11) |
where k‖ = (kx, ky, 0)T and
| (12) |
Substitution from Eq. (11) into Eq. (10) yields the angular spectrum decomposition for the dyadic Green function for homogeneous fluids:
| (13) |
where k̂ = k/k is a unit vector pointing in the direction of k = (kx, ky, kz)T and it is assumed that z > z′ ∈ V.
The particle displacement field away from the photoacoustic source is found to satisfy
| (14) |
| (15) |
| (16) |
On substitution from Eq. (16) into Eq. (8), one can obtain the previously determined relationship between the pressure on a plane and the Fourier transform of the object found in Eq. (6).
B. Reconstruction Formula for Layered Media
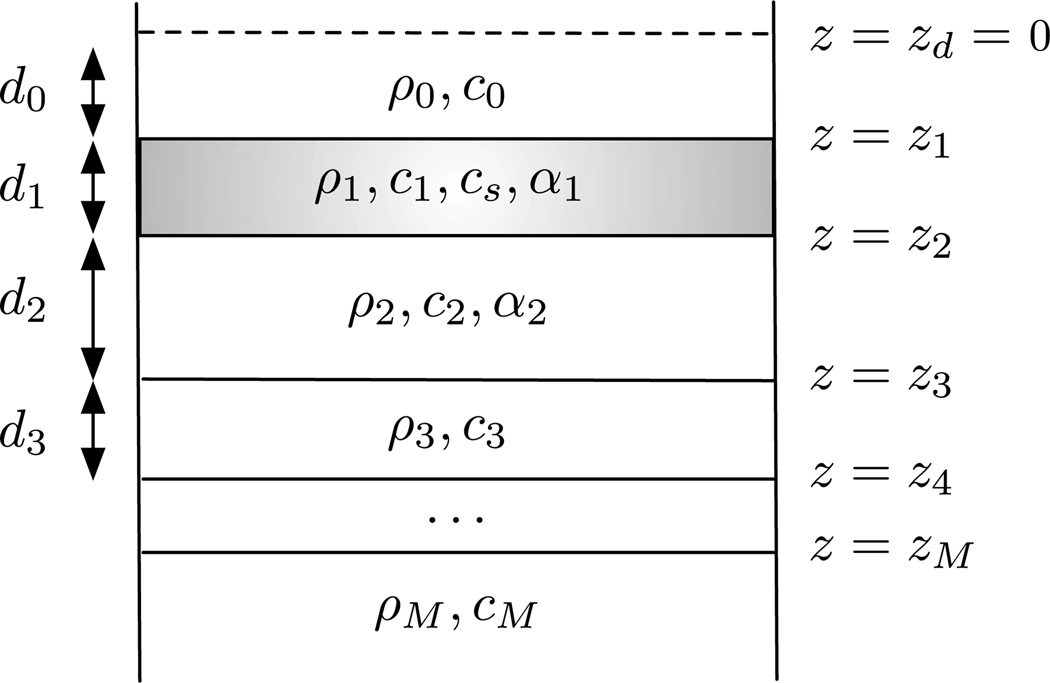
In the case that the object of interest is located in a layered medium containing both fluid and solid layers, a new dyadic Green function must be constructed to account for the presence of shear waves in the solid layers. The description of the relevant physics for shear waves in a layered medium is contained below and in Appendix A. The interested reader is pointed to [43] for a more thorough discussion of shear waves. This construction bears strong resemblance to the method developed for a layered fluid [26]. An example of such a layered medium is presented in Fig. 1. The field in the fluid layer n (except the source layer) obeys
| (17) |
where kn = ω/cn and .
Fig. 1.
Diagram of a layered medium. The detection plane is denoted z = zd and marked with a dashed line. Each layer is characterized by density, ρn, and longitudinal speed of sound, cn. Layer 1 (shaded) is assumed to be an elastic solid, characterized by longitudinal speed of sound c1 and shear speed of sound cs. Layers in which absorption is considered contain αn in the material properties.
The vector displacement field can be represented in terms of solenoidal and irrotational components as u(r, ω) = us(r, ω) + ul(r, ω). If layer m is a solid layer, these displacement components satisfy
| (18) |
| (19) |
where km = ω/cm, ks = ω/cs, . One notes that the shear speed of sound is identically zero for layers in which μm = 0. Materials, such as fluids, for which μm = 0, do not support shear waves.
The angular spectrum decomposition for the longitudinal displacement component in each layer (fluid or solid) is given by
| (20) |
and the angular spectrum decomposition in each solid layer for the shear displacement component is given by
| (21) |
where are unit vectors describing the polarization of the shear waves such that . The z component of the wave vectors in each layer are given by
| (22) |
| (23) |
A detailed description of the relevant boundary conditions between layers and how to determine the explicit form of the dyadic Green function for a layered medium employing the angular spectrum representation is provided in Appendix A.
For the case in which the source A(r) is confined in the bottom layer n = M, assumed to be a fluid layer, the resulting pressure field is found to be
| (24) |
where d0 is the distance between the last boundary and the detector. The factor T0 is the transmission coefficient, found through the method described in Appendix A, for a unit amplitude plane wave incident upon the plane z = zM from below and exiting the layered medium at z = z1 (see Fig. 1). It is assumed that the detection process is performed in a fluid layer, which is consistent with conventional PCT applications.
This relationship can be inverted readily to yield Fourier-space PCT reconstruction formula for a layered medium that admits shear waves in some of the layers:
| (25) |
Equation (25) is the main result of this paper. It shows that the Fourier components of the object that correspond to propagating pressure waves are simply related to the Fourier components of the acoustic signal measured on a plane. It can be verified that, in the special case of an object with homogeneous speed-of-sound and density distributions, i.e., a medium described by a single layer, Eq. (25) reduces to Eq. (6). This result also reduces to a previously found result when only fluid layers are present [26].
4. COMPUTER SIMULATIONS
Computer simulation studies were performed to corroborate the proposed reconstruction method. A numerical phantom representing the object A(r) was considered that contained three uniform spheres located within the bottom layer of the structure. The spheres were centered at positions (1, −1.34, −2.6) cm, (0, 1, −2.8) cm, and (−1, 0, −2.7) cm, had radii of 1 cm, and were quasi-bandlimited by convolving each with a 3D Gaussian function of width 0.5 mm. The value of A(r) was assigned to be 1 for each sphere. Spheres were used in the simulations because they have a known Fourier representation, eliminating numerical error in calculating the Fourier transform of the object. The object was assumed to be embedded in a four-layer structure (see Fig. 1). The bottom layer of the background was assumed to be tissue, unbounded in the −z direction with a speed of sound of 1483m/s and a density of 1000 kg/m3. The second layer was also assumed to be tissue with a thickness of 6 mm, a speed of sound of 1537m/s, and a density of 1116 kg/m3. The third layer was assumed to be bone (a solid), with a longitudinal speed of sound of 2900m/s, shear speed of 1450m/s, thickness of 8 mm, and density of 1900 kg/m3. The fourth (top) layer was assumed tissue, with speed of sound of 1520m/s and density of 1100 kg/m3. The pressure wavefield was assumed to be recorded in a layer that is matched to the skin layer d = 1 mm away from the skin/bone edge.
Samples of p̃(r, ω) were generated according to Eq. (24). Temporal frequency domain data were generated at a sampling rate of 1.59 MHz on a rectangular grid of 128 × 128 idealized, pointlike, transducers, with lateral spacing Δx = 0.5 mm.
Sampled values of p(r, t) were obtained by application of the 1D inverse fast Fourier transform (FFT) to the computed values of p̃(r, ω). Noisy versions of p(r, t) were created by addition of identically distributed white Gaussian noise at each transducer location. The noise level was referenced to the average value of p(r, t) computed over all values of t and transducer locations r.
The reconstruction algorithm was implemented as follows. The 3D FFT algorithm was employed to compute sampled values of p(kx, ky, ω) from the noiseless or noisy measurement data p(r, t). A low-pass filter was applied so that p(kx, ky, ω) = 0 for , where cM is the speed of sound in the layer in which the object resides. The filtering is performed to preserve the relationship expressed in Eq. (25). For is imaginary and 𝒜 is thus a Fourier-Laplace transform and not a Fourier transform. The resulting data were employed in Eq. (25) to obtain an estimate of the object’s Fourier transform on a uniform grid in kx and ky and a nonuniform grid in kz. For a given kx and ky, the sampled values of kz corresponded to . The object estimate was then interpolated onto a uniform grid in kz for kz > 0 for each kx and ky using linear interpolation. As A(r) is real valued, the conjugate symmetry 𝒜*(−kx, −ky, −kz) = 𝒜(kx, ky, kz) was used to obtain the Fourier components of the object for kz < 0. Finally, the inverse 3D FFT algorithm was applied to the sampled values of 𝒜(kx, ky, kz) to obtain an estimate of A(x, y, z).
5. RESULTS
A. Transmission Coefficients
It is well known that bone exhibits absorptive and dispersive effects at temporal frequencies commonly encountered in biomedical applications of PCT. These effects may be incorporated into the model in this paper by redefining the wave vector for each layer in which absorptive and dispersive effects are to be modeled. One model for incorporating these effects in PCT applications is [23]
| (26) |
where αm is the absorption coefficient in layer m and cm(ω) satisfies
| (27) |
and ω0 is a frequency at which c0m is known in each layer. The expressions for Km and cm(ω) ensure that the wave field remains causal. The z component of the wave vector in each layer is similarly redefined:
| (28) |
The kz are then complex quantities in each layer for which absorption is included. The Lame coefficients are likewise redefined to account for absorption and dispersion:
| (29) |
| (30) |
This model for absorption is consistent with previous investigations in transcranial ultrasounds [37].
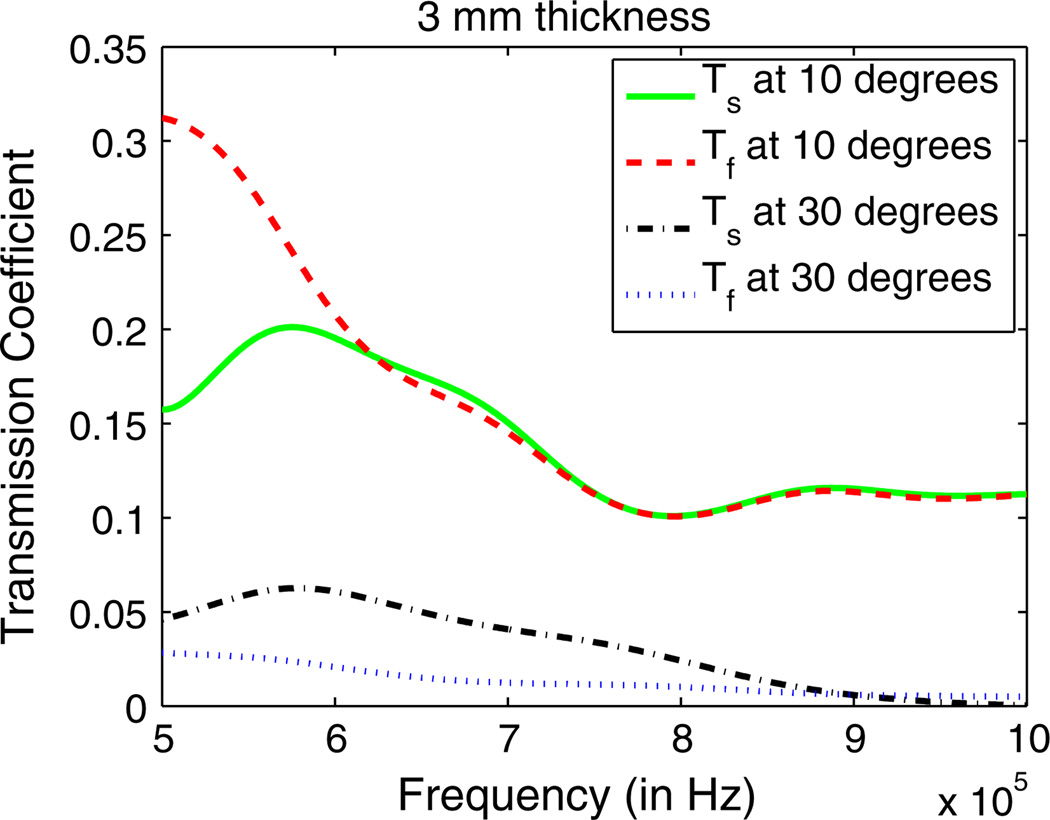
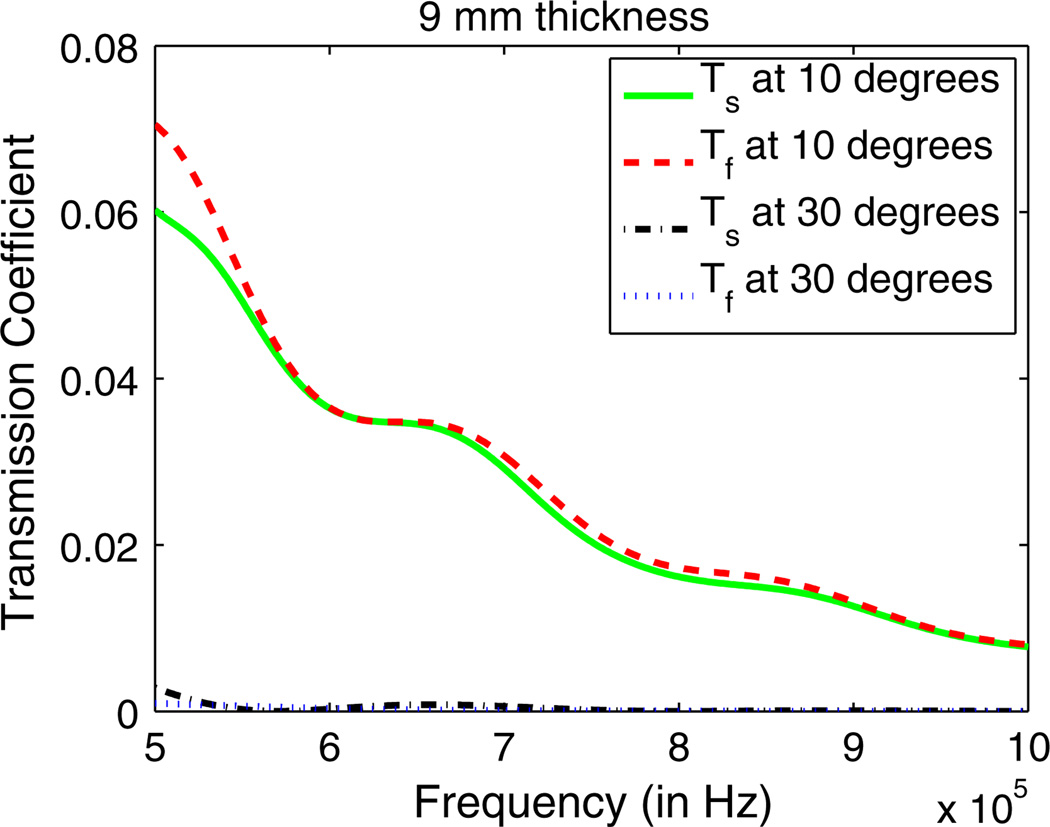
To better understand the manner in which propagating shear waves affect image reconstruction, plots of the transmission coefficient for the system, both when the effects of shear waves are included and neglected, have been studied. Let 𝒯s(θ, ω) = |T0(ω sin θ/cN, 0, ω)|2 be the intensity transmission coefficient for a layered structure in which shear waves are modeled, where T0(kx, ky, ω) is the amplitude transmission coefficient for a layered medium in which shear waves are modeled and cN is the speed of sound in the object layer, and let 𝒯f (θ, ω) = |T̄0(ω sin θ/cN, 0, ω)|2 be the intensity transmission coefficient for a layered structure in which shear waves are not modeled, where T̄0(kx, ky, ω) is the amplitude transmission coefficient for a layered medium in which shear waves are not modeled. The medium simulated is one in which there are four layers, and layers 0, 2, and 3 are assumed to be fluids and layer 1 is assumed to be an elastic solid. Layer 3 is modeled with properties c3 = 1500 m/s and ρ3 = 1000 kg/m3; layer 2 is modeled with properties c2 = 1537 m/s, α2 = 6.18 × 10⁻⁶ s/m, d2 = 4 mm, and ρ2 = 1116 kg/m3; layer 1 is modeled with properties c1 = 2900m/s, cs = 1450m/s, ρ1 = 1900 kg/m3, α1 = 3.07 × 10⁻⁵ s/m, and d1 is allowed to vary; and layer 0 is modeled with c0 = 1500 m/s and ρ0 = 1000 kg/m3. The intensity transmission coefficients are plotted in Figs. 2 and 3 for d1 = 3 and 9 mm, respectively, for frequencies between 500 kHz and 1 MHz. Each figure contains plots of 𝒯f and 𝒯s for θ = 10° and θ = 30°.
Fig. 2.
(Color online) Intensity transmission coefficients for a four-layer medium for the case when the third layer is 3 mm thick. The transmission coefficients are shown for a plane wave incident on the medium at 10° when the first layer is assumed to be an elastic solid (green solid line) and a fluid (red dashed line), and when a plane wave is incident on the medium at 30° when the first layer is assumed to be an elastic solid (black dashed line) and a fluid (blue dotted line). Note that Tf denotes the transmission coefficients when the first layer is assumed to be a fluid and Ts denotes the transmission coefficient when the first layer is assumed to be an elastic solid.
Fig. 3.
(Color online) Intensity transmission coefficients for a four-layer medium for the case when the third layer is 9 mm thick. The transmission coefficients are shown for a plane wave incident on the medium at 10° when the third layer is assumed to be an elastic solid (green solid line) and a fluid (red dashed line), and when a plane wave is incident on the medium at 30° when the third layer is assumed to be an elastic solid (black dashed line) and a fluid (blue dotted line). Note that Tf denotes the transmission coefficients when the first layer is assumed a fluid and Ts denotes the transmission coefficient when the first layer is assumed an elastic solid.
One sees immediately that the two sets of transmission coefficients for a fixed angle differ, sometimes significantly, depending on whether one accounts for shear waves. The plots of the transmission coefficients corresponding to propagating shear waves (𝒯s) are similar to transmission coefficients calculated for transcranial ultrasound applications [37] with a similar layer structure.
B. Reconstructed Images
The algorithm proposed in this manuscript was compared to two other algorithms for PCT imaging that are consistent with detection on a planar aperture. The algorithm proposed in this manuscript, henceforth algorithm (a), is an implementation of Eq. (25) as described in Section 4 with T0 calculated from the exact properties of the layered system. A previously introduced algorithm for a layered medium in which all the layers are fluids [26], henceforth algorithm (b), was implemented for the same layered medium, but without accounting for the possibility of shear waves in layer 1. Finally, an algorithm for a homogeneous medium [18], henceforth algorithm (c), was implemented with the homogenous medium consistent with layer 3 of the structure. Estimates of A(r) were computed from the same noiseless simulation data for all three algorithms. The pressure field was generated in accordance with Eq. (16) for a medium as described in Section 4 and with absorption assumed in layers 1 and 2 with values α1 = 3.07 × 10⁻⁵ s/m and α2 = 6.18 × 10⁻⁶ s/m.
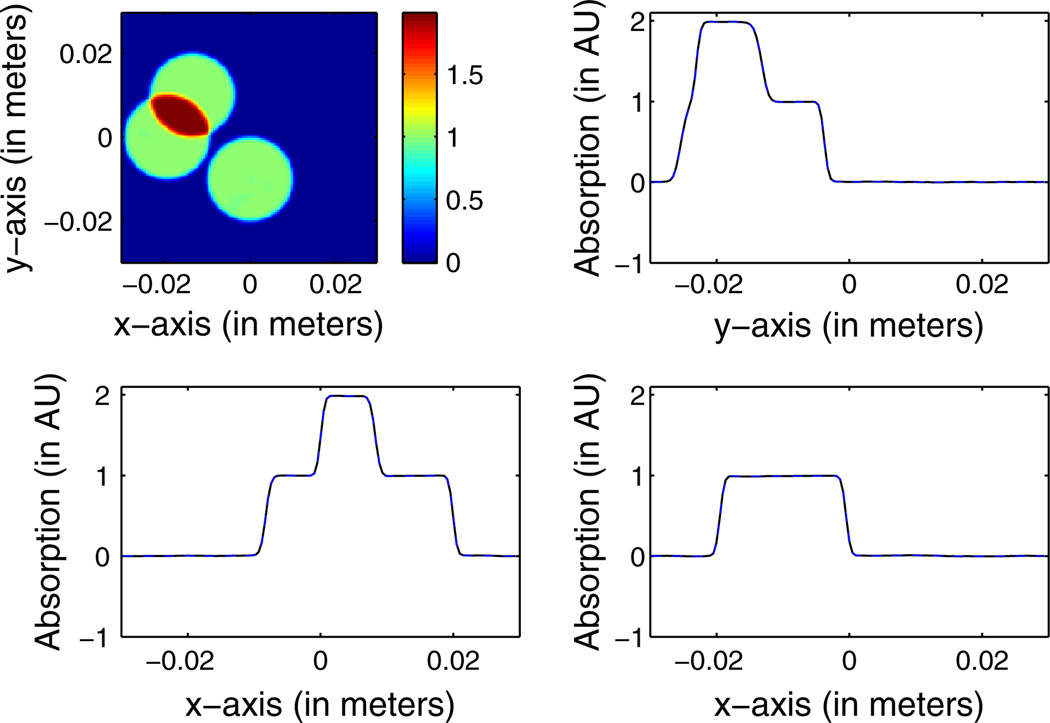
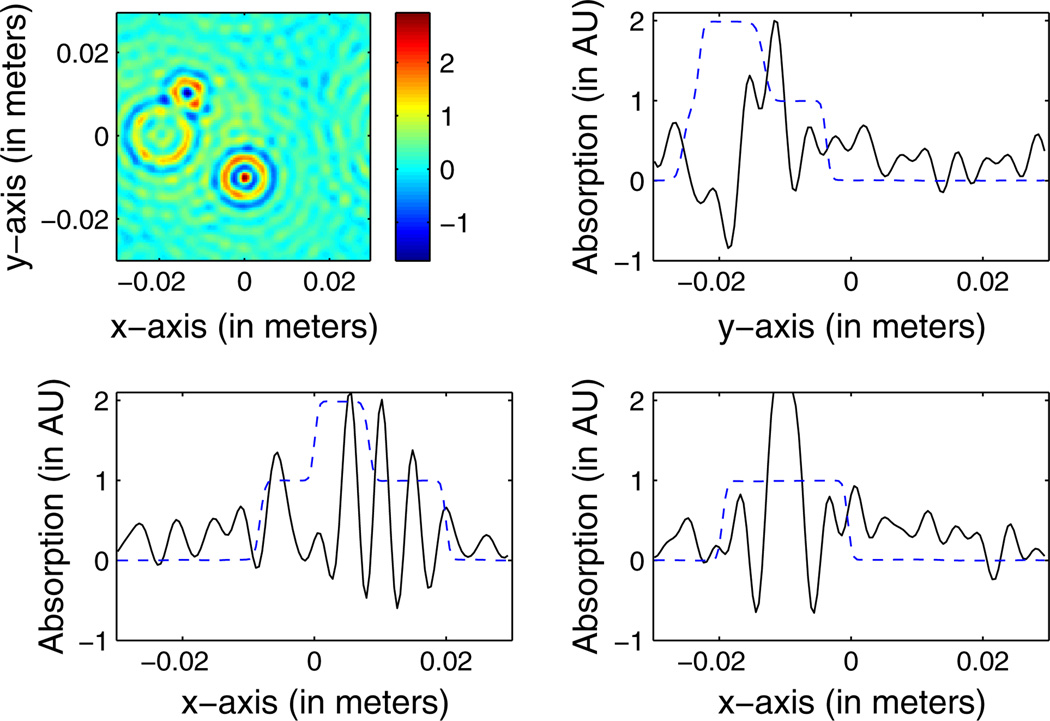
In Fig. 4, a 2D slice corresponding to the plane z = −2.76 cm is shown in the top left panel for reconstruction method (a). The other three panels contain line plots through the reconstructed image (in black) and the original phantom (in blue) along the lines x = 0.75 cm and z = −2.76 cm (top right), y = −1.33 cm and z = −2.61 cm (bottom left), and y = 1.42 cm and z = −2.52 cm (bottom right). Note that the reconstructed and original objects are so similar as to be indistinguishable. This is expected and corroborates the mathematical correctness of the reconstruction formula.
Fig. 4.
(Color online) Top left panel: An image of the numerical phantom in the plane z = −2.76 cm reconstructed by use of Eq. (25) from noiseless data. Top right panel: A profile through the reconstructed image (black) and original phantom (blue dashes) along the line x = 0.75 cm and z = −2.76 cm. Bottom left panel: The corresponding profiles along the line y = −1.33 cm and z = −2.61 cm. Bottom right panel: The corresponding profiles along the line y = 1.42 cm and z = −2.52 cm. Note that the reconstructed and original objects are so similar as to be indistinguishable.
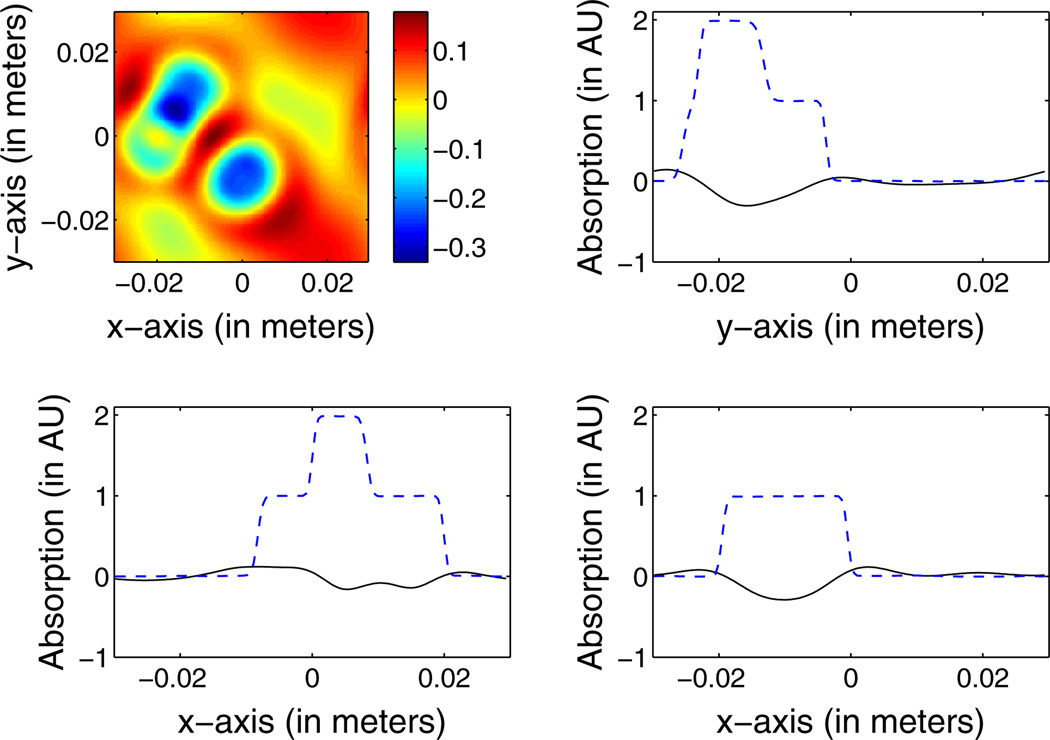
The improvement in reconstruction accuracy gained through use of the proposed algorithm is demonstrated in Figs. 5 and 6. In Fig. 5, a 2D slice corresponding to the plane z = −2.76 cm is shown in the top left panel for reconstruction method (b), the case when shear waves are not assumed in the imaging model but the layered medium supports them. A different low-pass filter (LPF) was used in reconstruction method (b) than in methods (a) or (c). The LPF was set to remove nonpropagating longitudinal waves in layer 3 (the layer with the largest speed of sound). In this example, shear waves propagate at a lower speed than longitudinal waves in layer 3, and so the spatial frequency cutoff on the LPF was much lower for method (b) when compared to methods (a) or (c). The other three panels contain line plots through the reconstructed image (in black) and the original phantom along the lines x = 0.75 cm and z = −2.76 cm (top right), y = −1.33 cm and z = −2.61 cm (bottom left), and y = 1.42 cm and z = −2.52 cm (bottom right). One sees that while there are qualitative similarities between the original object and the reconstruction, this reconstruction method is in no way capable of providing accurate, quantitatively useful estimates of the original PCT object when the object is embedded in a layered medium that supports shear waves.
Fig. 5.
(Color online) Top left panel: An image of the numerical phantom in the plane z = −2.76 cm reconstructed by use of algorithm (b) from noiseless data, i.e., the reconstruction assumes no elastic solids are present in the layered medium. Top right panel: A profile through the reconstructed image (black) and original phantom (blue dashes) along the line x = 0.75 cm and z = −2.76 cm. Bottom left panel: The corresponding profiles along the line y = −1.33 cm and z = −2.61 cm. Bottom right panel: The corresponding profiles along the line y = 1.42 cm and z = −2.52 cm.
Fig. 6.
(Color online) Top left panel: An image of the numerical phantom in the plane z = −2.76 cm reconstructed by use of algorithm (c) from noiseless data, i.e., the reconstruction algorithm assumes a homogenous background surrounding the PCT object. Top right panel: A profile through the reconstructed image (black) and original phantom (blue dashes) along the line x = 0.75 cm and z = −2.76 cm. Bottom left panel: The corresponding profiles along the line y = −1.33 cm and z = −2.61 cm. Bottom right panel: The corresponding profiles along the line y = 1.42 cm and z = −2.52 cm.
In Fig. 6, a 2D slice corresponding to the plane z = −2.76 cm is shown in the top left panel for reconstruction method (c), the case when a homogeneous fluid medium is assumed in the imaging model, i.e., Eq. (6). The other three panels contain line plots through the reconstructed image (in black) and the original phantom along the lines x = 0.75 cm and z = −2.76 cm (top right), y = −1.33 cm and z = −2.61 cm (bottom left), and y = 1.42 cm and z = −2.52 cm (bottom right). One notes that the homogeneous reconstruction method performs no better than the reconstruction method assuming four fluid layers—it is only possible to distinguish the existence of the two of the spheres in the plane z = −2.76 cm.
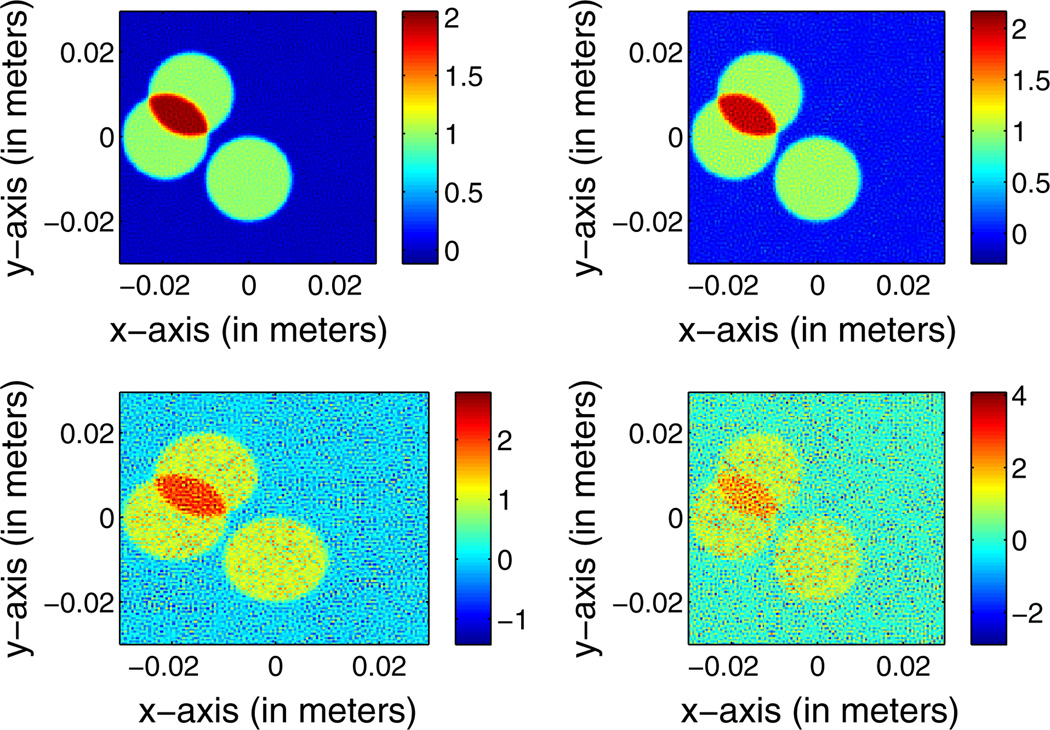
Finally, a preliminary investigation of the proposed algorithm’s robustness was performed with regards to stochastic measurement noise. In Fig. 7, a 2D slice through the plane z = −2.76 cm of the image reconstructed through application of Eq. (25) is shown for four realizations of noisy data for the case when the object is embedded in a four-layered system as described in Section 4. Reconstructions are shown for additive noise at 0.05% (top left panel), 0.1% (top right panel), 0.5% (bottom left panel), and 1% (bottom right panel). The noise level is referenced to the PCT signal as defined in Section 4.
Fig. 7.
(Color online) Images of the numerical phantom reconstructed in the plane z = −2.76 cm for four different noise levels: 0.05% (top left panel), 0.1% (top right panel), 0.5% (bottom left panel), and 1% (bottom right panel).
6. CONCLUSIONS
In this paper, a PCT reconstruction formula has been presented for the case when the optical absorber is embedded in a layered medium in which some of the layers support shear waves and/or posses dispersive and absorptive properties and when acoustical detection is performed on a planar surface parallel to the planes of the layered medium. The reconstruction formula demonstrates a mapping between the 3D Fourier transform of the optical absorber and the 3D Fourier transform of the acoustic pressure data acquired on the detection plane. The reconstruction formula was compared to two previous reconstruction formulae valid for the cases when the optical absorber is embedded in a homogenous medium and a layered fluid medium. It was shown that neither formula returns accurate estimates of object structure when the object is embedded in a layered medium that supports shear waves, although there is qualitative similarity between the output of the reconstruction formulae and the original phantom. Further work is required to account for more general geometries of solid heterogeneities in PCT.
ACKNOWLEDGMENTS
This research was support in part by National Institutes of Health (NIH) awards EB010049 and EB009715.
APPENDIX A
Construction of the dyadic Green function for the particle displacement in a layered medium generated by a PCT signal is most easily performed using the angular spectrum representation for the particle displacement. The Green function must satisfy the same boundary conditions that the particle displacement satisfies at each layer interface. These boundary conditions take the form (either for fluid–fluid or fluid–solid boundaries):
| (A1) |
| (A2) |
and (for fluid–solid boundaries only)
| (A3) |
where refers to the side of the boundary in the solid layer and it is assumed that the boundaries are all of the form z = zn. The σij denote stresses on the boundary, and take the form (in layer n)
| (A4) |
| (A5) |
Solid–solid boundary conditions can also be included [37,43], but are not within the scope of this manuscript. Substituting the angular spectrum representation for the particle displacement into the above boundary conditions yields boundary conditions that must be satisfied for each plane wave component labeled by (kx, ky, ω) [44]:
| (A6) |
| (A7) |
| (A8) |
| (A9) |
in fluid layers and
| (A10) |
| (A11) |
| (A12) |
| (A13) |
in the solid layers and the notation . Applying the dyadic identity operator for transverse fields, IT = I − k̂sk̂s [41], to the wave vector gives the polarization vector for the shear wave in each solid layer
| (A14) |
Note that the polarization direction, depends only on kx, ky and ks in the solid layer in the angular spectrum representation.
Finally, the equations for σxz and σyz reduce to
| (A15) |
| (A16) |
For a given configuration of solid and fluid layers (with no two adjacent solid layers), these sets of boundary conditions are sufficient to uniquely determine the dyadic Green function for the layered system. The system of equations that represent the boundary conditions may be written in matrix form as M̄ · a⃗ = s⃗, where M̄ is a matrix that depends only on the acoustic parameters of each layer, a⃗ is the vector of plane wave amplitudes, and s⃗ is the source term. One notes that T0 is the particle displacement plane wave transmission coefficient. The method of calculating these transmission coefficients is analogous to previous methods used for transcranial ultrasound [37].
The dyadic Green function for PCT for the system described in this manuscript is
| (A17) |
where it is understood that r′ is in layer M, r is in layer 0, and T0 is found from solving the boundary conditions above. Substituting the form of the dyadic Green function in Eq. (14) gives the particle displacement in the detection plane,
| (A18) |
Substitution of Eq. (A18) into Eq. (8) gives the pressure field generated by the PCT object at the detector plane.
Footnotes
OCIS codes: 110.5120, 110.3010.
REFERENCES
- 1.Wang LV. Prospects of photoacoustic tomography. Med. Phys. 2008;35:5758–5767. doi: 10.1118/1.3013698. [DOI] [PMC free article] [PubMed] [Google Scholar]
- 2.Xu M, Wang LV. Biomedical photoacoustics. Rev. Sci. Instrum. 2006;77 041101. [Google Scholar]
- 3.Oraevsky AA, Karabutov AA. Optoacoustic tomography. In: Vo-Dinh T, editor. Biomedical Photonics Handbook. CRC Press; 2003. [Google Scholar]
- 4.Wang L, editor. Photoacoustic Imaging and Spectroscopy. CRC; 2009. [Google Scholar]
- 5.Joines W, Jirtle R, Rafal M, Schaeffer D. Microwave power absorption differences between normal and malignant tissue. Int. J Radiat. Oncol. Biol. Phys. 1980;6:681–687. doi: 10.1016/0360-3016(80)90223-0. [DOI] [PubMed] [Google Scholar]
- 6.Cheong W, Prahl S, Welch A. A review of the optical properties of biological tissues. IEEE J. Quantum Electron. 1990;26:2166–2185. [Google Scholar]
- 7.Ntziachristos V, Razansky D. Molecular imaging by means of multispectral optoacoustic tomography (MSOT) Chem. Rev. 2010;110:2783–2794. doi: 10.1021/cr9002566. [DOI] [PubMed] [Google Scholar]
- 8.Kruger R, Reinecke D, Kruger G. Thermoacoustic computed tomography—technical considerations. Med. Phys. 1999;26:1832–1837. doi: 10.1118/1.598688. [DOI] [PubMed] [Google Scholar]
- 9.Haltmeier M, Scherzer O, Burgholzer P, Paltauf G. Thermoacoustic computed tomography with large planar receivers. Inverse Probl. 2004;20:1663–1673. [Google Scholar]
- 10.Ephrat P, Keenliside L, Seabrook A, Prato FS, Carson JJL. Three-dimensional photoacoustic imaging by sparse-array detection and iterative image reconstruction. J. Biomed. Opt. 2008;13 doi: 10.1117/1.2992131. 054052. [DOI] [PubMed] [Google Scholar]
- 11.Cox BT, Arridge SR, Köstli KP, Beard PC. Two-dimensional quantitative photoacoustic image reconstruction of absorption distributions in scattering media by use of a simple iterative method. Appl. Opt. 2006;45:1866–1875. doi: 10.1364/ao.45.001866. [DOI] [PubMed] [Google Scholar]
- 12.Wang K, Ermilov S, Su R, Brecht H, Oraevsky A, Anastasio M. An imaging model incorporating ultrasonic transducer properties for three-dimensional optoacoustic tomography. IEEE Trans. Med. Imaging. 2011;30:203–214. doi: 10.1109/TMI.2010.2072514. [DOI] [PMC free article] [PubMed] [Google Scholar]
- 13.Anastasio MA, Zhang J, Modgil D, Riviere PJL. Application of inverse source concepts to photoacoustic tomography. Inverse Probl. 2007;23:S21–S35. [Google Scholar]
- 14.Kunyansky LA. Explicit inversion formulae for the spherical mean radon transform. Inverse Probl. 2007;23:373–383. [Google Scholar]
- 15.Finch D, Haltmeier M, Rakesh Inversion of spherical means and the wave equation in even dimensions. SIAM J. Appl. Math. 2007;68:392–412. [Google Scholar]
- 16.Xu M, Wang LV. Universal back-projection algorithm for photoacoustic computed tomography. Phys. Rev. E. 2005;71 doi: 10.1103/PhysRevE.71.016706. 016706. [DOI] [PubMed] [Google Scholar]
- 17.Finch D, Patch S, Rakesh Determining a function from its mean values over a family of spheres. SIAM J. Math. Anal. 2004;35:1213–1240. [Google Scholar]
- 18.Xu Y, Feng D, Wang LV. Exact frequency-domain reconstruction for thermoacoustic tomography: I. Planar geometry. IEEE Trans. Med. Imaging. 2002;21:823–828. doi: 10.1109/tmi.2002.801172. [DOI] [PubMed] [Google Scholar]
- 19.Köstli KP, Frenz M, Bebie H, Weber HP. Temporal backward projection of optoacoustic pressure transients using Fourier transform methods. Phys. Med. Biol. 2001;46:1863–1872. doi: 10.1088/0031-9155/46/7/309. [DOI] [PubMed] [Google Scholar]
- 20.Kruger RA, Liu P, Fang R, Appledorn C. Photoacoustic ultrasound (PAUS) reconstruction tomography. Med. Phys. 1995;22:1605–1609. doi: 10.1118/1.597429. [DOI] [PubMed] [Google Scholar]
- 21.Xu Y, Wang LV. Effects of acoustic heterogeneity in breast thermoacoustic tomography. IEEE Trans. Ultrason. Ferroelectr. Freq. Control. 2003;50:1134–1146. doi: 10.1109/tuffc.2003.1235325. [DOI] [PubMed] [Google Scholar]
- 22.Anastasio MA, Zhang J, Pan X, Zou Y, Keng G, Wang LV. Half-time image reconstruction in thermoacoustic tomography. IEEE Trans. Med. Imaging. 2005;24:199–210. doi: 10.1109/tmi.2004.839682. [DOI] [PubMed] [Google Scholar]
- 23.La Riviere PJ, Zhang J, Anastasio MA. Image reconstruction in optoacoustic tomography for dispersive acoustic media. Opt. Lett. 2006;31:781–783. doi: 10.1364/ol.31.000781. [DOI] [PubMed] [Google Scholar]
- 24.Treeby B, Zhang E, Cox B. Photoacoustic tomography in absorbing acoustic media using time reversal. Inverse Probl. 2010;26 115003. [Google Scholar]
- 25.Wang L, Yang X. Boundary conditions in photoacoustic tomography and image reconstruction. J. Biomed. Opt. 2007;12 doi: 10.1117/1.2709861. 014027. [DOI] [PubMed] [Google Scholar]
- 26.Schoonover RW, Anastasio MA. Image reconstruction in photoacoustic tomography involving layered acoustic media. J. Opt. Soc. Am. A. 2011;28:1114–1120. doi: 10.1364/JOSAA.28.001114. [DOI] [PMC free article] [PubMed] [Google Scholar]
- 27.Modgil D, Anastasio MA, Rivière PJL. Image reconstruction in photoacoustic tomography with variable speed of sound using a higher-order geometrical acoustics approximation. J. Biomed. Opt. 2010;15 doi: 10.1117/1.3333550. 021308. [DOI] [PubMed] [Google Scholar]
- 28.Agranovsky M, Kuchment P. Uniqueness of reconstruction and an inversion procedure for thermoacoustic and photoacoustic tomography with variable sound speed. Inverse Probl. 2007;23:2089–2102. [Google Scholar]
- 29.Jin X, Wang LV. Thermoacoustic tomography with correction for acoustic speed variations. Phys. Med. Biol. 2006;51:6437–6448. doi: 10.1088/0031-9155/51/24/010. [DOI] [PubMed] [Google Scholar]
- 30.Willemink R, Manohar S, Purwar Y, Slump C, van der Heijden F, van Leeuwen T. Imaging of acoustic attenuation and speed of sound maps using photoacoustic measurements. Proc. SPIE. 2008;6920 692013. [Google Scholar]
- 31.Hristova Y, Kuchment P, Nguyen L. Reconstruction and time reversal in thermoacoustic tomography in acoustically homogeneous and inhomogeneous media. Inverse Probl. 2008;24 055006. [Google Scholar]
- 32.Stefanov P, Uhlmann G. Thermoacoustic tomography with variable sound speed. Inverse Probl. 2009;25 075011. [Google Scholar]
- 33.Yang X, Wang LV. Monkey brain cortex imaging by photoacoustic tomography. J. Biomed. Opt. 2008;13 doi: 10.1117/1.2967907. 044009. [DOI] [PubMed] [Google Scholar]
- 34.Jin X, Li C, Wang LV. Effects of acoustic heterogeneities on transcranial brain imaging with microwave-induced thermoacoustic tomography. Med. Phys. 2008;35:3205–3214. doi: 10.1118/1.2938731. [DOI] [PMC free article] [PubMed] [Google Scholar]
- 35.Fry F, Barger J. Acoustical properties of the human skull. J. Acoust. Soc. Am. 1978;63:1576–1590. doi: 10.1121/1.381852. [DOI] [PubMed] [Google Scholar]
- 36.Yousefi A, Goertz D, Hynynen K. Transcranial shear-mode ultrasound: assessment of imaging performance and excitation techniques. IEEE Trans. Med. Imaging. 2009;28:763–774. doi: 10.1109/TMI.2008.2012017. [DOI] [PubMed] [Google Scholar]
- 37.Hayner M, Hynynen K. Numerical analysis of ultrasonic transmission and absorption of oblique plane waves through the human skull. J. Acoust. Soc. Am. 2001;110:3319–3330. doi: 10.1121/1.1410964. [DOI] [PubMed] [Google Scholar]
- 38.Baikov S, Molotilov A, Svet V. Physical and technological aspects of ultrasonic imaging of brain structures through thick skull bones. 1. theoretical and model studies. Acoust. Phys. 2003;49:276–284. [Google Scholar]
- 39.Haltmeier M, Scherzer O, Zangerl G. A reconstruction algorithm for photoacoustic imaging based on the nonuniform FFT. IEEE Trans. Med. Imaging. 2009;28:1727–1735. doi: 10.1109/TMI.2009.2022623. [DOI] [PubMed] [Google Scholar]
- 40.Morse PM, Ingard KU. Theoretical Acoustics. Princeton Univ. Press; 1986. [Google Scholar]
- 41.Chew WC. Waves and Fields in Inhomogeneous Media. Springer; 1995. [Google Scholar]
- 42.Mandel L, Wolf E. Optical Coherence and Quantum Optics. Cambridge Univ. Press; 1995. [Google Scholar]
- 43.Graff K. Wave Motion in Elastic Solids. Dover; 1975. [Google Scholar]
- 44.Schmidt H, Jensen F. A full wave solution for propagation in multilayered viscoelastic media with application to Gaussian beam reflection at fluid–solid interfaces. J. Acoust. Soc. Am. 1985;77:813–825. [Google Scholar]


