Abstract
Acute and chronic cutaneous wounds remain a clinical challenge that require a mechanistic understanding to advance treatment options. For example, the role of inflammatory mediators during wound healing is not completely understood. Biomimetic materials, such as an in situ photopolymerizable semi-interpenetrating network (sIPN) derived from extracellular matrix components, show great potential in improving healing through the delivery of therapeutic agents and the function as a temporary tissue scaffold. In this study, we characterized the temporal profile of porcine cutaneous partial-thickness wound healing in response to Xeroform™ and sIPN treatment via histological and inflammatory protein analyses in epidermal, remodeling dermal, and dermal regions. Generally, interleukin (IL)-1β, IL-2, IL-4, IL-6, IL-10, IL-12p70, interferon-γ, and tumor necrosis factor-α, but not IL-8, were expressed in the epidermis and remodeling dermis in a time course that followed the progression of epidermal maturation in response to both treatments. Differences in cellularity and protein expression were observed between treatments in a time- and region-dependent manner. In particular, the healing response to sIPN exemplified a potentially key relationship between IL-8 expression and reepithelialization. These results provide insights into the expression of inflammatory mediators and the time course of cutaneous healing and the capacity for biomaterials to further modulate this relationship.
Epidermal autograft donor site wounds remain a major clinical challenge where infection, long healing times, poor quality of healed tissue, and hypertrophic scarring are common outcomes. In order to address these outcomes through improved treatment, a greater understanding of the wound environment is required. Inflammation is involved in all processes associated with wound healing from hemostasis to reepithelialization, granulation, and remodeling.1 A number of key factors have been shown to be involved in modulating the inflammatory response throughout the phases of wound healing, such as interleukin (IL)-1β, IL-2, IL-4, IL-6, IL-8, IL-10, IL-12p70, interferon-γ (IFN-γ), and tumor necrosis factor-α (TNF-α). IL-1β is a broad-spectrum pro-inflammatory mediator that can induce the expression of dozens of known proinflammatory mediators from many cell types.1,2 With respect to acute cutaneous wounds, IL-1β is associated with keratinocyte migration and proliferation and guiding leukocyte recruitment.1,3 Once known as T-cell growth factor and B-cell differentiation factor, respectively, IL-2 and IL-4 are most often associated with acquired immunity through T-cell differentiation, proliferation, and activation in wounds challenged with pro-immune stimuli.4–7 These cytokines are commonly analyzed as indicators of infection and material biocompatibility.8 IL-6 is also associated with keratinocyte proliferation and leukocyte recruitment, specifically neutrophils.1,7,9 Thus, IL-6 has been shown to be an effective biomarker of pro-inflammatory activity and reepithelialization, particularly when minimal epidermis is present.8,10 Chemokine IL-8 is a pro-inflammatory chemokine that is most often associated with leukocyte chemotaxis.4,7,11 However, some studies have shown that IL-8 has a concentration- and potentially time-dependent effect on keratinocyte proliferation in the epidermis.3,12–15 The suggested roles of IL-8 in the epidermis render it a potentially critical regulator of the rate of reepithelialization within the epidermis and inflammation within the dermis. Broad-spectrum anti-inflammatory cytokine IL-10 opposes the activity of other pro-inflammatory cytokines by inhibiting the activity of leukocytes and subsequently reducing expression of IL-1β, IL-2, IL-6, IL-12p70, IFN-γ, TNF-α, as well as others.7,16,17 Some evidence has even shown that IL-10 is autoinhibitory in monocytes.18 Once known as the T-cell stimulating factor, IL-12p70 is the active subunit of IL-12 that is not only primarily associated with the activation of natural killer and T cells but also stimulates or is coexpressed with IFN-γ.7,19 It has been shown to exhibit a comparative time course of expression with respect to IFN-γ, which is associated with antigen recognition, processing, and presentation that give rise to activation and chemotactic recruitment of various leukocytes.6,19 In acute cutaneous wounds, IFN-γ reduces the rate of reepithelialization, angiogenesis, and collagen production.20 The time course of IFN-γ expression may represent the balance between healing and inflammation and may indicate the overall rate of healing. Pro-inflammatory cytokine TNF-α is produced by inflammatory leukocytes that can mediate neutrophil activity and the production of degradative matrix metalloproteinases through activity on fibroblasts.1,21 The time course of TNF-α expression may help to determine the amount and quality of extracellular matrix (ECM) proteins in dermal tissue. It should be noted that the aforementioned studies embody a wide range of animal models (i.e., transgenics, normal rodents, pharmaceutical agents), types of data (i.e., mRNA, qualitative histology), and in vitro conditions (i.e., cell source, serum supplementation). Thus, there exists certain in vitro–in vivo disconnects that contribute to our incomplete understanding of the wound-healing mechanism to acute cutaneous wounds in clinically relevant models. For example, IL-1β, IL-6, IL-8, IL-10, IFN-γ, and TNF-α have been implicated to impede keratinocyte proliferation in vitro and reepithelialization in vivo. While some studies contradict these findings and have shown that IL-1β, IL-6, IL-8, IL-10, and TNF-α promote certain aspects of cutaneous healing. Therefore, we need a baseline analysis of the inflammatory protein expression in clinically relevant wound models. The information, in return, is critical for the future development of biomaterial-based treatment options.
Wound treatments should meet four primary requirements: removal of nonviable or necrotic tissue, eradicate and prevent microbial infiltrate, absorb exudate, and promote reepithelialization. A semi-interpenetrating network (sIPN) derived from ECM components is an in situ photopolymerizable wound treatment system that has been shown to be an effective treatment for partial and full-thickness wounds by facilitating these four key requirements for healing.22–24 sIPNs are applied as a solution of gelatin and photocrosslinkable poly(ethylene glycol) diacrylate, and subsequently polymerized in situ to support intimate interaction with the wound bed of complex topography and size. The hydrogel-like properties of the sIPN facilitate delivery of drugs, growth factors, antibodies, or adhesive peptides directly at the wound site.22,24,25 Therefore, the sIPN is a well-controlled and unique tool to study material-mediated inflammatory host response and the eventual healing as characterized by reepithelialization in acute cutaneous wounds.
MATERIALS AND METHODS
sIPN preparation and application
Unpolymerized sIPN solution was prepared with 20% w/v gelatin (Type A from porcine, 300 bloom, Sigma Aldrich, St. Louis, MO) and 30% w/v poly(ethylene glycol) diacrylate (inhibitor removed by alumina column purification, Mn ~ 575, Sigma Aldrich) in water at 50 °C. 2,2-Dimethoxy-2-phenylacetophenone, dissolved in poly(ethylene glycol) diacrylate, was added to this solution immediately before wound application in situ.
Animal welfare
This study was conducted in accordance with the approved UW—Madison Research Animal Resource Center protocol M01653. Animal care and use protocols approved through the University of Wisconsin (UW)—Madison Research Animal Resource Center are validated through the approval of United States Department of Agriculture, Public Health Service, Office of Lab Animal Welfare, UW—Madison Institutional Animal Care and Use Committees, Association for the Assessment and Accreditation of Laboratory Animal Care, and all in accordance with the Animal Welfare Act. The guidelines set forth by these institutions are actively overseen and reviewed by staff and extramural independent observers at each Lab Animal Resource center associated with UW—Madison.
Animal procedures
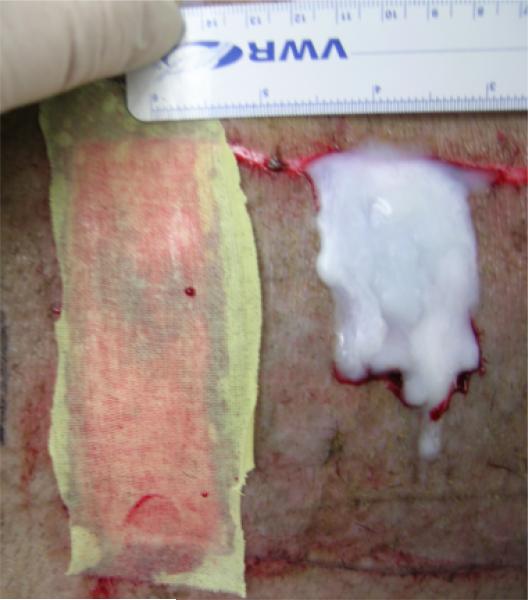
Approximately 25 kg, 6-month-old Yucatan pigs (Sinclair Research Center Inc., Columbia, MO) were used for this study. Anesthesia was induced with Telazol® and xylazine, and then maintained with isoflurane while monitoring pulse oxygenation and heart rate. Pig backs were shaved and prepared with Betadine® and subcutaneous clysis solution containing bupivacaine and epinephrine. Wounds covering 5.4% (300 cm2) total body surface area were produced using an electric dermatome set at 0.022 and 0.030 in. Previous studies have indicated that these cut depths remove a significant portion of the epidermal tissue in Yucatan pigs, and that significant differences in healing rate quality occur between these depths.24 Treatments were applied and interpositioned with epidermal auto-grafts to maintain a controlled spacing between the two treatments, sIPN and Xeroform™. Xeroform™ was used as a current clinical control due to broad worldwide use for partial thickness wounds. Xeroform™ and autografts were immobilized with staples. sIPN was applied to the wound dropwise under simultaneous UV light (Clearstone Technologies CF1000 with 365 nm LED head, Minneapolis, MN) exposure until polymerized (approximately 1 minute, Figure 1). Xeroform™ and sIPN treatments are shown in Figure 1. Treatments were overlaid with burn gauze, Coban™, and tape. Animals were treated with buprenorphine for pain for first 4 days after wounding. Pigs were housed independently with unrestricted movement in pens at the UW—Madison Medical Science Center and fed daily with no dietary restrictions. Bandages were removed on postoperative day 10, and no treatments were reapplied at that time or thereafter. On the day of euthanasia, pigs were injected with Beuthanasia-D and monitored for cessation of pulse oxygenation and heart rate.
Figure 1.
Photograph of Xeroform™ and semi-interpenetrating network treatments applied to partial thickness wounds and interpositioned with skin autograft.
Tissue processing for histological and protein analyses
Tissues were harvested after euthanasia and embedded in Optimal Cutting Temperature compound (Tissue-Tek®, Sakura Finetek, Torrence, CA) in large cryomolds. Cryomolds were then plunged into isopentane cooled with liquid N2 until completely frozen. Tissues were stored at –80 °C until sectioning on cryostat and processing for microscopy or microdissection. For histological evaluation, sections were warmed to –20 °C in the cryostat environment, then sectioned at 10 μm and mounted on positively charged glass slides. Slides were fixed briefly in 10% neutral buffered formalin and then dried. Sections were rehydrated briefly and then stained with hematoxylin and eosin.
We used a previously published protocol for the quantitative histological evaluation.23,24 Ten regions of each tissue section were observed by a single experienced blinded observer using a light microscope (i.e., five from the epidermis and five from the dermis). Viewing regions were evenly spaced across the length of the biopsy. Cell types were differentiated based on morphology, and then quantified. For epidermal cell counts and measurements, data were collected for keratinocyte density (normalized to stratum spinosum area), stratum spinosum thickness, stratum corneum thickness, and melanocyte density (normalized to stratum basale length). For dermal cell counts and measurements, viewing regions were positioned toward the outermost surface of viable dermis or granulation tissue. These regions were aligned and oriented in the same manner for every section examined to ensure consistency in analysis. Data were collected for polymorphonuclear leukocyte density, macrophage density, lymphocyte density, remodeling tissue thickness, and fibroblast density (all densities normalized to the area of viewing region). Thicknesses, lengths, and areas were calculated using National Institutes of Health ImageJ (National Institutes of Health, Washington, DC) image processing and analysis software. Quantitative histological analysis of keratinocytes, leukocytes, fibroblasts, and other tissue features using morphological identification has been extensively validated throughout recent literature and more specifically in our recent studies, which characterized healing histologically in partial thickness swine wound models.23,24,26–28 Comparable differential cell counts were observed from cryosections and formalin-fixed paraffin-embedded sections. Thus, results obtained from cryosections are presented herein to allow for the pairing of histological analysis and protein analysis.
For protein analysis, sections were warmed to –20 °C in the cryostat environment, then sectioned at 55 μm, and mounted on positively charged glass slides. Slides were dehydrated in graded alcohols: 70% ethanol with 3% glycerol, 95% ethanol, 100% ethanol, and isopropyl alcohol. Slides were then dried for microdissection on a stereo dissecting microscope (Celstron, Torrance, CA) and protein analysis. The epidermis, remodeling region, and dermis of each tissue section were manually microdissected. Regions were stored separately for subsequent protein analysis. The “epidermis” was defined as the region above the dermis and was microdissected immediately beneath the stratum basale.29,30 The “remodeling dermis” was defined as the region undergoing significant transition, granulation, or remodeling of the ECM.29,30 The remodeling dermis was microdissected at the junction between the remodeling tissue and the healthy underlying dermis. The “underlying dermis” was defined as the region adjacent to the subcutaneous fat, which displayed normally organized, bundled ECM. In samples lacking a confluent and distinct stratum basale, all tissue above the healthy underlying dermis was treated as remodeling dermal tissue. In samples where a confluent stratum basale was observed, the granulation tissue between epidermis and underlying healthy dermis was labeled remodeling tissue. Lysis buffer containing 6 M urea, 4% CHAPS, 40 mM Tris-base, 0.5% v/v Triton X-100, and Halt protease inhibitor cocktail was added to the pooled isolated sections from each region. Solutions containing these regions were microsonicated in pulses on ice until homogenized. Solutions were centrifuged and supernatants were alliquoted into two parts for each of the two assays conducted. A standard bicinchonic acid assay kit (BCA Protein Assay Reagent Kit, Pierce Biotechnology, Rockford, IL) was used to determine the total protein. Bovine serum albumin standards were dissolved in lysis buffer. Subsequently, a 9-plex porcine cytokine enzyme-linked immunosorbent assay (ELISA) array (SearchLight, Aushon Biosystems, Billerica, MA) was used to assess the specific amounts of IFN-γ, IL-1β, IL-2, IL-4, IL-6, IL-8, IL-10, IL-12 p70, and TNF-α. Luminescent signal was imaged via the Xenogen IVIS 200 live imaging system for 0.5 seconds exposure at 0.6 mm stage height. Total photon flux data were collected via Living Image 3.1. Background flux values were collected from regions outside the area of ELISA plate. Photon scattering between adjacent capture antibodies was segregated through uniformly sized and positioned region of interest grids (3 squares × 3 squares).
Statistical analyses
Two pigs were wounded and treated for each time period and cut depth. For cellular profiles, data from all five viewing regions of both pigs at each time point, treatment type, and cut depth were analyzed as a pooled mean. Statistically significant differences were determined by Student's t-test (p < 0.05). For protein profiles, unwounded data were collected from tissue harvested from two independent pigs for each treatment time period. Data from Xeroform™-treated or sIPN-treated wounds were collected from three separate tissue blocks and two independent pigs to give a total sample of six. Statistically significant difference between treated wound site tissues and unwounded tissues (represented by U in all figures) were determined by Welch's t-test for unequal variance (p <0.05). Statistically significant difference between treated wound site tissues (represented by X in all figures) was determined by Student's t-test (p < 0.05). Some tissue regions were not present in all samples. For example, unwounded tissues contained no remodeling region, and epidermal tissue was not present in many tissue samples from early time points. Wounded remodeling region protein concentrations were compared with unwounded dermal protein concentrations.
Analysis of data reproducibility for the quantification of each protein was showed by the coefficient of variance (shown as percentage) according to methods used by Wong et al.31 The coefficient of variance was calculated as (standard deviation/mean)×100. These values represent the coefficient of variance between the tissue replicates within each of the two pigs per time point (n=2). Correlations between paired data were analyzed using Spearman's rank order coefficient (ρ) where –1 < ρ < 1, according to methods by Wong et al.31 Values approaching –1 or 1 indicate a strong correlation while values approaching zero indicate poor correlation. Correlations between individual protein concentrations within the epidermis, within the remodeling region, and between these two regions as well as between each individual protein concentration and keratinocyte density, macrophage/monocyte density, lymphocyte density, or fibroblast density were assessed. Keratinocyte density was correlated with epidermal protein concentrations while keratinocyte, macrophage/monocyte, lymphocyte, and fibroblast densities were correlated with remodeling region protein concentrations. Where no confluent epidermis was observed, epidermal protein and cell data were immuted by omission for the coefficient of variance and ρ calculation.
RESULTS
Coefficient of variance analysis
Coefficient of variance values are shown in Table 1 as a statistical indicator of method reproducibility within the three tissue replicates of each of the two pigs per time point. Coefficient of variance values (Table 1) represent the pooled mean of all treatments, time points, and animals for each region and specific cytokine or chemokine. Coefficient of variance values above 100% indicate low reproducibility, while values below 100% indicate high reproducibility, which is maximized at 0%. Coefficient of variance values among all tissue samples ranged from 52 to 88%. Remodeling dermal tissue yielded the lower coefficient of variance values than epidermal or underlying dermal tissue, while epidermal and underlying dermal tissue yielded higher coefficient of variance values. Thus, differences in quantitative histology and protein data among epidermal, remodeling dermal, and underlying dermal regions contributed to varied coefficient of variance values.
Table 1.
Coefficient of variance as an indicator of the reproducibility of the analysis method
| IL-1β (%) | IL-2 (%) | IL-4 (%) | IL-6 (%) | IL-8 (%) | IL-10 (%) | IL-12p70 (%) | IFN-γ (%) | TNF-α (%) | |
|---|---|---|---|---|---|---|---|---|---|
| Epidermis | 74.7 | 82.5 | 84.3 | 74.1 | 77.3 | 76.6 | 74.8 | 80.9 | 75.9 |
| Remodeling dermis | 65.2 | 70.5 | 67.0 | 55.9 | 60.5 | 61.8 | 52.6 | 66.3 | 56.0 |
| Dermis | 85.6 | 77.1 | 88.2 | 78.2 | 75.9 | 78.8 | 71.0 | 79.7 | 77.0 |
| Overall | 75.4 | 76.3 | 79.7 | 69.3 | 70.9 | 72.3 | 65.7 | 75.4 | 69.4 |
Histological analysis
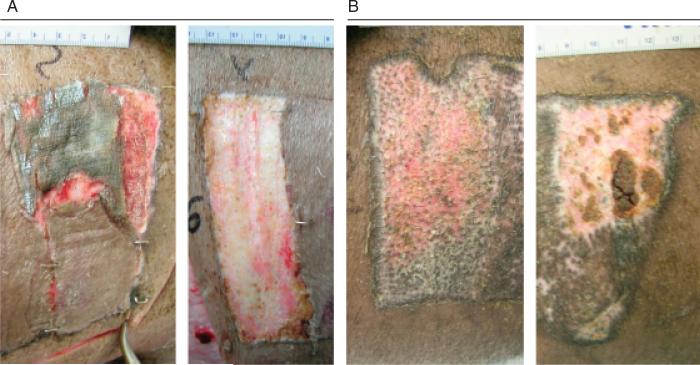
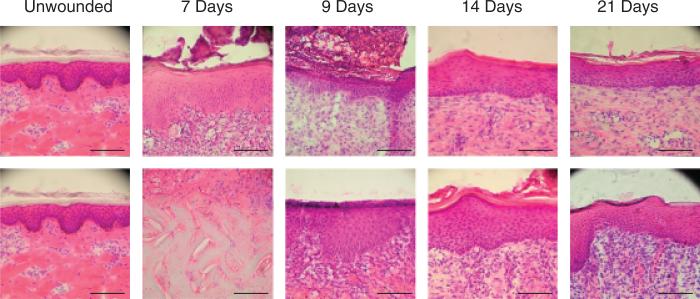
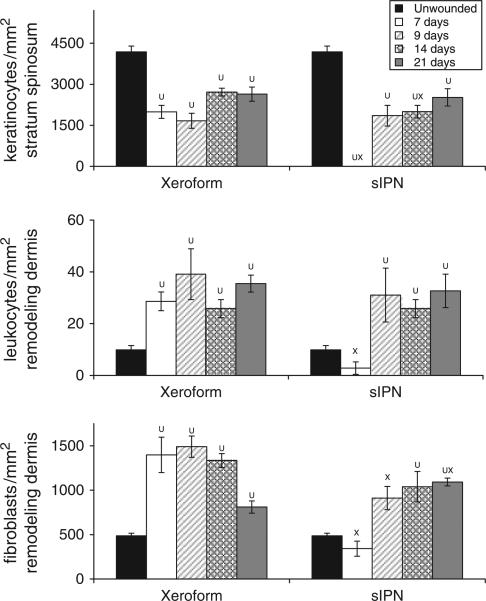
Gross observation of these wounds at 7 days shows that Xeroform™ treatment resulted in reepithelialization whereby removal of dressings did not lead to bleeding or exudation (Figure 2A). sIPN remained tightly adhered to the wound surface along with the fibrin clot matrix at postoperative day 7. Removal of the sIPN led to some bleeding and exudation. Histological observation showed partially epithelialized wound surfaces beneath Xeroform™ treatment, while sIPN-treated wounds showed increasing amounts of epithelialization up to 14 days (Figure 3). At 14 days, sIPN-treated wounds were fully epithelialized. In Xeroform™-treated wounds, the epithelium approached complete wound coverage at 7 and 9 days and displayed complete coverage at 14 and 21 days. At 14 days, dermal remodeling was quite extensive, but began to resolve at 21 days as the ECM became more organized and leukocyte and fibroblast densities were reduced. At 21 days, wounds exhibited comparable healing by gross observation, with hair growth through the surface of wounds treated with either Xeroform™ or sIPN (Figures 2B and 3). Also at 21 days, Xeroform™ and sIPN showed comparable maturity in epidermal development with a reduction in the overall thickness and the formation of stratum corneum. Throughout the formation and maturation of the epidermis, keratinocyte density was consistent from day 7 to day 21 for Xeroform™-treated wounds with the exception of a subtle decrease at day 9. Keratinocyte density increased from no epidermis at day 7 to a plateau by day 9 for sIPN-treated wounds (Figure 4). At 21 days, keratinocyte density remained significantly different from unwounded tissue for both treatment types. Furthermore, there was no significant difference observed in keratinocyte density between the two treatments.24 Remodeling dermal tissue showed maturation toward the restoration of thick, bundled ECM by 21 days. Overall leukocyte density was sustained significantly above unwounded levels for both treatment types suggesting a level of inflammation that had yet to be completely attenuated (Figures 3 and 4). Fibroblastic infiltration was associated with the initiation of dermal remodeling at 7 and 9 days in wounds treated with Xeroform™ or sIPN (Figures 3 and 4). At 21 days, Xeroform™-treated wounds showed a reduction in fibro-blast density, which was significantly lower than that of sIPN-treated wounds. However, fibroblast densities were consistently higher than that of unwounded tissue for both treatment types.
Figure 2.
(A) Photograph of 0.022 in. cut depth wounds treated with Xeroform™ (left) or semi-interpenetrating network (sIPN) (right) after 7 days of treatment. To reveal the wound bed, some sIPN had been removed from the upper right corner of the wound postmortem, while all of Xeroform™ was removed. (B) Photograph of 0.022 in. cut depth wounds treated with Xeroform™ (left) or sIPN (right) after 21 days of treatment.
Figure 3.
Photomicrographs of 0.022 in. cut depth wounds treated with Xeroform™ (top) or semi-interpenetrating network (bottom) after postoperative days 7, 9, 14, or 21. Tissues are oriented within the photograph to align the apical surfaces of each wound section, thus focusing on the epidermis. Where epidermis has not yet formed, the interface between the underlying dermis and the fibrin clot matrix is aligned. (Hematoxylin & eosin stain, objective magnification ×20, scale bar represents 0.1 mm).
Figure 4.
Cellular density within 0.022 in. cut depth wounds dressed with Xeroform™ or semi-interpenetrating network (sIPN). Viable keratinocyte density with the stratum spinosum (top), leukocyte density within the remodeling dermis (middle), and fibroblast density with the remodeling dermis (bottom) are displayed. Data are reported as an average of 10 total viewing regions from biopsies of two separate pigs ± standard error. X represents significant difference from Xeroform™. U represents significant difference from unwounded tissue (p < 0.05).24
The deeper cut depth, 0.030 in., showed a reduced rate of reepithelialization in comparison with the 0.022 in. cut depth. As indicated by leukocyte density, enhanced inflammation was observed at postoperative days 7 or 9, which was during the initial phases of reepithelialization (supporting information Figure S1). Confluent epidermal coverage was not observed until 14 days in response to either treatment. However, even at 14 and 21 days, after complete coverage was observed, keratinocyte density remained low in comparison with the 0.022 in. cut depth. By 21 days, gross wound appearance was comparable between cut depths, but differentiated cell counts indicated reduced keratinocyte densities in the 0.030 in. cut depth wounds. Taken together, concurrent protein analyses can provide additional insights into the time course of the inflammatory response and reepithelialization.
Regional cytokine and chemokine analysis
sIPN-treated wounds were compared with those treated with Xeroform™ at two cut depths in separately microdissected epidermal, remodeling dermal, and underlying dermal regions. IL-1β, IL-6, IL-8, IL-10, IFN-γ, and TNF-α concentration profiles from each region of 0.022 in. cut depth wounds are shown in Figures 5–10 and IL-2, IL-4, and IL-12p70 expressions are shown in Figures S2–S4. Concentration profiles of these proteins found at the 0.030 in. cut depth are shown in Figures S5–S13. These data will be discussed with respect to each tissue region.
Figure 5.
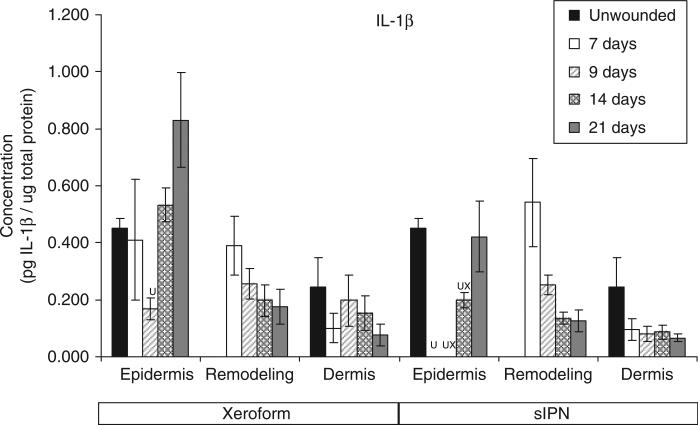
Interleukin-1β (IL-1β) concentration in epidermal, remodeling dermal, and dermal tissues wounded at 0.022 in. cut depth and treated with Xeroform™ or semi-interpenetrating network (sIPN). Data shown as mean ± standard error of n=2 pigs with three replicates of each n-value for each time point and treatment type. X represents significant difference from Xeroform™, and U represents significant difference from unwounded tissue at p < 0.05. Remodeling dermal tissue is statistically compared with the unwounded dermal tissue for all treatment types and time points.
Figure 10.
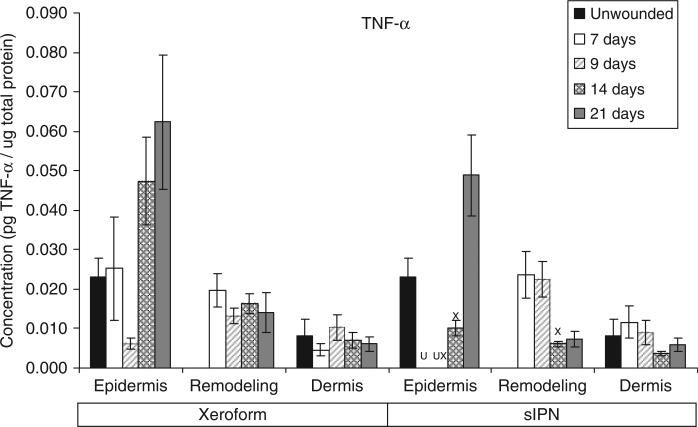
TNF-α concentration in epidermal, remodeling dermal, and dermal tissues wounded at 0.022 in. cut depth and treated with Xeroform™ or semi-interpenetrating network (sIPN). Data shown as mean ± standard error of n=2 pigs and three replicates of each n-value for each time point and treatment type. X represents significant difference from Xeroform™, and U represents significant difference from unwounded tissue at p < 0.05. Remodeling dermal tissue is statistically compared with the unwounded dermal tissue for all treatment types and time points.
Epidermis
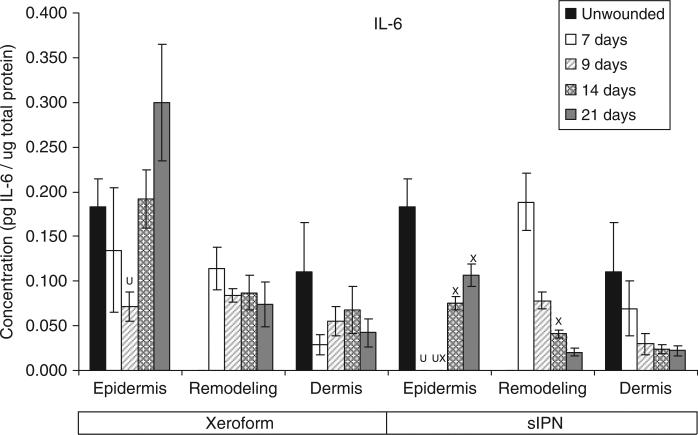
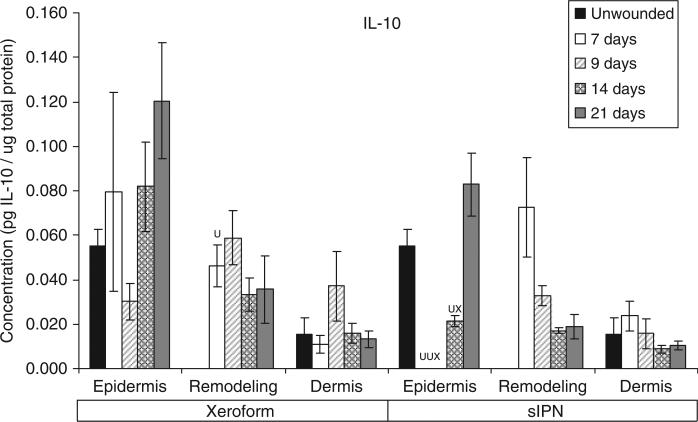
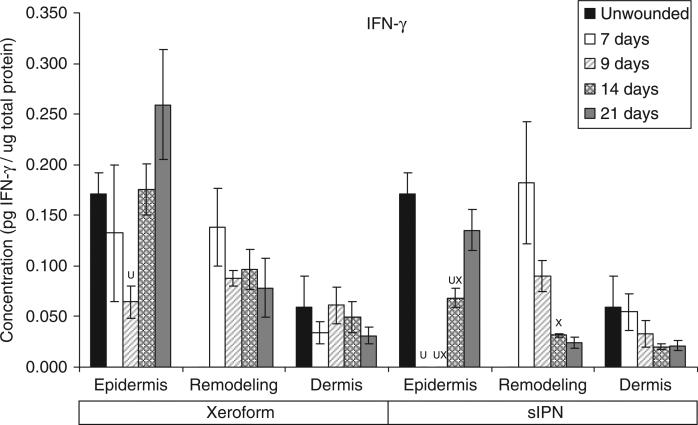
The general time course and rate of reepithelialization correlated positively with cytokine concentrations, except for chemokine IL-8, up toward or above that of unwounded tissue concentrations by 21 days for both Xeroform™ and sIPN treatments (Figures 5–10, S2–S4). The rate of reepithelialization as indicated by keratinocyte density, showed a modest to moderately high positive correlation with all cytokines at 0.39 < ρ < 0.66 (Table 2). Furthermore, all cytokines, except IL-8, within the epidermis exhibited comparable expression profiles to one another throughout healing with ρ > 0.78 (supporting information Table S1). IL-8 profiles exhibited minimal negative correlations with all cytokines (–0.421 < ρ < –0.118) and with keratinocyte density (ρ=–0.270) (Table 2). Histological analysis showed a modest decrease in epidermal healing at 9 days. At day 9, decreased concentrations for all cytokines, except for IL-8, were observed within the epidermis for both treatment types. Whereas, IL-8 concentration and leukocyte density reached a maximum for Xeroform™-treated tissue at this time. These trends were most evident in Xeroform™-treated tissue, because keratinocyte density and most cytokine concentrations were higher at day 7 than at day 9. Observation of the animal behavior, tissue in situ, and histological assessment of inflammatory cells at the interface between fibrin clot and the wound surface indicated that further injury did not occur by postoperative day 9. At 21 days, wounded epidermal tissue showed a reduced cellularity in response to either treatment when compared with the unwounded tissue. Cytokines from Xeroform™-treated tissue showed heightened concentrations at these latest time points, however, in sIPN-treated tissue, this was observed only for IFN-γ and TNF-α. When comparing between Xeroform™ and sIPN treatments, sIPN-treated wounds showed slightly reduced cellularity, stratum spinosum maturity, and stratum corneum presence at postoperative days 7 and 9 (Figure 4).24 All cytokines, except IL-8, were measured at lower concentrations in the epidermis of sIPN-treated tissue than that of Xeroform™ at each time point. This indicated that a decreased cellular response, including inflammatory cells, to sIPN was associated with a lowered extent of cytokine expression.
Table 2.
Spearman's rank-order coefficients (ρ) are shown to correlate IL-1β, IL-2, IL-4, IL-6, IL-8, IL-10, IL-12p70, IFN-γ, and TNF-α concentrations with keratinocyte, leukocyte, and fibroblast densities
| Cellular features |
|||
|---|---|---|---|
| Proteins | Epidermal keratinocyte density | Remodeling dermal leukocyte density | Remodeling dermal fibroblast density |
| IL-1β | 0.399 | –0.270 | –0.127 |
| IL-2 | 0.588 | –0.051 | 0.030 |
| IL-4 | 0.624 | –0.082 | 0.044 |
| IL-6 | 0.562 | –0.231 | –0.166 |
| IL-8 | –0.270 | –0.019 | –0.028 |
| IL-10 | 0.609 | –0.107 | 0.036 |
| IL-12p70 | 0.645 | –0.185 | 0.016 |
| IFN-γ | 0.659 | –0.058 | –0.047 |
| TNF-α | 0.544 | –0.161 | 0.042 |
Epidermal protein concentrations were compared with keratinocyte densities, while remodeling dermal protein concentrations were compared with leukocyte and fibroblast densities. Keratinocyte data represent 23 analytes after imputation by omission of early epidermal data where epidermis was not available for microdissection. Leukocyte and fibroblast density data represent 33 analytes.
Comparing all cytokine and chemokine profiles indicated that the deeper cut depth wounds, 0.030 in., elicited significantly lower concentrations than the shallower 0.022 in. cut depth wounds for both treatment types at respective time points (Figures 5–10, S2–S13). Deeper wounds resulted in a reduced keratinocyte density, fibroblast density, and overall extent and rate of reepithelialization for both treatments (Figure 4 and S1). These observations were consistent with the reduced cellularity and cytokine expression observed at 0.022 in. cut depth, particularly those treated with sIPN treatment.
Remodeling dermis
“Remodeling dermal” tissue was defined as the region of tissue undergoing significant ECM remodeling where thin collagenous fibers with larger interstitial spaces than healthy underlying dermis were observed (Figure 3). This region was clearly visible and different from underlying dermis from 7 days through 21 days for both treatments. From the time course of each protein profile, we observed concentrations that were generally decreased from a heightened level at 7 days down toward or below levels there were observed in unwounded dermal tissue by postoperative day 21 (Figures 5–10, S2–S4). In most cases, higher protein concentrations were observed at 7 days and reduced concentrations were observed at 9 days. Conversely, maximum leukocyte cellularity was observed at 9 days rather than at 7 days indicating the manifestation of the effect of these factors in vivo (Figure 4). All cytokines, except IL-8, showed a generally comparable profile between Xeroform™ and sIPN treatments (Figures 5–10, S2–4). However, at 7 days, IL-8 concentrations were much higher in the remodeling dermis of sIPN-treated wounds than those in Xeroform™-treated wounds. In the epidermal tissue, IL-8 concentrations were higher at 7 and 9 days in Xeroform™-treated wounds rather than sIPN-treated wounds. By 14 days, cytokine concentrations in sIPN-treated wounds were markedly lower than those in Xeroform™-treated wounds, which led to statistically significant differences in IL-6, IL-12p70, IFN-γ, and TNF-α profiles. At 21 days, no remodeling dermal tissue cytokine or chemokine concentrations were significantly different from unwounded dermal tissue concentrations.
Similar to what was observed in the epidermal region, 0.030 in. cut depth wounds elicited significantly lower protein expression than that of 0.022 in. cut depth wounds in the remodeling dermal tissue (Figures 5–10, S2–S13). This reduction was observed for all proteins, except IL-6 and IL-8, despite a significantly increased leukocyte density at 7 and 9 days in 0.030 in. cut depth wounds. Thus, the extent of cellular activation in terms of protein expression and the amount of cells present in terms of density does not always correlate strongly. The influence of the wound and the biomaterials present should be assessed by measuring these data concurrently.
Underlying dermis
The “underlying dermis” is defined as the dermal tissue beneath the wound that displays intact ECM as indicated by nondegraded, relaxed, thick collagen fibers and a lack of infiltrating leukocyte and fibroblast populations. The underlying dermis was distinctly different from the remodeling dermis as well as subcutaneous fat, which was identified through minimal ECM surrounding large cells with small, barely visible organelles and nuclei. Protein concentrations in the underlying dermal tissue for both Xeroform™- and sIPN-treated wounds showed few differences from that of unwounded tissue at all time points for both wound depths. Extensive dermal remodeling was observed in the 0.030 in. cut depth wounds such that the thickness of the underlying dermis was reduced to within 50 μm of the subcutaneous fat stores. This was the minimum amount of healthy underlying dermis observed in any given tissue sample.
DISCUSSION
In this study, we sought to characterize the temporal variation in inflammatory protein expression as mediated by biomaterials in an acute cutaneous partial-thickness wound model. When coupled with in vitro mechanistic study results in the literature, a deeper understanding of how an inflammatory protein network modulates wound healing can be obtained. For example, IL-10 is a broad-spectrum anti-inflammatory cytokine for which we anticipated expression profiles that were strongly antagonistic to those of pro-inflammatory cytokines and chemokines such as IL-1β, IL-2, IL-4, IL-6, IL-8, IL-12p70, IFN-γ, and TNF-α as suggested in the literature.7,17 However, many pro-inflammatory stimuli induce IL-10 expression concurrently with pro-inflammatory cytokines in monocytes.18 It has also been shown that IL-10 may even inhibit its own production.18 Taken together with our results, IL-10 and pro-inflammatory cytokine expression profiles are not exclusive, but instead are expressed concurrently to modulate the balance between pro- and anti-inflammatory reactions during the course of wound healing in vivo. In addition, correlations between all cytokine profiles in all tissue regions, excluding IL-8, showed a comparable time course indicating highly interrelated activity of these inflammatory cytokines (Figures 5–10, Tables S1–S2). Certain aspects of these relationships have been reported in the literature. For example, pro-IL-1β is produced constitutively in keratinocytes and activated by the IL-1β-converting enzyme in response injurious stimuli or other activated epidermal cell types.32–34 Through autocrine and paracrine signaling, IL-1 not only directly stimulates keratinocyte proliferation but also up-regulates keratinocyte expression of other cytokines such as IL-6 and TNF-α.3,35 Dearman et al.36 found that TNF-α stimulation alone can acutely simulate IL-1β and IL-6 profiles comparable to those observed following allergen exposure or injury. Furthermore, co-stimulation of keratinocytes with IL-1 and/or IFN-γ enhances TNF-α-induced response.35 Because of the production of these cytokines, epidermal tissue begins and potentially sustains the release of pro-inflammatory signals to initiate the acute inflammatory cascade immediately following injury.1,3 It has also been shown that a few key cytokines such as IL-1β, IL-6, and TNF-α can mediate the expression of IL-2, IL-4, IL-8, IL-12p70, IFN-γ, and other cytokines and chemokines either directly or indirectly in various cutaneous cell types.3,5,11,19,35,37 Our current study expands upon these studies by asserting that the activity of cytokines is correlated with comparable profiles in other inflammatory and immune modulating proteins throughout the healing process in acute cutaneous wounds. These observations suggest that a single inflammatory protein biomarker may not be sufficient to differentiate the effect of a given treatment.
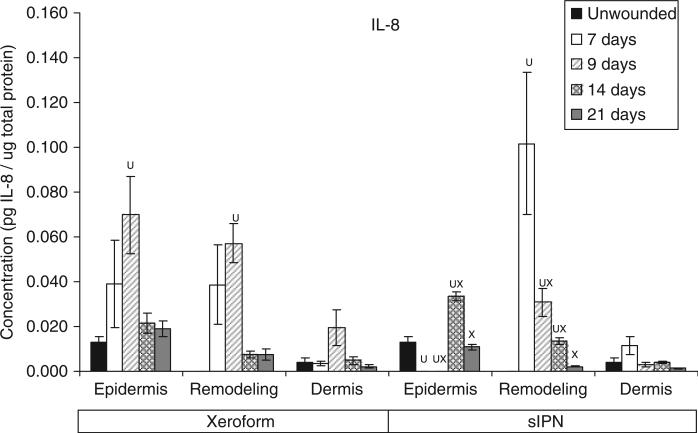
In general, IL-8 expression in the epidermal and the remodeling dermal regions opposed those of other cytokines analyzed. Upon stimulation, this 8 kDa chemokine is released from activated keratinocytes, neutrophils, macrophages/monocytes, fibroblasts, and endothelial cells to recruit more leukocytes and guide keratinocyte proliferation.11,38–40 Stimulation of IL-8 release is mediated by IL-1β, TNF-α, and other cytokines.11 In this study, higher dermal leukocyte and fibroblast densities correlated positively with higher IL-8 concentrations. At postoperative day 7, IL-8 concentrations in the remodeling dermal tissue were 2.7-fold higher in sIPN-treated wounds than in Xeroform™-treated wounds and 25.2-fold higher than unwounded dermal tissue. Also at day 7, no organized epidermal layer was observed in sIPN-treated wounds. Although some studies have shown that IL-8 induces keratinocyte migration and proliferation leading to enhanced wound healing, high concentrations of IL-8 may inhibit keratinocyte proliferation as has been observed in severe, nonhealing burns and other wounds.3,12–15 Taken together, these results indicate that IL-8 concentration is a good predictor of reepithelialization where there might exist a critical concentration window.
We further observed the effect of the biomaterial used on the temporal expression of these inflammatory proteins. Xeroform™-treated wounds, and to a lesser degree, sIPN-treated wounds, showed a significantly higher level of inflammatory and immune-related cytokines in the epidermal region as compared with unwounded epidermal tissue as late as 21 days. However, the average keratinocyte density in the epidermis of the wounded tissue reached a maximum density at 21 days that was only 64.5% of the unwounded tissue keratinocyte density for both sIPN and Xeroform™ treatments. For example, TNF-α concentration in Xeroform™-treated wounds at postoperative day 21 was 2.7-fold that observed in unwounded tissue. IL-8 concentration in Xeroform™-treated wounds at day 9 was 5.3-fold of that of unwounded tissue. These data coupled with poor correlation values between cell densities and cytokine concentrations (Table 2), indicate that cellularity and protein expression must be taken together to accurately reflect the state of epidermal healing and inflammation. Particularly, the biomaterials used may independently modulate these two data types.
To conclude, analyzing protein expression is an integral component in understanding the interactions between wound treatments and the time course and outcome of healing. In this study, we showed that histology when coupled with inflammatory protein analysis provided insights in bridging various in vitro mechanistic studies with in vivo healing response in a clinically relevant animal model. Many inflammatory proteins are correlated with certain aspects of cutaneous wound healing, and our results indicate a delicate balance of these proteins, such as IL-8, in vivo modulates the healing process assessed by the rate and the extent of reepithelialization. Furthermore, the biomaterial used has an added impact on influencing the expression of these proteins. With rational modifications to biomaterials, protein expression may be further modulated toward the production of comparator sIPN treatments, which improve healing rate and healing quality.
Supplementary Material
Supporting Information
Additional Supporting Information may be found in the online version of this article:
Figure S1. Cellular density within 0.030″ cut depth wounds dressed with Xeroform™ or sIPN. Viable keratinocyte density with the stratum spinosum (top), leukocyte density within the remodeling dermis (middle), and fibroblast density with the remodeling dermis (bottom) are displayed. Data is reported as average of 10 total viewing regions from biopsies of two separate pigs ± standard error. “X” represents significant difference from Xeroform™. “U” represents significant difference from unwounded tissue (P < 0.05).24
Figure S2. IL-2 concentration in epidermal, remodeling dermal, and dermal tissues wounded at 0.022″ cut depth and treated with Xeroform™ or sIPN. Data shown as mean ± standard error of n=2 pigs with three replicates of each n-value for each time point and treatment type. “X” represents significant difference from Xeroform™, and “U” represents significant difference from unwounded tissue at P < 0.05. Remodeling dermal tissue is statistically compared to unwounded dermal tissue for all treatment types and time points.
Figure S3. IL-4 concentration in epidermal, remodeling dermal, and dermal tissues wounded at 0.022″ cut depth and treated with Xeroform™ or sIPN. Data shown as mean ± standard error of n=2 pigs and three replicates of each n-value for each time point and treatment type. “X” represents significant difference from Xeroform™, and “U” represents significant difference from unwounded tissue at P < 0.05. Remodeling dermal tissue is statistically compared to unwounded dermal tissue for all treatment types and time points.
Figure S4. IL-12p70 concentration in epidermal, remodeling dermal, and dermal tissues wounded at 0.022″ cut depth and treated with Xeroform™ or sIPN. Data shown as mean ± standard error of n=2 pigs and three replicates of each n-value for each time point and treatment type. “X” represents significant difference from Xeroform™, and “U” represents significant difference from unwounded tissue at P < 0.05. Remodeling dermal tissue is statistically compared to unwounded dermal tissue for all treatment types and time points.
Figure S5. IL-1β concentration in epidermal, remodeling dermal, and dermal tissues wounded at 0.030″ cut depth and treated with Xeroform™ or sIPN. Data shown as mean ± standard error of n=2 pigs with three replicates of each n-value for each time point and treatment type. “X” represents significant difference from Xeroform™, and “U” represents significant difference from unwounded tissue at P < 0.05. Remodeling dermal tissue is statistically compared to unwounded dermal tissue for all treatment types and time points.
Figure S6. IL-2 concentration in epidermal, remodeling dermal, and dermal tissues wounded at 0.030″ cut depth and treated with Xeroform™ or sIPN. Data shown as mean ± standard error of n=2 pigs with three replicates of each n-value for each time point and treatment type. “X” represents significant difference from Xeroform™, and “U” represents significant difference from unwounded tissue at P < 0.05. Remodeling dermal tissue is statistically compared to unwounded dermal tissue for all treatment types and time points.
Figure S7. IL-4 concentration in epidermal, remodeling dermal, and dermal tissues wounded at 0.030″ cut depth and treated with Xeroform™ or sIPN. Data shown as mean ± standard error of n=2 pigs and three replicates of each n-value for each time point and treatment type. “X” represents significant difference from Xeroform™, and “U” represents significant difference from unwounded tissue at P < 0.05. Remodeling dermal tissue is statistically compared to unwounded dermal tissue for all treatment types and time points.
Figure S8. IL-6 concentration in epidermal, remodeling dermal, and dermal tissues wounded at 0.030″ cut depth and treated with Xeroform™ or sIPN. Data shown as mean ± standard error of n=2 pigs and three replicates of each n-value for each time point and treatment type. “X” represents significant difference from Xeroform™, and “U” represents significant difference from unwounded tissue at P < 0.05. Remodeling dermal tissue is statistically compared to unwounded dermal tissue for all treatment types and time points.
Figure S9. IL-8 concentration in epidermal, remodeling dermal, and dermal tissues wounded at 0.030″ cut depth and treated with Xeroform™ or sIPN. Data shown as mean ± standard error of n=2 pigs and three replicates of each n-value for each time point and treatment type. “X” represents significant difference from Xeroform™, and “U” represents significant difference from unwounded tissue at P < 0.05. Remodeling dermal tissue is statistically compared to unwounded dermal tissue for all treatment types and time points.
Figure S10. IL-10 concentration in epidermal, remodeling dermal, and dermal tissues wounded at 0.030″ cut depth and treated with Xeroform™ or sIPN. Data shown as mean ± standard error of n=2 pigs and three replicates of each n-value for each time point and treatment type. “X” represents significant difference from Xeroform™, and “U” represents significant difference from unwounded tissue at P < 0.05. Remodeling dermal tissue is statistically compared to unwounded dermal tissue for all treatment types and time points.
Figure S11. IL-12p70 concentration in epidermal, remodeling dermal, and dermal tissues wounded at 0.030″ cut depth and treated with Xeroform™ or sIPN. Data shown as mean ± standard error of n=2 pigs and three replicates of each n-value for each time point and treatment type. “X” represents significant difference from Xeroform™, and “U” represents significant difference from unwounded tissue at P < 0.05. Remodeling dermal tissue is statistically compared to unwounded dermal tissue for all treatment types and time points.
Figure S12. IFN-γ concentration in epidermal, remodeling dermal, and dermal tissues wounded at 0.030″ cut depth and treated with Xeroform™ or sIPN. Data shown as mean ± standard error of n=2 pigs and three replicates of each n-value for each time point and treatment type. “X” represents significant difference from Xeroform™, and “U” represents significant difference from unwounded tissue at P < 0.05. Remodeling dermal tissue is statistically compared to unwounded dermal tissue for all treatment types and time points.
Figure S13. TNF-α concentration in epidermal, remodeling dermal, and dermal tissues wounded at 0.030″ cut depth and treated with Xeroform™ or sIPN. Data shown as mean ± standard error of n=2 pigs and three replicates of each n-value for each time point and treatment type. “X” represents significant difference from Xeroform™, and “U” represents significant difference from unwounded tissue at P < 0.05. Remodeling dermal tissue is statistically compared to unwounded dermal tissue for all treatment types and time points.
Table S1. Spearman's rank order coefficients (ρ) are shown for the relationship between IL-1β, IL-2, IL-4, IL-6, IL-8, IL-10, IL-12p70, IFN-γ, and TNF-α concentrations from epidermal tissue. Epidermal protein concentrations were compared with those of all other proteins. Data represents 33 analytes after imputation by omission of early epidermal data where epidermis not visible for microdissection. Data represents 23 analytes after imputation by omission of early epidermal data where epidermis not visible for microdissection.
Table S2. Spearman's rank order coefficients (ρ) are shown for the relationship between IL-1β, IL-2, IL-4, IL-6, IL-8, IL-10, IL-12p70, IFN-γ, and TNF-α concentrations from remodeling dermal tissue. Remodeling dermis protein concentrations were compared with those of all other proteins. Data represents 33 analytes.
Please note: Wiley-Blackwell is not responsible for the content or functionality of any supporting materials supplied by the authors. Any queries (other than missing material) should be directed to the corresponding author for the article.
Figure 6.
Interleukin-6 (IL-6) concentration in epidermal, remodeling dermal, and dermal tissues wounded at 0.022 in. cut depth and treated with Xeroform™ or semi-interpenetrating network (sIPN). Data shown as mean ± standard error of n=2 pigs and three replicates of each n-value for each time point and treatment type. X represents significant difference from Xeroform™, and U represents significant difference from unwounded tissue at p < 0.05. Remodeling dermal tissue is statistically compared with the unwounded dermal tissue for all treatment types and time points.
Figure 7.
Interleukin-8 (IL-8) concentration in epidermal, remodeling dermal, and dermal tissues wounded at 0.022 in. cut depth and treated with Xeroform™ or semi-interpenetrating network (sIPN). Data shown as mean ± standard error of n=2 pigs and three replicates of each n-value for each time point and treatment type. X represents significant difference from Xeroform™, and U represents significant difference from unwounded tissue at p < 0.05. Remodeling dermal tissue is statistically compared with the unwounded dermal tissue for all treatment types and time points.
Figure 8.
Interleukin-10 (IL-10) concentration in epidermal, remodeling dermal, and dermal tissues wounded at 0.022 in. cut depth and treated with Xeroform™ or semi-interpenetrating network (sIPN). Data shown as mean ± standard error of n=2 pigs and three replicates of each n-value for each time point and treatment type. X represents significant difference from Xeroform™, and U represents significant difference from unwounded tissue at p < 0.05. Remodeling dermal tissue is statistically compared with the unwounded dermal tissue for all treatment types and time points.
Figure 9.
IFN-γ concentration in epidermal, remodeling dermal, and dermal tissues wounded at 0.022 in. cut depth and treated with Xeroform™ or semi-interpenetrating network (sIPN). Data shown as mean ± standard error of n=2 pigs and three replicates of each n-value for each time point and treatment type. X represents significant difference from Xeroform™, and U represents significant difference from unwounded tissue at p < 0.05. Remodeling dermal tissue is statistically compared with the unwounded dermal tissue for all treatment types and time points.
ACKNOWLEDGMENTS
The authors would like to graciously acknowledge Kim Maurer, Jonathan Holt, Laura Knoll, Thomas Pier, UW—Madison Translational Research Initiatives in Pathology Laboratory, Delinda Johnson, and Jeff Johnson for technical support. The authors would also like to acknowledge the Department of Surgery Research Grant, Surgical Science Foundation, MatriLab LLC, and National Institutes of Health R01EB6613 for financial support. We disclose herein that Dr. John Kao shares ownership of MatriLab LLC. This relationship has not impacted the presentation or interpretation of these data.
Glossary
- IFN-γ
Interferon-γ
- IL
Interleukin
- sIPN
Semi-interpenetrating network
- TNF-α
Tumor necrosis factor-α
REFERENCES
- 1.Barrientos S, Stojadinovic O, Golinko MS, Brem H, Tomic-Canic M. Growth factors and cytokines in wound healing. Wound Repair Regen. 2008;16:585–601. doi: 10.1111/j.1524-475X.2008.00410.x. [DOI] [PubMed] [Google Scholar]
- 2.Tomic-Canic M, Komine M, Freedberg IM, Blumenberg M. Epidermal signal transduction and transcription factor activation in activated keratinocytes. J Dermatol Sci. 1998;17:167–81. doi: 10.1016/s0923-1811(98)00016-4. [DOI] [PubMed] [Google Scholar]
- 3.Raja SK, Garcia MS, Isseroff RR. Wound re-epithelialization: modulating keratinocyte migration in wound healing. Front Biosci. 2007;12:2849–68. doi: 10.2741/2277. [DOI] [PubMed] [Google Scholar]
- 4.Murtaugh MP. Porcine cytokines. Vet Immunol Immunopathol. 1994;43:37–44. doi: 10.1016/0165-2427(94)90118-x. [DOI] [PubMed] [Google Scholar]
- 5.Romagnani S. Regulation of the development of type-3 T-helper cells in allergy. Curr Opin Immunol. 1994;6:838–46. doi: 10.1016/0952-7915(94)90002-7. [DOI] [PubMed] [Google Scholar]
- 6.Schroder K, Hertzog PJ, Ravasi T, Hume DA. Interferon-gamma: an overview of signals, mechanisms and functions. J Leukoc Biol. 2004;75:163–89. doi: 10.1189/jlb.0603252. [DOI] [PubMed] [Google Scholar]
- 7.Sigal LH. Basic science for the clinician 33: interleukins of current clinical relevance (part 1). J Clin Rheumatol. 2004;10:353–9. doi: 10.1097/01.rhu.0000147138.11053.e4. [DOI] [PubMed] [Google Scholar]
- 8.Schutte RJ, Xie L, Klitzman B, Reichert WM. In vivo cytokine-associated responses to biomaterials. Biomaterials. 2009;30:160–8. doi: 10.1016/j.biomaterials.2008.09.026. [DOI] [PMC free article] [PubMed] [Google Scholar]
- 9.Sugawara T, Gallucci RM, Simeonova PP, Luster MI. Regulation and role of interleukin 6 in wounded human epithelial keratinocytes. Cytokine. 2001;15:328–36. doi: 10.1006/cyto.2001.0946. [DOI] [PubMed] [Google Scholar]
- 10.Sorg H, Schulz T, Krueger C, Vollmar B. Consequences of surgical stress on the kinetics of skin wound healing: partial hepatectomy delays and functionally alters dermal repair. Wound Rep Regen. 2009;17:367–77. doi: 10.1111/j.1524-475X.2009.00490.x. [DOI] [PubMed] [Google Scholar]
- 11.Baggiolini M, Clark-Lewis I. Interleukin-8, a chemotactic and inflammatory cytokine. FEBS Lett. 1992;307:97–101. doi: 10.1016/0014-5793(92)80909-z. [DOI] [PubMed] [Google Scholar]
- 12.Michel G, Kemeny L, Peter RU, Beetz A, Ried C, Arenberger P, Ruzicka T. Interleukin-8 receptor-mediated chemotaxis of normal human epidermal cells. FEBS Lett. 1992;305:241–3. doi: 10.1016/0014-5793(92)80677-9. [DOI] [PubMed] [Google Scholar]
- 13.Tuschil A, Lam C, Haslberger A, Lindley I. Interleukin-8 stimulates calcium transients and promotes epidermal cell proliferation. J Invest Dermatol. 1992;99:294–8. doi: 10.1111/1523-1747.ep12616634. [DOI] [PubMed] [Google Scholar]
- 14.Rennekampff H, Hansbrough JF, Kiessig V, Dore C, Sticherling M, Schroder J. Bioactive interleukin-8 is expressed in wounds and enhances wound healing. J Surg Res. 2000;93:41–54. doi: 10.1006/jsre.2000.5892. [DOI] [PubMed] [Google Scholar]
- 15.Iocono JA, Colleran KR, Remick DG, Gillespie BW, Ehrlich HP, Garner WL. Interleukin-8 levels and activity in delayed-healing human thermal wounds. Wound Rep Regen. 2000;8:216–25. doi: 10.1046/j.1524-475x.2000.00216.x. [DOI] [PubMed] [Google Scholar]
- 16.Sato Y, Ohshima T, Kondo T. Regulatory role of endogenous interleukin-10 in cutaneous inflammatory response of murine wound healing. Biochem Biophys Res Commun. 1999;265:194–9. doi: 10.1006/bbrc.1999.1455. [DOI] [PubMed] [Google Scholar]
- 17.Moore KW, Malefyt RdW, Coffman RL, O'Garra A. Interleukin-10 and the interleukin-10 receptor. Annu Rev Immunol. 2001;19:683–765. doi: 10.1146/annurev.immunol.19.1.683. [DOI] [PubMed] [Google Scholar]
- 18.Malefyt RdW, Abrams J, Bennett B, Figdor CG, Vries JE. Interleukin 10 (IL-10) inhibits cytokine synthesis by human monocytes: an autoregulatory role of IL-10 produced by monocytes. J Exp Med. 1991;174:1209–20. doi: 10.1084/jem.174.5.1209. [DOI] [PMC free article] [PubMed] [Google Scholar]
- 19.Zhang S, Wang Q. Factors determining the formation and release of bioactive IL-12: regulatory mechanisms for IL-12p70 synthesis and inhibition. Biochem Biophys Res Commun. 2008;372:509–12. doi: 10.1016/j.bbrc.2008.05.081. [DOI] [PubMed] [Google Scholar]
- 20.Ishida Y, Kondo T, Takayasu T, Iwakura Y, Mukaida N. The essential involvement of cross-talk between IFN-gamma and TGF-beta in the skin wound-healing process. J Immunol. 2004;172:1848–55. doi: 10.4049/jimmunol.172.3.1848. [DOI] [PubMed] [Google Scholar]
- 21.Han YP, Tuan TL, Wu H, Hughes M, Garner WL. TNF-alpha stimulates activation of pro-MMP2 in human skin through NF-(kappa)B mediated induction of MT1-MMP. J Cell Sci. 2001;114:131–9. doi: 10.1242/jcs.114.1.131. [DOI] [PMC free article] [PubMed] [Google Scholar]
- 22.Waldeck H, Chung AS, Kao WJ. Interpenetrating polymer networks containing gelatin modified with PEGylated RGD and soluble KGF: synthesis, characterization, and application in in vivo critical dermal wound. J Biomed Mater Res A. 2007;82:861–71. doi: 10.1002/jbm.a.31054. [DOI] [PubMed] [Google Scholar]
- 23.Kleinbeck KR, Faucher L, Kao WJ. Multifunction in situ photopolymerized semi-interpenetrating network system (sIPN) is an effective donor site dressing: a cross comparison study in a swine model. J Burn Care Res. 2009;30:37–45. doi: 10.1097/BCR.0b013e3181921f98. [DOI] [PMC free article] [PubMed] [Google Scholar]
- 24.Faucher L, Kleinbeck KR, Kao WJ. Multifunctional photopolymerized semi-interpenetrating network (sIPN) system containing bupivacaine and silver sulfadiazine is an effective donor site treatment in a swine model. J Burn Care Res. 2009;30:37–45. doi: 10.1097/BCR.0b013e3181cb8f27. [DOI] [PMC free article] [PubMed] [Google Scholar]
- 25.Kleinbeck KR, Bader RA, Kao WJ. Concurrent in vitro release of silver sulfadiazine and bupivacaine from semi-interpenetrating networks for wound management. J Burn Care Res. 2009;30:98–104. doi: 10.1097/BCR.0b013e3181921ed9. [DOI] [PMC free article] [PubMed] [Google Scholar]
- 26.Mahadeva S, Wyatt JI, Howdle P. Is a raised intraepithelial lymphocyte count with normal duodenal villous architecture clinically relevant? J Clin Pathol. 2002;55:424–8. doi: 10.1136/jcp.55.6.424. [DOI] [PMC free article] [PubMed] [Google Scholar]
- 27.Carlson JA, Grabowski R, Mu XC, Del Rosario A, Malfetano J, Slominski A. Possible mechanisms of hypopigmentation in lichen sclerosus. Am J Dermatopathol. 2002;24:97–107. doi: 10.1097/00000372-200204000-00001. [DOI] [PubMed] [Google Scholar]
- 28.Verma MJ, Mukatda N, Vollmer-Conna U, Matsushima K, Lloyd A, Wakefield D. Endotoxin-induced uveitis is partially inhibited by anti-IL-8 antibody treatment. Invest Ophthamol Vis Sci. 1999;40:2465–70. [PubMed] [Google Scholar]
- 29.Singer AJ, Clark RAF. Cutaneous wound healing. N Engl J Med. 1999;341:738–46. doi: 10.1056/NEJM199909023411006. [DOI] [PubMed] [Google Scholar]
- 30.Young B, Heath JW, editors. Wheather's functional histology: a text and colour atlas. 4th ed. Churchill Livingstone; New York: 2000. [Google Scholar]
- 31.Wong H, Pfeiffer RM, Fears TR, Vermeulen R, Ji S, Rabkin CS. Reproducibility and correlations of multiplex cytokine levels in asymptomatic persons. Cancer Epidermiol Biomarkers Prev. 2008;17:3450–6. doi: 10.1158/1055-9965.EPI-08-0311. [DOI] [PubMed] [Google Scholar]
- 32.Mizutani H, Black R, Kupper TS. Human keratinocytes produce but do not process pro-interleukin-1 (IL-1) beta. J Clin Invest. 1991;87:1066–71. doi: 10.1172/JCI115067. [DOI] [PMC free article] [PubMed] [Google Scholar]
- 33.Zepter K, Haffner A, Soohoo LF, De Luca D, Tang H, Fisher P, Chavinson J, Elmets CA. Induction of biologically active IL-1beta-converting enzyme and mature IL-1beta in human keratinocytes by inflammatory and immunologic stimuli. J Immunol. 1997;159:6203–8. [PubMed] [Google Scholar]
- 34.Ariizumi K, Kitajima T, Bergstresser PR, Takashima A. Interleukin-1beta converting enzyme in murine langerhans cells and epidermal-derived dendritic cell lines. Eur J Immunol. 1995;25:2137–41. doi: 10.1002/eji.1830250803. [DOI] [PubMed] [Google Scholar]
- 35.Sanmiguel JC, Olaru F, Li J, Mohr E, Jensen LE. Interleukin-1 regulates keratinocyte expression of T cell targeting chemokines through interleukin-1 receptor associated kinase-1 (IRAK1) dependent and independent pathways. Cell Signal. 2009;21:685–94. doi: 10.1016/j.cellsig.2009.01.005. [DOI] [PMC free article] [PubMed] [Google Scholar]
- 36.Dearman RJ, Cumberbatch M, Kimber I. Cutaneous cytokine expression: induction by chemical allergen and paracrine regulation. J Toxicol-Cutan Ocul. 2003;22:69–86. [Google Scholar]
- 37.Dinarello CA. Biologic basis for interleukin-1 in disease. Blood. 1996;87:2095–147. [PubMed] [Google Scholar]
- 38.Harada A, Sekido N, Wada T, Mukaida N, Matsushima K. Essential involvement of interleukin-8 (IL-8) in acute inflammation. J Leukocyte Biol. 1994;56:559–64. [PubMed] [Google Scholar]
- 39.Bazzoni F, Cassatella MA, Rossi F, Ceska M, Dewald B, Baggiolini M. Phagocytosing neutrophils produce and release high amounts of the neutrophil-activating peptide 1/interleukin-8. J Exp Med. 1991;173:771–4. doi: 10.1084/jem.173.3.771. [DOI] [PMC free article] [PubMed] [Google Scholar]
- 40.Spiekstra SW, Breetveld M, Rustemeyer T, Scheper RJ, Gibbs S. Wound-healing factors secreted by epidermal keratinocytes and dermal fibroblasts in skin substitutes. Wound Rep Regen. 2007;15:708–17. doi: 10.1111/j.1524-475X.2007.00280.x. [DOI] [PubMed] [Google Scholar]
Associated Data
This section collects any data citations, data availability statements, or supplementary materials included in this article.
Supplementary Materials
Supporting Information
Additional Supporting Information may be found in the online version of this article:
Figure S1. Cellular density within 0.030″ cut depth wounds dressed with Xeroform™ or sIPN. Viable keratinocyte density with the stratum spinosum (top), leukocyte density within the remodeling dermis (middle), and fibroblast density with the remodeling dermis (bottom) are displayed. Data is reported as average of 10 total viewing regions from biopsies of two separate pigs ± standard error. “X” represents significant difference from Xeroform™. “U” represents significant difference from unwounded tissue (P < 0.05).24
Figure S2. IL-2 concentration in epidermal, remodeling dermal, and dermal tissues wounded at 0.022″ cut depth and treated with Xeroform™ or sIPN. Data shown as mean ± standard error of n=2 pigs with three replicates of each n-value for each time point and treatment type. “X” represents significant difference from Xeroform™, and “U” represents significant difference from unwounded tissue at P < 0.05. Remodeling dermal tissue is statistically compared to unwounded dermal tissue for all treatment types and time points.
Figure S3. IL-4 concentration in epidermal, remodeling dermal, and dermal tissues wounded at 0.022″ cut depth and treated with Xeroform™ or sIPN. Data shown as mean ± standard error of n=2 pigs and three replicates of each n-value for each time point and treatment type. “X” represents significant difference from Xeroform™, and “U” represents significant difference from unwounded tissue at P < 0.05. Remodeling dermal tissue is statistically compared to unwounded dermal tissue for all treatment types and time points.
Figure S4. IL-12p70 concentration in epidermal, remodeling dermal, and dermal tissues wounded at 0.022″ cut depth and treated with Xeroform™ or sIPN. Data shown as mean ± standard error of n=2 pigs and three replicates of each n-value for each time point and treatment type. “X” represents significant difference from Xeroform™, and “U” represents significant difference from unwounded tissue at P < 0.05. Remodeling dermal tissue is statistically compared to unwounded dermal tissue for all treatment types and time points.
Figure S5. IL-1β concentration in epidermal, remodeling dermal, and dermal tissues wounded at 0.030″ cut depth and treated with Xeroform™ or sIPN. Data shown as mean ± standard error of n=2 pigs with three replicates of each n-value for each time point and treatment type. “X” represents significant difference from Xeroform™, and “U” represents significant difference from unwounded tissue at P < 0.05. Remodeling dermal tissue is statistically compared to unwounded dermal tissue for all treatment types and time points.
Figure S6. IL-2 concentration in epidermal, remodeling dermal, and dermal tissues wounded at 0.030″ cut depth and treated with Xeroform™ or sIPN. Data shown as mean ± standard error of n=2 pigs with three replicates of each n-value for each time point and treatment type. “X” represents significant difference from Xeroform™, and “U” represents significant difference from unwounded tissue at P < 0.05. Remodeling dermal tissue is statistically compared to unwounded dermal tissue for all treatment types and time points.
Figure S7. IL-4 concentration in epidermal, remodeling dermal, and dermal tissues wounded at 0.030″ cut depth and treated with Xeroform™ or sIPN. Data shown as mean ± standard error of n=2 pigs and three replicates of each n-value for each time point and treatment type. “X” represents significant difference from Xeroform™, and “U” represents significant difference from unwounded tissue at P < 0.05. Remodeling dermal tissue is statistically compared to unwounded dermal tissue for all treatment types and time points.
Figure S8. IL-6 concentration in epidermal, remodeling dermal, and dermal tissues wounded at 0.030″ cut depth and treated with Xeroform™ or sIPN. Data shown as mean ± standard error of n=2 pigs and three replicates of each n-value for each time point and treatment type. “X” represents significant difference from Xeroform™, and “U” represents significant difference from unwounded tissue at P < 0.05. Remodeling dermal tissue is statistically compared to unwounded dermal tissue for all treatment types and time points.
Figure S9. IL-8 concentration in epidermal, remodeling dermal, and dermal tissues wounded at 0.030″ cut depth and treated with Xeroform™ or sIPN. Data shown as mean ± standard error of n=2 pigs and three replicates of each n-value for each time point and treatment type. “X” represents significant difference from Xeroform™, and “U” represents significant difference from unwounded tissue at P < 0.05. Remodeling dermal tissue is statistically compared to unwounded dermal tissue for all treatment types and time points.
Figure S10. IL-10 concentration in epidermal, remodeling dermal, and dermal tissues wounded at 0.030″ cut depth and treated with Xeroform™ or sIPN. Data shown as mean ± standard error of n=2 pigs and three replicates of each n-value for each time point and treatment type. “X” represents significant difference from Xeroform™, and “U” represents significant difference from unwounded tissue at P < 0.05. Remodeling dermal tissue is statistically compared to unwounded dermal tissue for all treatment types and time points.
Figure S11. IL-12p70 concentration in epidermal, remodeling dermal, and dermal tissues wounded at 0.030″ cut depth and treated with Xeroform™ or sIPN. Data shown as mean ± standard error of n=2 pigs and three replicates of each n-value for each time point and treatment type. “X” represents significant difference from Xeroform™, and “U” represents significant difference from unwounded tissue at P < 0.05. Remodeling dermal tissue is statistically compared to unwounded dermal tissue for all treatment types and time points.
Figure S12. IFN-γ concentration in epidermal, remodeling dermal, and dermal tissues wounded at 0.030″ cut depth and treated with Xeroform™ or sIPN. Data shown as mean ± standard error of n=2 pigs and three replicates of each n-value for each time point and treatment type. “X” represents significant difference from Xeroform™, and “U” represents significant difference from unwounded tissue at P < 0.05. Remodeling dermal tissue is statistically compared to unwounded dermal tissue for all treatment types and time points.
Figure S13. TNF-α concentration in epidermal, remodeling dermal, and dermal tissues wounded at 0.030″ cut depth and treated with Xeroform™ or sIPN. Data shown as mean ± standard error of n=2 pigs and three replicates of each n-value for each time point and treatment type. “X” represents significant difference from Xeroform™, and “U” represents significant difference from unwounded tissue at P < 0.05. Remodeling dermal tissue is statistically compared to unwounded dermal tissue for all treatment types and time points.
Table S1. Spearman's rank order coefficients (ρ) are shown for the relationship between IL-1β, IL-2, IL-4, IL-6, IL-8, IL-10, IL-12p70, IFN-γ, and TNF-α concentrations from epidermal tissue. Epidermal protein concentrations were compared with those of all other proteins. Data represents 33 analytes after imputation by omission of early epidermal data where epidermis not visible for microdissection. Data represents 23 analytes after imputation by omission of early epidermal data where epidermis not visible for microdissection.
Table S2. Spearman's rank order coefficients (ρ) are shown for the relationship between IL-1β, IL-2, IL-4, IL-6, IL-8, IL-10, IL-12p70, IFN-γ, and TNF-α concentrations from remodeling dermal tissue. Remodeling dermis protein concentrations were compared with those of all other proteins. Data represents 33 analytes.
Please note: Wiley-Blackwell is not responsible for the content or functionality of any supporting materials supplied by the authors. Any queries (other than missing material) should be directed to the corresponding author for the article.


