Abstract
Neuronal noncytokine-dependent p50/p65 nuclear factor-κB (the primary NF-κB complex in the brain) activation has been shown to exert neuroprotective actions. Thus neuronal activation of NF-κB could represent a viable neuroprotective target. We have developed a cell-based assay able to detect NF-κB expression enhancement, and through its use we have identified small molecules able to up-regulate NF-κB expression and hence trigger its activation in neurons. We have successfully screened approximately 300,000 compounds and identified 1,647 active compounds. Cluster analysis of the structures within the hit population yielded 14 enriched chemical scaffolds. One high-potency and chemically attractive representative of each of these 14 scaffolds and four singleton structures were selected for follow-up. The experiments described here highlighted that seven compounds caused noncanonical long-lasting NF-κB activation in primary astrocytes. Molecular NF-κB docking experiments indicate that compounds could be modulating NF-κB-induced NF-κB expression via enhancement of NF-κB binding to its own promoter. Prototype compounds increased p65 expression in neurons and caused its nuclear translocation without affecting the inhibitor of NF-κB (I-κB). One of the prototypical compounds caused a large reduction of glutamate-induced neuronal death. In conclusion, we have provided evidence that we can use small molecules to activate p65 NF-κB expression in neurons in a cytokine receptor-independent manner, which results in both long-lasting p65 NF-κB translocation/activation and decreased glutamate neurotoxicity.
Keywords: high-throughput screening, NF-κB, p65, neuroprotection, small molecules, translocation, astrocytes, neurons
Nuclear factor-κB (NF-κB) is a ubiquitously expressed, inducible transcription factor that regulates the expression of a wide variety of genes and is involved in cell survival, growth, stress responses, and immune and inflammatory responses. NF-κB represents a family of several transcription factors, (p50, p52, RelA/p65, RelB, and c-Rel) that usually associate in homo- or heterodimers (Gilmore, 2006). All NF-κB proteins share an approximately 300-residue, highly conserved DNA binding/dimerization domain called the “Rel homology domain.” This domain is responsible for DNA binding, dimerization, inhibitor binding, and nuclear targeting (Gilmore, 1990; Huxford et al., 1999). A C-terminal immunoglobulin-like domain of approximately 100 amino acids is responsible for the formation of dimers (Sengchanthalangsy et al., 1999; Hart et al., 2001; Hoffmann et al., 2006).
NF-κBs are cytoplasmic and bound to the inhibitor of NF-κB (I-κB). I-κB binding to NF-κB prevents NF-κB nuclear translocation and binding to DNA. Canonical NF-κB activation is achieved via stimulus-induced phosphorylation of I-κB, in turn causing I-κB proteasome-mediated degradation (Karin and Ben-Neriah, 2000). Once released, NF-κBs translocate to the nuclei, bind to DNA, and promote transcription of sensible gene products.
The most common form of NF-κB in the brain is a dimer of p50/p65 (RelA). Both neurotransmitters and trophic factors can cause activation of NF-κB in astrocytes and neurons. Among the many substances, it is noteworthy that NF-κB is activated by the stimulation of ionotropic glutamate receptors or neurotrophin receptors (C. Kaltschmidt et al., 1995; B. Kaltschmidt et al., 2005) and by depolarization (Guerrini et al., 1995).
In the brain, the NF-κB signaling system is active in both neurons and glial cells. Astrocytes and neurons produce tumor necrosis factor-α (TNF-α), as well as its receptors, indicating that this cytokine can exert an auto-crine effect in the central nervous system (CNS; Kaltschmidt et al., 2005). Astrocytes and neurons seem to express different TNF-α receptors. Glial cells express the TNF-α type 1 receptor, which is associated with nitric oxide signaling and many other effects. Neurons express the TNF-α type 2 receptor that seems to be associated with neuroprotective actions (Marchetti et al., 2004). TNF-α neuroprotective effects have been ascribed to NF-κB activation in neurons (Cheng et al., 1994), whereas its negative effects have been ascribed to activation of glial TNF receptors (Marchetti et al., 2004).
Although NF-κB signaling pathways have been extensively investigated in cancer and in immunological diseases, their role in CNS physiology, in CNS pathology, and in noninflammatory disorders of the brain are still unclear. In particular, analysis of the effect of NF-κB on neuronal physiology has been clouded by the activity of other signaling pathways activated by cytokine receptor activation. NF-κB activation clearly plays a critical role in the neuroprotective effect of low concentrations of soluble β-amyloid (Aβ) (Kaltschmidt et al., 1999). In fact, NF-κB c-Rel activation has been shown to attenuate Aβ-mediated apoptosis in mouse cortical neurons and human SK-N-SH cells (Pizzi et al., 2005). Activation of NF-κB also protects against the proapoptotic action of mutated presenilin-1 in in vitro familial Alzheimer’s disease (AD) models (Guo et al., 1998). Blocking of the endogenous NF-κB activity in cortical neurons by overexpression of the I-κBαM super repressor induced neuronal death. Conversely, induction of NF-κB activity in neurons led to increased levels of antiapoptotic proteins and was strongly neuroprotective (Bhakar et al., 2002). In addition to neuronal protection, NF-κB regulates neuronal responses that represent the cellular correlates of learning and memory. For instance, NF-κB activation has been associated with establishment of long-term potentiation in the hippocampus (Meberg et al., 1996). This effect appears to be directly mediated by NF-κB without requiring the presence of an active TNF-α receptor (Albensi and Mattson, 2000).
Here we report the development of a cell-based assay, which has allowed us to discover small molecules that up-regulate NF-κB expression and activity in a noncanonical, cytokine receptor-independent manner. Clustering analysis of the hits has allowed the selection of 18 prototype molecules that have induced NF-κB p65 up-regulation, activation, and neuroprotection in primary neurons, validating our approach to discovering novel neuroprotectants.
MATERIALS AND METHODS
Reagents
TNF-α was purchased from PeproTech (Rocky Hill, NJ), dimethyl sulfoxide (DMSO) and Hyamine 1622 from Sigma-Aldrich (St. Louis, MO), and blasticidin from Invitrogen (Carlsbad, CA).
Compound Libraries
The assay was used to screen four different libraries. Two compound libraries were purchased from Tripos Inc. (St. Louis, MO; 50,000 compounds) and Chembridge Corporation (49,173 compounds; collectively indicated as the NINDS Antineurodegenerative High Throughput Screening program library) in 5 mg/ml DMSO stocks. A smaller, ~12,000-compound library with stocks at 10 mM was assembled from Southern Research Institute’s compound repository. The largest library, ~190,000 compounds, was obtained through competitive access granted to M.G. from the NIH Molecular Libraries Small Molecule Repository (MLSMR) as 10 mM stocks (Pubchem references for this library screen are the following: AID 1239 http://pub-chem.ncbi.nlm.nih.gov/assay/assay.cgi?aid=1239&loc=ea_ras and AID 1241 http://pubchem.ncbi.nlm.nih.gov/assay/assay.cgi?aid=1241&loc=ea_ras). All compounds were solubilized in 100% DMSO and diluted in assay media immediately before addition to the assay plates. DMSO was maintained at a final concentration of 0.1% for the single concentration screens. The screening concentration for each library were as follows: Tripos and Chembridge library 5 µg/ml, proprietary library 10 µM, and NIH MLSMR library 12.5 µM.
Preparation of Primary Cultures of Rat Cortical Astrocytes and Neurons
Astrocyte and neuron cultures were obtained in house from E-17 rats, according to a previously published protocol (Grimaldi et al., 1994). Briefly, fetuses were obtained by C-section from a 17-day pregnant Wistar rats and quickly decapitated. Cerebral cortices were dissected, minced, and enzymatically digested with papain. Subcultures of astrocytes were obtained by trypsin/EDTA exposure. This yielded cultures consisting of >95% astrocytes as characterized by glial fibrillary acidic protein immunoreactivity (Grimaldi et al., 1999). Neurons were counted and plated on high-molecular-weight poly-L-lysine-coated (100 µg/ml) 96-well plates, eight-well chamber slides, or 60-mm dishes. Neuron cultures were maintained in original culture media with biweekly partial fresh media replacement, in the presence of mitotic inhibitors to prevent astrocyte growth. The reported ratio for these cultures is ~1 astrocyte to 20–40 neurons (Favit et al., 1998).
Cell Lines
SH-SY5Y human neuroblastoma cells were grown in high-glucose DMEM (Invitrogen) supplemented with 10% certified heat-inactivated fetal bovine serum (FBS; Invitrogen) and with penicillin and streptomycin (Invitrogen). High-throughput screening was performed in the same medium lacking phenol red containing HEPES and devoid of bicarbonate, supplemented with 1% sodium pyruvate (Invitrogen). All cell lines were obtained from the American Tissue Culture Collection (ATCC, Manassas, VA) unless otherwise noted. HeLa cells were cultured in DMEM with 1% FBS; HepG2 cells were grown in Opti-MEM (Invitrogen) with 2.5% FBS. HUVEC (Lonza, Allendale, NJ) were grown in EGM (Lonza).
Recombinant DNA
To study NF-κB expression in SH-SY5Y, we utilized the vector pNF-κB-luc, a component of the PathDetect cis-reporting system (Stratagene, Cedar Creek, TX). This vector contains the firefly luciferase gene driven by a basic promoter element including five copies of the NF-κB-binding enhancer element. Because the plasmid pNF-κB-luc does not contain a selectable marker that can be used for transfection, we cotransfected the vector pEF6/Myc-HisA (Invitrogen), which encodes resistance to the antibiotic blasticidin, and the pNF-κB-luc reporter plasmid.
Transfection and Clonal Selection
Lipofectamine 2000 was purchased from Invitrogen and used to achieve genetic material transfer according to manufacturer instructions. For stable transfection of SH-SY5Y cells with pNF-κB-luc reporter plasmid, cells were allowed to reach 70% confluence in 100-mm dishes in 10% FBS DMEM. Transfection was performed according to the plasmid manufacturer’s protocol in serum-free DMEM. The pNF-κB-luc DNA and pEF6 DNA were used in the ratio of 4:1. Transfected cells were detached, plated in 100-mm dishes at 50,000 and 100,000 cells per dish, and allowed to attach for 24 hr. Media were then replaced with 10% FBS DMEM containing 3 µg/ml of blasticidin for selection purposes and were changed every 4 days. Polyclonal populations of cells, as well as the individual clones transfected with both pNF-κB-luc and pEF6 plasmids, were tested for expression of luciferase (Luc) following exposure to TNF-α. Clones were selected, grown in the presence of 3 µg/ml of blasticidin, and tested for increased levels of Luc expression upon TNF-α treatment.
Luc Assay
SH-SY5Y cells stably transfected with pNF-κB-luc/pEF6 were plated at 10,000 per well in a volume of 50 µl DMEM in Costar white-walled, white-bottom-half-area, 96-well plates (Corning, Inc., Corning, NY) and treated with various substances for 24 hr at 37°C. Luc activity was measured using the Bright-Glo Luciferase assay system (Promega, Madison, WI) according to the manufacturer’s instructions. Briefly, cells were equilibrated at room temperature for 5 min prior to the addition of Bright-Glo. A volume of assay buffer equal to the volume of cell media was added to each well and incubated for 5 min to allow complete cell lysis. All procedures were performed in the dark. Luc activity was measured by an EnVision luminometer microplate reader (PerkinElmer, Waltham, MA) within 15 min of lysis. All experiments were performed at least three times.
Compound Handling and HTS Assay Conditions
Compounds were added undiluted in 5 nl of 100% DMSO to dry 1,536-well assay plates using an Echo 550 liquid handler (Labcyte, Sunnyvale, CA). Assay plates were sealed and stored at room temperature until addition of the cells and control drug. The TNF-α was diluted in complete medium supplemented with sodium pyruvate to a working concentration of 20 ng/ml. Drugging was performed with Biomek FX equipment (Beckman Coulter, Indianapolis, IN). Cells were dispensed in assay plates using a MultiDrop Combi (Thermo-Fisher, Hudson NH) at 1,250 cells per well in 3 µl resulting in final test concentrations of 5 ng/ml and 0.1% for the TNF-α and carrier control, respectively.
HTS Data Analysis
Data were analyzed by using the IDBS Activity Base software. Results of the single concentration screen for NF-κB activation were expressed as fold of induction (FOI) over the median cell control for that plate. The concentration response data were analyzed using a four-parameter Levenberg-Marquardt algorithm (Excel Fit equation 205) with parameter A (minimum) locked at 0.
Statistical Analysis
Data were analyzed by using ANOVA, followed by the post hoc t-test. A P ≤ 0.05 indicated statistically significant differences. All data were presented as mean ± SD from at least three independent experiments performed on at least three different cell preparations.
Structural Clustering of Hit Scaffolds
The clustering tools of LeadScope (LeadScope, Inc.) and Distill in Sybyl software (Tripos, Inc.) were used. A hierarchical clustering method implemented in LeadScope was applied to cluster structural features of the active set. Clusters were separated using the Complete Linkage (furthest neighbor) method with cluster threshold distance of 0.7. The same hit sets were clustered by using Distill clustering implemented in Sybyl, and common substructures were selected based on the obtained dendrogram, in which nodes of the dendrogram correspond to common core structures.
Immunocytochemistry of p65 in Astrocytes
Primary rat cortical astrocytes were plated at a density of 50,000 cells per coverslip and allowed to attach overnight. The compounds were solubilized in DMSO and diluted in 10% FBS DMEM to the corresponding (EC)100 concentration, reaching a final DMSO concentration of 0.1%. Cells were treated with 0.1% DMSO, 20 ng/ml TNF-α, or compounds for 15 min and 24 hr. Cells were fixed in 3.7% formaldehyde in PBS for 20 min. A wash with 0.1 M glycine in PBS for 10 min was subsequently performed to neutralize formaldehyde. Cells were then permeabilized with 0.3% Triton X-100 (Sigma Aldrich, St. Louis, MO) for 15 min. Two 5-min washes with 0.2% gelatin in PBS were performed to block samples. Preparations were incubated with primary antibody (NF-κB p65 antibody, 1:25; Cell Signaling, Danvers, MA; catalog No. 4764S) for 1 hr at 37°C. After incubation, preparations were washed with 0.2% gelatin in PBS prior to incubation with the appropriate fluorophore-conjugated secondary antibody (goat anti-rabbit IgG; H + L, 1:50; Invitrogen; catalog No. F2765) for 1 hr at room temperature, protected from light. Coverslips were mounted using DAPI-Vectashield (Vector Laboratories, Burlingame, CA) and allowed to set overnight at 4°C. Imaging experiments were analyzed as follows: images were acquired at 40× magnification with an Olympus inverted microscope, connected to a high-resolution camera and operated via MetaMorph software (Molecular Devices, Sunnyvale, CA). Images were analyzed with a colocalization algorithm provided in MetaMorph. p65 immunofluorescence deriving from the images at the nuclear level, as identified by DAPI staining, was evaluated as positive DAPI overlapping pixels. Number of overlapping pixels in p65 (green) images and DAPI (blue) images from each cellular nuclear area obtained from multiple images were determined and logged into an Excel spreadsheet. Averages and standard deviations were calculated and used to draw the bar graphs presented. Each experiment was repeated at least three times on three different astrocytic preparations.
Immunocytochemistry of p65 in Neurons
At 6 days in vitro, neurons plated in an eight-well, poly-lysine-coated chamber slide were treated with compounds at the predetermined maximally effective concentration and with 20 ng/ml TNF-α for 24 hr. At 24 hr, the medium was removed, and neurons were washed with warm PBS and fixed in warm, fresh 3.7% formaldehyde for 15 min. Formaldehyde was removed, and neurons were washed in PBS and treated with 0.1 M glycine in PBS for 10 min. Neurons were then permeabilized for 15 min with 0.3% Triton-X in PBS (PBST) and blocked in 1% BSA/PBST for 1 hr. The chamber wall was removed, and the slide was exposed to p65 antibody at a dilution of 1:50 and GFAP (Sigma Aldrich, St. Louis, MO) at a dilution of 1:1,000 overnight at 4°C in a humidified chamber with gentle mixing. The primary antibodies were removed, and neurons were washed with PBS. Secondary antibodies, anti-rabbit Alexa-fluor 488 and anti-mouse Alexa-fluor 533 (Molecular Probes, Carlsbad, CA), were diluted 1:500 and incubated for 1 hr at room temperature. Slides were mounted with Vectashield mounting media (Vector Laboratories) containing DAPI and allowed to set for 24 hr prior to imaging with a 40× oil immersion lens. Imaging experiments were analyzed as described in the preceding section.
Glutamate Excitotoxicity
Neurons plated in a 96-well plate were treated at 13 days in vitro with the maximally effective concentration of the compounds for 24 hr. After 24 hr treatment, 60% of the treated neuron medium was removed and saved for later use. The remaining medium was aspirated, and the neurons were treated with either Mg2+-free saline (125 mM NaCl, 25 mM glucose, 10 mM HEPES, pH 7.4, 5 mM KCl, 1.8 mM CaCl, 1% BSA) or Mg2+-free saline containing 200 µM glutamate/10 µM glycine for 1 hr at 37°C. After 1 hr of treatment with glutamate, neurons were washed with Mg2+-free saline (MFS), the original neuron medium containing the compounds was replaced and neurons were incubated at 37°C for 24 hr. Lactate dehydrogenase (LDH) assay (Abcam, Cambridge, MA) was performed 24 hr following glutamate treatment according to the manufacturer’s instructions. Data were plotted setting MFS-treated cell values equal to 0% and glutamate-treated cell values equal to 100% cell death. For each data point, treatment was run in six independent wells and repeated at least three times on at least three different neuronal preparations. Statistical analysis was performed using ANOVA followed by the post hoc t-test.
Preparation of Cellular Extracts and Immunoblotting
Cytosolic and nuclear extract fractions were separated using a commercially available kit (NE-PER cat. no. 78833; Pierce, Rockford, IL), following the manufacturer’s instructions. Protein concentrations were determined using BCA protein assay reagent (Pierce), and samples were stored at −80°C until processing.
Proteins (12.5–25 µg) were separated by 8–16% gradient or 10% SDS-PAGE (Bio-Rad, Hercules, CA) and transferred onto nitrocellulose membranes (Fisher Scientific, Pittsburgh, PA). Blocking was performed with 5% nonfat dry milk (Bio-Rad) in TBS-T (20 mM Tris-HCl, pH 7.5, 137 mM NaCl, and 0.01% Tween-20) for 1 hr at room temperature. Membranes were incubated with primary antibodies, NF-κB (1:500; catalog No. sc-372; Santa Cruz) and I-κBα (1:1,000; catalog No. 4814; Cell Signaling), overnight at 4°C. After gently washing with TBS-T, each membrane was incubated with horseradish peroxidase-conjugated anti-rabbit (catalog No. PI-31462; Fisher Scientific) or anti-mouse (catalog No. PI-31430; Fisher Scientific) secondary antibodies (1:2,000–10,000) for 1 hr at room temperature in TBS-T containing 5% nonfat dry milk. Detection was performed using an enhanced chemiluminescence reagent (Fisher Scientific) according to the manufacturer’s instructions. Densitometric analysis was performed in ImageJ software (NIH). Experiments were repeated at least three times on three different cell preparations, and averages ± SD were used to graph the data. Statistical analysis was performed using ANOVA followed by the post hoc t-test.
Computational Ligand Docking Studies
The 18 active compounds were docked into ligand binding pockets of p50 and p65 crystal structures applying the docking program LigandFit implemented in Discovery Studio (DS; Accelrys, Inc., San Diego, CA) and ranked based on built-in ligand scoring functions in LigandScore. Default parameters were used, with the option of assigning penalties for ligand atom groups outside of the ligand binding pocket.
RESULTS
Establishment of SH-SY5Y Stably Expressing pNF-κB-luc
We sought to develop a reporter system in a human neuroblastoma cell line. The pNF-κB vector has successfully been employed by others to study various signaling pathways and their effect on NF-κB expression in transfected cells (Holloway et al., 2004; Liu et al., 2004). Because this proprietary plasmid lacked a selectable marker, a dual vector strategy transfection approach was used. The primary reporter plasmid (pNF-κB-luc), containing five copies of the NF-κB enhancer element and a TATA box linked to the firefly luciferase gene, was transfected jointly with the secondary vector pEF6/Myc-HisA, conferring resistance to the antibiotic blasticidin. Such an approach is based on chromosomal integration of intermolecular concatemers of the plasmids and has been fully validated and reported by others (Huberman et al., 1984; Antczak and Kung, 1990; Leahy et al., 1997). In particular, both NF-κB-luciferase and pEF6 vectors were not specifically engineered as episomally maintained self-replicating systems. Therefore, the expression of genes upon stable transfection during multiple generations would be possible only after their chromosomal integration (Huberman et al., 1984). Clonal and polyclonal populations of the cells resistant to blasticidin were isolated, expanded, and analyzed for significant TNF-α-induced Luc expression. We identified several clones that showed high levels of TNF-α-induced Luc expression compared with the wild-type cells and with the transfected cells not treated with TNF-α (data not shown).
A decrease in the recombinant gene expression over time resulting from epigenetic modifications, such as DNA methylation and histone modifications, has been documented and represents a concern in long-lasting screening campaigns (Lu et al., 2006). The selected clone C1, in addition to high levels of inducible Luc activity, demonstrated very little gene silencing during the observation period of 40 passages (data not shown). Therefore, this clone was the ideal candidate for assay development.
Assay Development
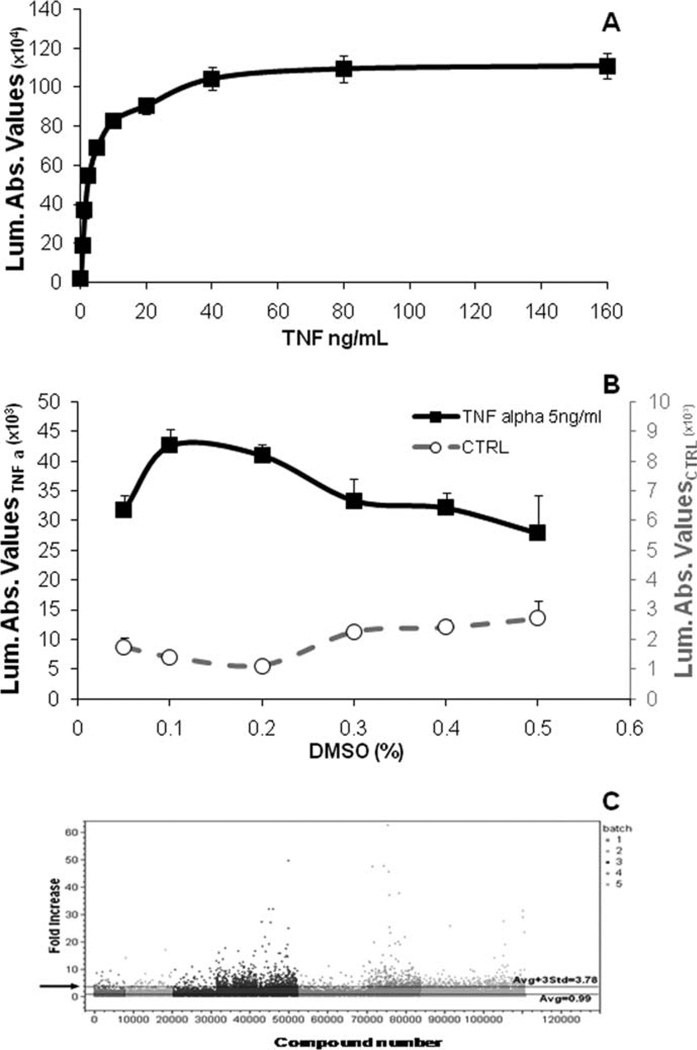
Several culture parameters and assay performance were optimized and determined prior to advancing the assay to the automation phase of development (data not shown). After establishment of the clone, we evaluated the profile of the TNF-α effect with the aim of establishing a concentration of the positive control that was cost-effective and provided a satisfactory dynamic range for the assay. The experiments reported in Figure 1A demonstrate the concentration-dependent effect of TNF-α in SH-SY5Y-C1 cells. We determined that 5 ng/ml of TNF-α generated about half of the maximal effect and a large Luc increase and was also quite cost-effective (Fig. 1A).
Fig. 1.
Biological behavior of stable cell line p65-NF-κB-luc. A: Concentration-dependent effect of TNF-α on Luc expression. SH-SY5Y-C1 cells were plated in 96-well plates at 20,000 cells per well and allowed to settle for 24 hr. Cells were then exposed to graded concentrations of TNF-α for 24 hr. Luc activity was measured using the Bright-Glo Luciferase assay system. B: Effect of DMSO on SH-SY5Y-C1 viability. Cells were treated with graded concentrations of DMSO in the presence (black line, left axis) and absence (gray line, right axis) of TNF-α 5 ng/ml for 24 hr. Cell viability was determined using the Cell Titer Glo assay system. C: High-throughput screening. The figure shows an example of a large library screening (112,000 compounds). The screening was completed in five independent blocks, with each block representing individual experimental days and gray coded. The data were analyzed and plotted in one graph. It was calculated that values higher than 3.78-fold the baseline value (black arrow) were statistically significant and therefore considered as hits.
Because the libraries to be used were solubilized in DMSO, we also tested the effect of increasing concentrations of DMSO, ranging from 0.05% through 0.5%, on SH-SY5Y-C1 viability in the absence and in the presence of TNF-α at 5 ng/ml. The results indicate that DMSO as high as 0.5% did not significantly affect TNF-α-treated or untreated SH-SY5Y-C1 viability as measured by Cell Titer-Glo assay system (Fig. 1B). DMSO in the same range of concentrations also did not affect Luc generation either basally or following TNF-α exposure as measured by the Bright Glo Luciferase assay system (data not shown). Therefore, we concluded that this cell line could be used to screen DMSO-containing small molecule libraries.
Z′ value is an important statistical parameter, indicating the likelihood that a single point elevation represents a statistically relevant finding. Z′ factors are usually numbers ranging from −8 to +1. Assays with a Z′ number higher than 0.5 are usually associated with very robust assays with highly reproducible results (Zhang et al., 1999). Our Z′ number plates were set up with positive control TNF-α at 5 ng/ml and the vehicle control signal from cells exposed to DMSO in two sets of inverted quadrants in a 96-, 384-, or 1,536-well plates. In addition to the quadrant array plates, we also used scattered locations of the positive and vehicle controls in a 96-well plate to calculate Z′ numbers. Z′ values for our assay were consistently above 0.74. Therefore, the assay was deemed to be reliable and robust.
Screening Results
The large library screenings were conducted in several blocks. Figure 1C provides an example of one of the large library screenings that involved 112,000 compounds, which were screened in five blocks. The average Z′ value for the screen was 0.77 ± 0.05. Based on the statistical evaluation, a cutoff point was identified to define hits. This cutoff was set as the average of control values plus three times the standard deviation. With these criteria, compounds causing an induction of Luc 3.78-fold higher than the baseline value were considered hits. In total, 2,138 compounds were above this threshold and were selected for concentration-response profiling. Among 2,138 compounds, 1,647 (77%) compounds were confirmed as active when profiled using HTS. These compounds showed a wide range of potencies and efficacies as identified in the validation runs. Three percent of the hit compounds demonstrated 20-fold or higher Luc induction (up to 65-fold); 48% of the hit compounds had a maximal effect between 10- and 20-fold induction. The remaining 49% demonstrated Luc induction between 5- and EC50 10-fold. The half-maximal effective concentration (EC50) ranged between 0.1 and 30 µM, and 22% of the hit compounds had EC50 values lower than 1 µM.
Our selected hits underwent a standard cytotoxic analysis using a high-throughput standard 72-hr cytotoxicity assay on five cell lines as published in Pub-Chem. The majority of the compounds demonstrated little or no toxicity at concentrations ranging from 0.06 to 30 µM (the range of the effective concentrations in the assay) in SH-SY5Y (parental human neuroblastoma cell line), HeLa (human cervix adenocarcinoma cell line) HUVEC (human umbilical vein endothelial cell line), A549 (human lung adenocarcinoma cell line), or HepG2 (human hepatocarcinoma cell line). Compounds showing toxicity in these cells were excluded from further analysis.
The MLSCN library hits were queried to determine whether the compounds were active in other target assays screened by the MLSCN program (hundreds of assays). A few of the compounds that were identified as hits in several other assays were excluded from further analysis. However, most of the compounds were specific hits for our assay.
Clustering Analysis
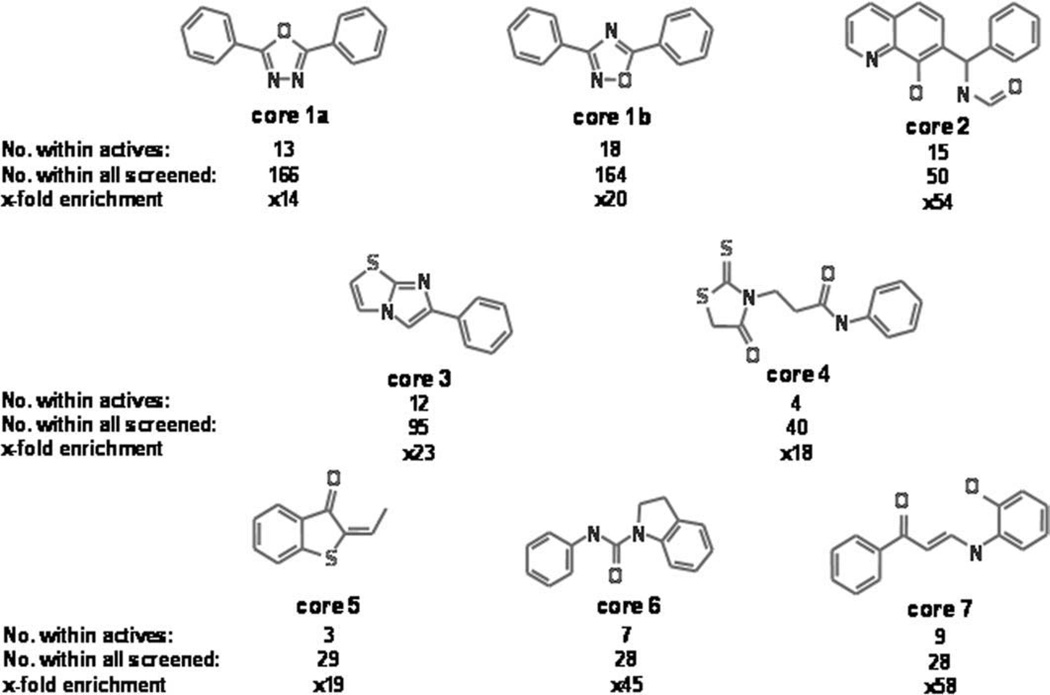
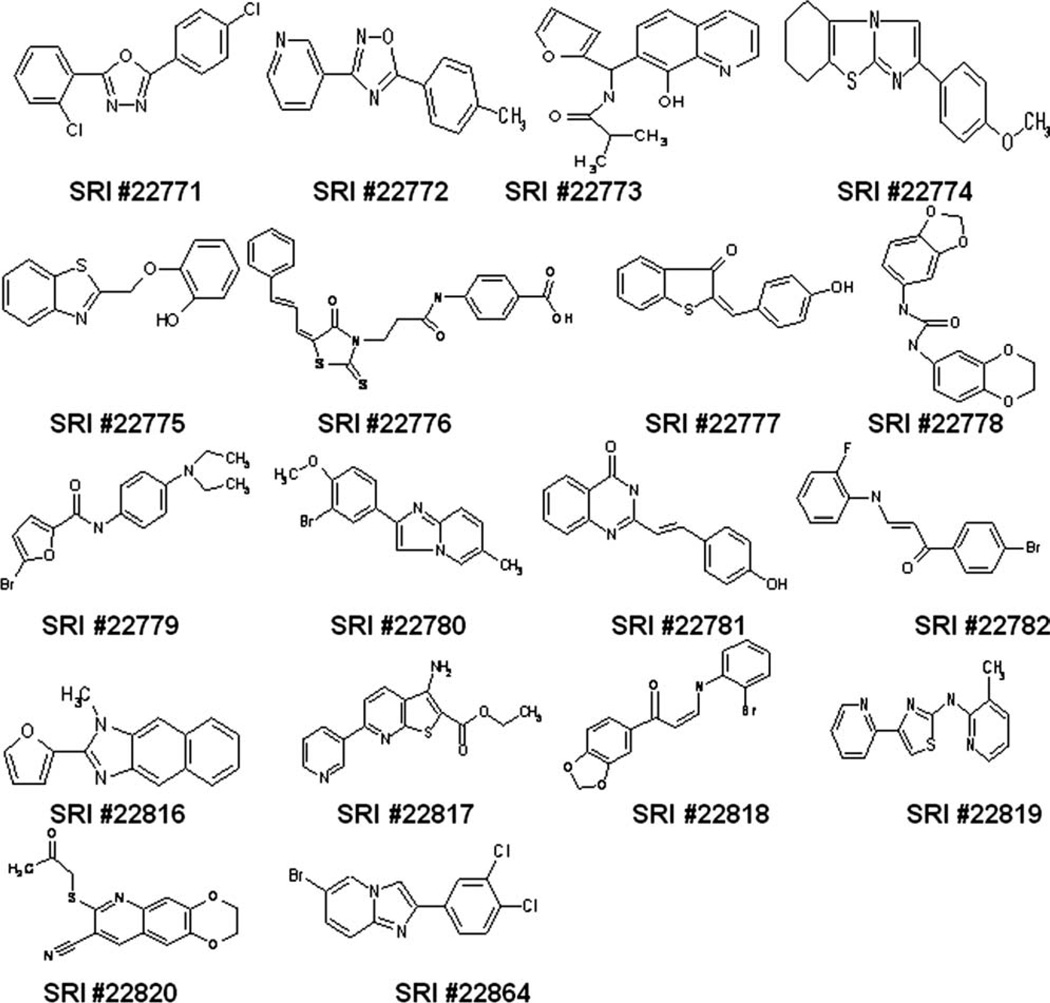
The active compounds were analyzed to identify common chemical structural elements using cluster analysis methods implemented in LeadScope (LeadScope, Inc., Columbus, OH) and in the Distill module of Sybyl (Tripos, Inc.). Common substructures obtained from clustering were prioritized using an enrichment analysis that compares the presence of core structures in the active set with their distribution in the entire library screened. Core structures enriched among actives, with respect to the entire library screened, are potentially privileged and truly contribute to activity. We selected core structures with more than 10-fold enrichment among actives compared with screened compounds. For example, in Figure 2, core structure 3 is present in 12 of 1647 active compounds (~0.729%) and in 95 of 299,229 screened compounds (~0.032%). The ratio of these percentages, for example, 23-fold for this scaffold, is shown as fold enrichment. Although 14 clustering classes emerged from the analysis, we show seven core structures as a representation of the classes. Because some of the highly active scaffolds were not well represented in the clustering selection, four additional privileged scaffolds were added as part of the singleton structures. In total, 18 high-potency structures, shown in Figure 3, were selected to pursue in secondary assays.
Fig. 2.
Clustering analysis of the hit population. Clustering analysis performed as described under Material and Methods revealed several enriched common core structures. These substructures were prioritized using an enrichment analysis that compares the presence of core structures in the active set with their distribution in the entire library screened. Core structures with an enrichment value higher than 14 are shown. The number of active compounds with a similar structure as well as the total number of similar compounds present in the screened library regardless of their activity is reported.
Fig. 3.
Hit compounds selected for follow-up analysis. The 14 compound structures selected based on clustering analysis, activity, and chemical tractability, plus four additional high-power singletons are shown. They constitute the pool of compounds selected for follow-up.
Most of the 18 compounds are heterocyclic in nature and have a monocyclic or bicyclic framework and can be considered as potentially good lead compounds, although a few contain some less desirable functional groups: α,β-unsaturated carbonyl (SRI 22776, 22777, 22818, 22782), heteroarylvinyl (SRI 22781), thione (SRI 22776), and ketone (SRI 22820) groups. Most of the core structures, such as thiazole (SRI 22819), 1,2,4-oxadiazole (SRI 22772), 1,3,4-oxadiazole (SRI 22771), benzothiazole (SRI 22775), benzimidazole (SRI 22816), imidazo(1,2-b)thiazole (SRI 22774), imidazo(1,2-a)pyridine (SRI 22780, 22864), thienopyridine (SRI 22817), and quinoline (SRI 22773), can be considered as interesting templates in lead structures.
Auld and collaborators (Auld et al., 2008) reported that luciferase inhibitors containing chemical groups common to some of our compounds could have exerted paradoxical stimulatory activity on luciferase cell-based assays, by stabilizing Luc itself and therefore modestly increasing Luc activity. Our compounds’ stimulation of Luc activity was very high, suggesting that such a mechanism of activation, even if at play, would be responsible for a negligible part of the effect of our compounds. Nonetheless, to dissipate any possible concerns about this issue, we tested three prototype compounds in another Luc assay. The two assays were similar in Luc, the dual transfection approach, the baseline levels of Luc, and the time of incubation of the assay. All the other parameters, including the cell type and the promoter driving luciferase, were different and unrelated to the assay reported here. SRI 22772, a reported inhibitor of luciferase activity; SRI 22817, a luciferase untested compound; and SRI 22773, a nonluciferase inhibitor were tested in this second luciferase assay. None of the compounds significantly affected LUC in this second assay (data not shown).
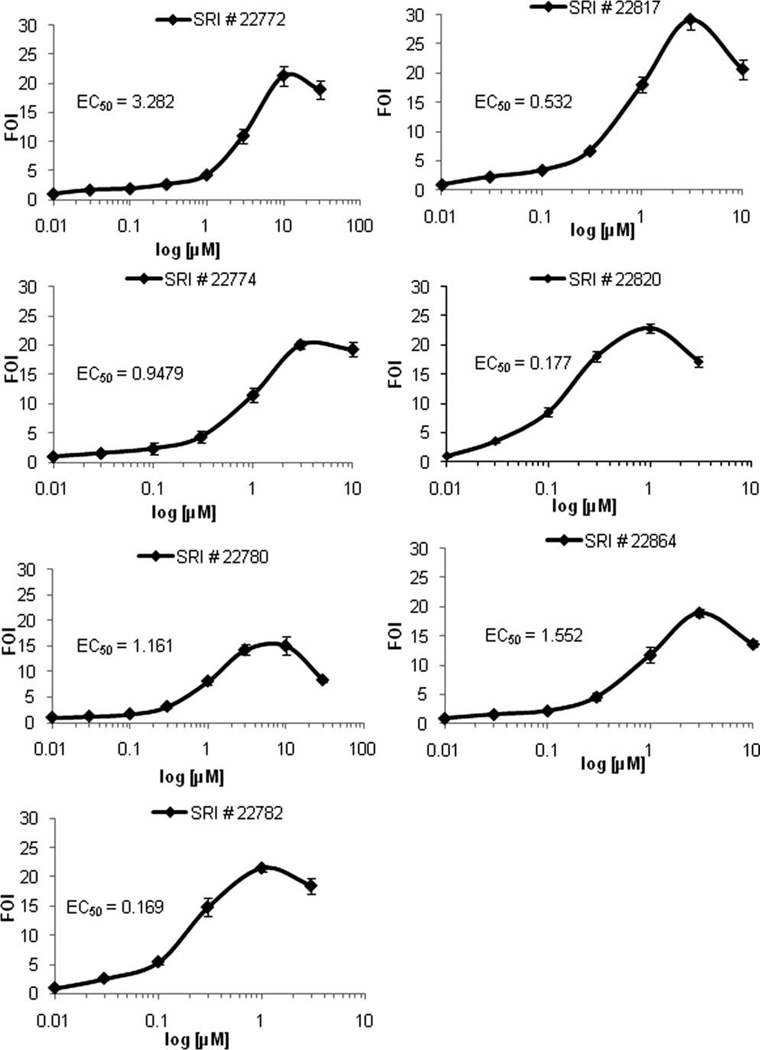
The 18 compounds were purchased from commercial sources and used for further validation. We confirmed that all the acquired compounds were active by measuring Luc up-regulation in SH-SY5Y-C1. Figure 4 describes the concentration curves derived with these newly acquired compounds. Results from this phase were very similar to the results obtained from automated profiling with preplated library compounds. Data originated from this validation phase were utilized for further analysis of the compounds’ effects.
Fig. 4.
Concentration response profiles of some of the primary hits selected for follow-up. Our original assay using the SH-SY5Y-C1 cells was used to characterize the effect of commercially acquired selected compounds. All 18 compounds were effective in up-regulating Luc once acquired from external vendors. Concentration-response profiling confirmed an almost overlapping response to the compounds present in the library. Statistical analysis allowed the calculation of EC50 and of the maximal effective concentration and other parameters related to the compounds’ effectiveness. The data obtained were used for the following validation phases. The profiles of seven selected compounds are shown based on successive experimental results.
NF-κB Activation by the Selected Compounds
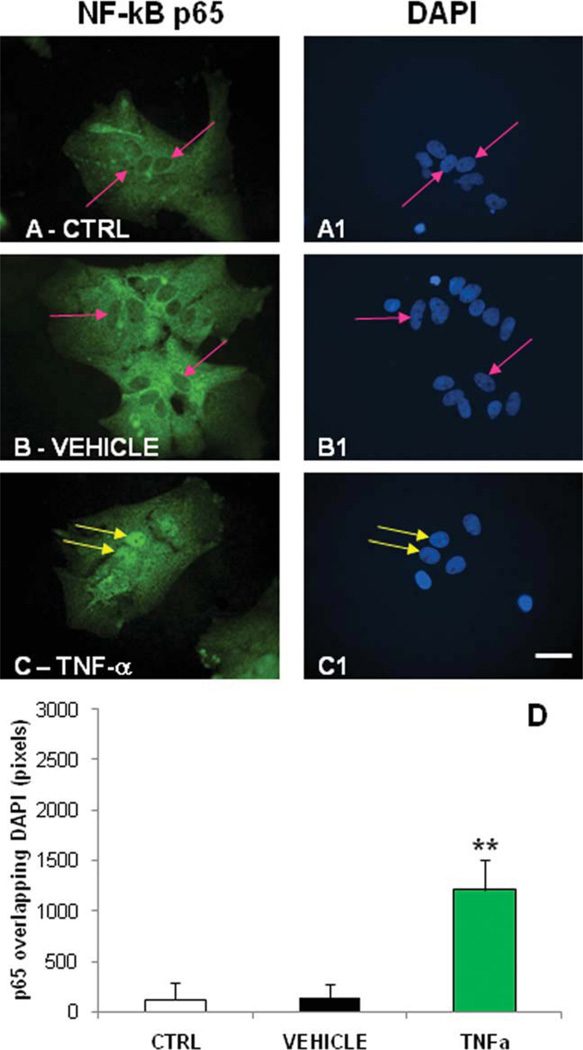
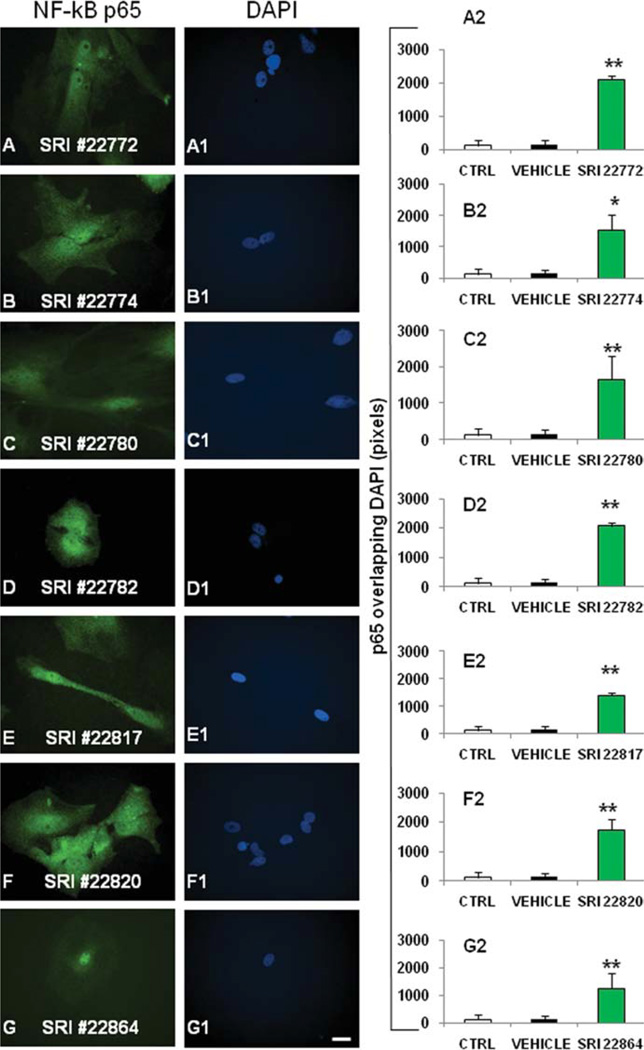
We studied the ability of the selected compounds to cause translocation of NF-κB in primary cultures of astrocytes. Astrocytes represent a very suitable imaging substrate for detecting translocating proteins as previously described (Pascale et al., 2004). Using immunocytochemistry and image analysis, we showed that the treatment of rat primary cortical astrocytes with TNF-α for 15 min (data not shown) and 24 hr resulted in the translocation of the p65 subunit of NF-κB to the cell nucleus, although to a different extent (Fig. 5C; analysis in Fig. 5D). TNF-α activation of NF-κB peaks within 30 min and then fades over time to a lower level after hours of continued exposure. Vehicle-treated cells after both 15 min (data not shown) and 24 hr showed no indication of p65 translocation (Fig. 5B; analysis in Fig. 5D). As expected, based on the assay design, none of the compounds caused significant translocation of p65 after 15 min (data not shown), indicating that most likely they are not activating pathways associated with I-κB phosphorylation and rapid activation (canonical pathways). Seven of the eighteen selected hit compounds caused p65 nuclear translocation after prolonged (24 hr) exposure (Fig. 6A–G; see analysis and statistical validation in Fig. 6A2–G2), suggesting that our compounds activate NF-κB in a noncanonical fashion.
Fig. 5.
Activation of NF-κB by TNF-α after 24 hr of exposure. p65 immunoreactivity was detected in rat primary cortical astrocytes using antibody-based indirect immunofluorescence, and nuclei were stained using DAPI. Cells were treated with 0.1% DMSO or TNF-α (20 ng/ml) for 24 hr. As expected, p65 green fluorescence is not evident in the nucleus of the untreated (A) or DMSO-treated astrocytes (B), as highlighted by the arrowheads. p65 green staining is evident in the nucleus of TNF-α-treated astrocytes (C), although, as expected, it is less intense than after 15 min of treatment (data not shown) and is highlighted by the arrowheads. A1–C1: DAPI staining in the untreated, DMSO-treated, and TNF-α-treated cells of the same fields. D: The graphs generated by comparing the area of the nucleus stained with DAPI and p65 green fluorescence using a colocalization analysis algorithm. Values converted by Metamorph software into numeric values were analyzed by ANOVA followed by the post hoc t-test. **P ≤ 0.01. Scale bar ± 10 µm.
Fig. 6.
Activation of NF-κB by compounds after 24 hr of exposure. p65 immunoreactivity was detected in rat primary cortical astrocytes using antibody-based indirect immunofluorescence. Nuclei were stained with DAPI. p65 staining was indicated by green fluorescence in A–G. A1–G1: DAPI staining in the compound-treated cells. A2–G2: The quantification of p65 and DAPI colocalization as described in Figure 5 and in the text. Control cells and TNF-treated cells can be assessed for reference in Figure 5. *P ≤ 0.05, **P ≤ 0.01. Scale bar ± 10 µm.
Computational Ligand Docking Studies
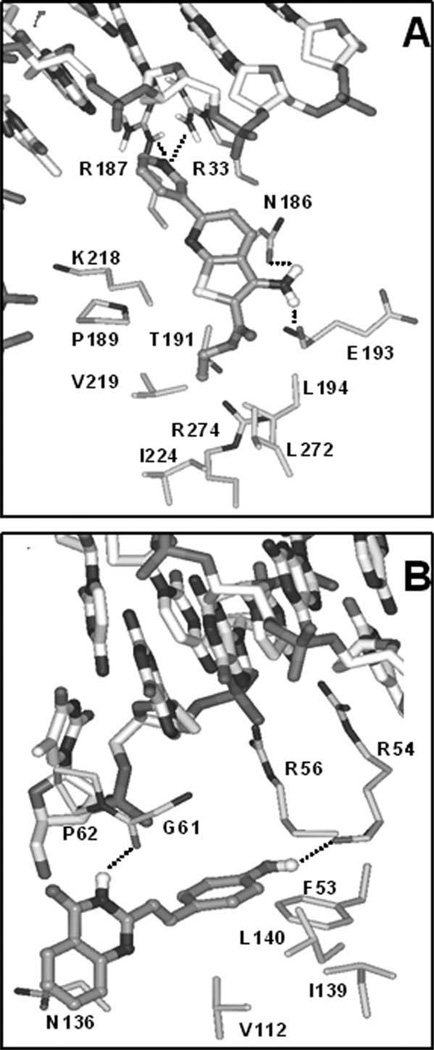
High-resolution crystal structures of the p50/p65 heterodimer (PDB entry codes 1LE9 and 1VKX) also include the sequence GGGGACTTTCC that is identical to the NF-κB enhancer element present in the vector pNF-κB-luc (Berkowitz et al., 2002) and the sequence 59-GGGRNYYYCC-39, where R is an unspecified purine, Y is an unspecified pyrimidine, and N is any nucleotide (Chen et al., 1998). A small, drug-like molecule may achieve the observed up-regulation of NF-κB activity through binding p50 and/or p65 near the DNA interaction region and possibly modulating transcriptional activity. Within the p65 subunit, two potential ligand binding sites were identified: one is lined with residues M32, R33, R35, Y36, K37 through I46, V91, I118, R187, and a second pocket consists of R33, N186, R187, P189, L194, D217, K218, Q220. Among the 18 active compounds docked into these p65 ligand binding pockets, favorable ligand binding poses were obtained for seven compounds, namely, SRI 22773, 22776, 22778, 22779, 22781, 22817, 22819. These seven compounds form favorable interactions with p65 residues, showing excellent complementarity of shape and polarity with the surrounding pocket region. Two examples are shown in Figure 7 (SRI 22781 and 22817).
Fig. 7.
Ligand docked. A: SRI-22817 compound shown in pocket b of the p65 subunit in the crystal structure with PDB id 1VKX. B: SRI-22781 compound in the p50 ligand binding pocket in the crystal structure with PDB id 1LE9. Carbon atoms of ligands are colored in dark gray, of the DNA in gray, and of NF-κB in light gray. Hydrogen bonding interactions are indicated with dotted lines. Side chains (with alpha carbons) of residues closest to the docked ligands are also shown.
I-κB and p65 Protein Levels in Primary Neurons
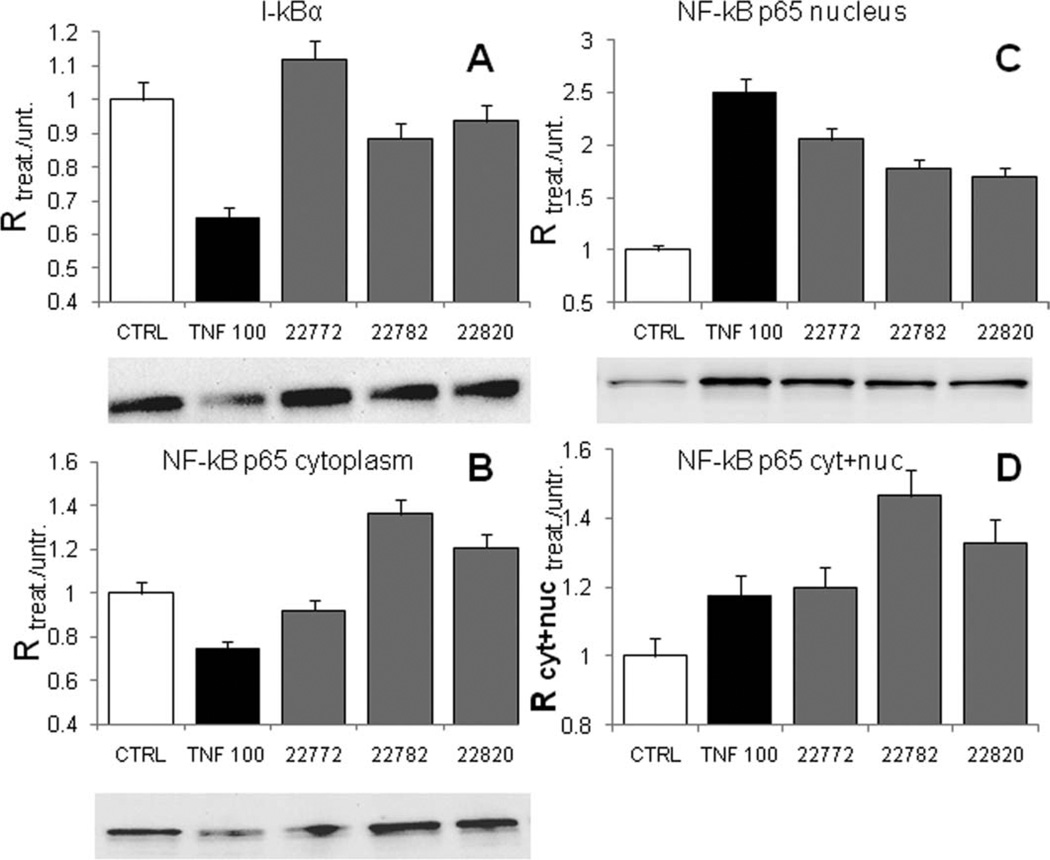
To test whether the selected compounds result in NF-κB p65 activation and up-regulation independently of cytokine receptor activation in neurons, we determined p65 protein levels in cytoplasmic and nuclear fractions following a 24-hr treatment with compounds SRI 22772, 22782, and 22820 at the maximum effective concentrations as determined by the analysis shown in Figure 4. As a positive control, we treated neurons with 100 ng/ml of TNF-α for 30 min. Western blot analysis revealed that I-κBα was markedly decreased in TNF-α-treated neurons, as expected, because of the effect of TNF-α receptor activation and subsequent phosphorylation of I-κBα (canonical activation of NF-κB; Fig. 8A). However, compound-treated neurons show no changes in I-κBα expression compared with untreated cells or TNF-α-treated cells. p65 protein expression in the cytoplasm was significantly increased following 24 hr of exposure to the compounds (Fig. 8B). As expected, TNF-α decreased p65 protein levels in the cytoplasm of primary neurons. Nuclear presence of NF-κB was significantly increased after treatment for 24 hr with the compounds (Fig. 8C). As expected, TNF-α increased nuclear presence of p65 (Fig. 8D). Finally, when the data from the cytoplasm and the nucleus were summed, all compounds caused a marked increase of total cellular p65 (Fig. 8D), supporting the view that our compounds achieve p65 activation by overall increased p65 protein synthesis.
Fig. 8.
Effects of compounds on I-κBα and NF-κB p65 protein levels. Neurons were treated with the selected compounds and TNF-α 100 ng/ml for 24 hr and 30 min, respectively. A: Compounds SRI 22772 (10 µM), 22782 (1 µM), and 22820 (1 µM) did not cause a significant reduction of I-κBα in neurons (gray bars). TNF-α caused the expected, and significant, decrease in I-κB levels (black bar). B: Treatment with compounds SRI 22782 and 22820 resulted in a marked increase of NF-κB as indicated by cytoplasmic increase of p65 (gray bars). TNF caused a reduction of p65 levels because of translocation. C: Compounds SRI 22772, 22782, and 22820 caused NF-κB activation as indicated by the increase of NF-κB protein levels in the nucleus-enriched fraction (gray bars). As expected, TNF-α also increased p65 in the nuclear extracts (black bar). D: Summation of p65 protein levels from the cytoplasm and the nuclear fraction of neurons showed that the total NF-κB protein quantity is greatly increased by the compound treatment (gray bars) and to a lower extent by TNF-α (black bar). Error bars indicate the 5% confidence error limit.
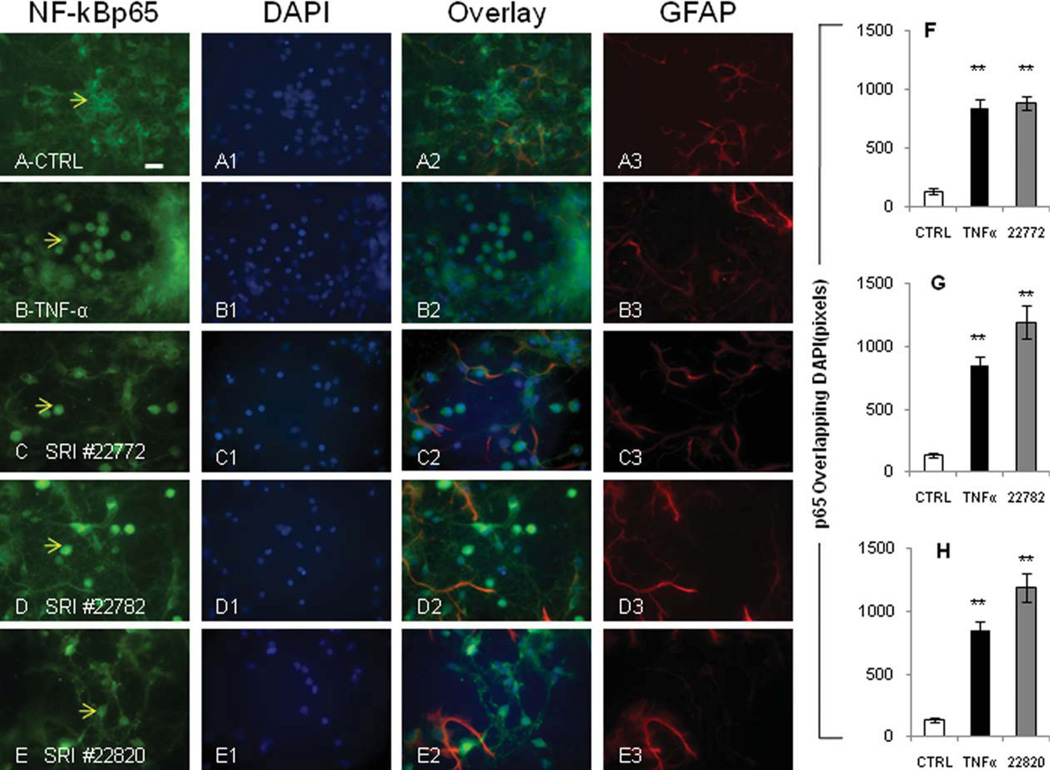
Primary cultures of neurons were treated at 6 days in vitro for 24 hr with the maximally effective concentration of the compound as determined from our profiling experiments. After incubation with the compounds, immunocytochemistry was performed and cultures were immunostained for p65 and glial fibrillary acidic protein (GFAP) for identification of cell type and DAPI. Indeed, each of the compounds tested, SRI 22772, 22782, and 22820, resulted in significant p65 translocation to the nucleus (Fig. 9C–E, respectively). Quantification of translocation followed by statistical analysis indicated a statistically significant relocation of p65 in the nucleus of primary neurons following compound and TNF-α treatment. The graphs in Figure 9 represent p65 staining in the region of DAPI staining (i.e., the nucleus) for more than 100 cells per treatment group (Fig. 9F–H) obtained in three independent experiments on at least three different cell preparations as an average ± SD. Each of the compounds tested resulted in significant translocation of p65 to neuronal nuclei, which exceeded the translocation quantified for TNF-α.
Fig. 9.
NF-κB compounds cause translocation of p65 in primary cortical neurons. A–A3: Untreated neurons show virtually absent p65 staining in the nucleus (example indicated by arrow in A). B–B3: Neurons treated for 15 min with 20 ng/ml TNFα show significant translocation of p65 (translocation indicated by arrow B). C– C3: Compound SRI 22772 at 30 µM causes p65 translocation in neuronal nuclei (arrow in C). D–D3: Compound SRI 22782 at 1 µM causes p65 translocation in neuronal nuclei (arrow in D). E– E3: Compound SRI 22820 at 10 µM causes p65 translocation in neuronal nuclei (arrow in E). F–H: Quantification of p65 translocation is shown in the bar graphs. The effect of TNF-α treatment is indicated in all bar graphs as a reference. Quantifications were performed with Metamorph software in greater than 100 cells per treatment. **P ≤ 0.01. Scale bar ± 10 µm.
Compound 22782 Is Neuroprotective Against Glutamate Excitotoxicity
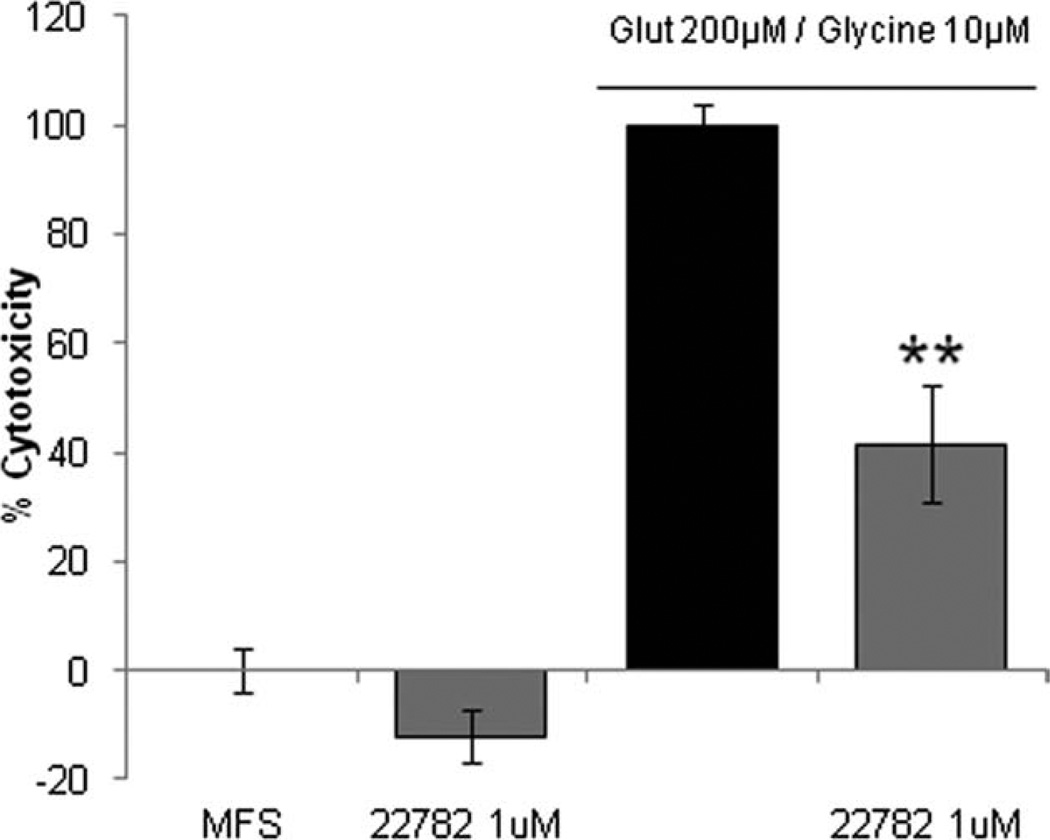
To determine whether our compounds are neuroprotective, we exposed neurons to compound SRI 22782 and glutamate. Treatment of primary neurons at 14 days in vitro with glutamate (200 µM) for 1 hr caused significant cell damage 24 hr following exposure, as assessed by increased levels of extracellular lactate dehydrogenase (LDH). When the neurons were pretreated with the maximally effective concentration of SRI 22782 for 24 hr, a reduction of 57% in glutamate cytotoxicity was observed (Fig. 10).
Fig. 10.
SRI 22782 protects from glutamate excitotoxicity. Primary neurons at 13 days in vitro were pretreated with 1 µM SRI 22782 for 24 hr. Cells were then exposed to 200 µM glutamate/10 µM glycine in Mg2+-free saline (MFS) for 1 hr. Twenty-four hours following glutamate treatment, an LDH assay was performed. LDH levels from MSF-treated cells are set to 0%, and glutamate values are set to 100%. **P ≤ 0.01.
DISCUSSION
The question of whether activation of NF-κB in neurons is prosurvival or prodeath has been a very complex undertaking in brain physiology studies. Contradictory reports have been produced, highlighting negative and positive effects of NF-κB activation on neuronal wellbeing, depending on the activation system used and the specific experimental design (Bhakar et al., 2002; Zhang et al., 2005). Regardless of the contrasting evidence, a clear trend appears establishing that activation of NF-κB in neurons is usually associated with positive consequences for neuronal resilience and survival in resting and also during exposure to stress. However, the work has been consistently complicated by the fact that selective NF-κB activation, independently from cytokine receptor activation, is not available at present. Activation of NF-κB via cytokine receptor activation is associated with activation of multiple signaling pathways, whose effects are often counteracting each other. For example, activation of the TNF receptor type 1 in neurons is clearly associated with neuroprotective effects, and activation of the TNF type 2 receptor is associated with glial activation of NF-κB signaling, with nitric oxide increase, a proinflammatory and prodeath mechanism (Marchetti et al., 2004). Posttranslational modifications, interaction between NF-κB subunits and cofactors, as well as novel components of the NF-κB activation pathways might account for the diverse effects of p65 in neuronal cells (Wooten, 1999; Mattson and Meffert, 2006).
Identification of NF-κB-activating agents based on a different noncanonical activation mechanism could represent a viable option for exploring the effect of selective NF-κB p65 activation in neuronal physiology and resilience to injury. In fact, emerging evidence in the literature strongly suggests that enhancing NF-κB availability using small molecules particularly in neurons may be a useful approach in the treatment of neuronal sufferance as it develops in neurodegenerative disorders because it bypasses unwanted effects of cytokine receptor activation. Development of direct noncytokine receptor-dependent NF-κB activators could also have the added benefit of improving the performance of neurons involved in learning and memory tasks (Meberg et al., 1996; Albensi and Mattson 2000).
Therefore, we sought to develop an assay to identify agents able to up-regulate NF-κB p65 in brain cells at a level such that I-κB inhibition will not suffice and significant and prolonged NF-κB activation can be achieved. The identification of such molecules will also allow us to taper NF-κB activation and therefore have complete control of the NF-κB signaling intensity.
We set up our assay in a human neuroblastoma cell line, SH-SY5Y, that retains the inducible ability to differentiate in neurons for follow-up studies (Biedler et al., 1978; Lopes et al., 2010). The development of our assay allowed the screening of a large compound repository of about 300,000 compounds. Our successful screening campaign and the following chemistry analysis yielded 18 interesting molecules.
Our data show that the accumulation of NF-κB molecules during 24 hr of treatment triggered by our compounds inverts the NF-κB/I-κB molecular ratio in favor of NF-κB, thus providing free NF-κB subunits that can freely migrate to the nucleus, thereby verifying our working hypothesis (Figs. 6, 8, 9). Similar modes of NF-κB activation have been demonstrated previously only in molecular overexpression models (Schmid et al., 2000). Such a noncanonical activation of NF-κB has been shown for p65 in kidney cells, where the continuous and sustained production of NF-κB under the control of a strong promoter, overwhelms I-κB inhibitory activity and NF-κB is free to translocate to the nucleus (Schmid et al., 2000). However, to the best of our knowledge, direct NF-κB activation via a noncanonical mechanism has not been demonstrated with small molecules before.
Also, our experiments demonstrate that our compounds have the potential to be neuroprotective, as shown in our excitotoxicity models. Although the mechanism whereby our compounds up-regulate NF-κB expression remains to be discovered, our in silico docking experiments suggest a possible interaction between our compounds and NF-κB at the DNA binding site. It has been shown that expression of the NF-κB gene is regulated by members of the NF-κB/Rel family (Cogswell et al., 2003). A possible mechanism underlying the observed compound activity could be ascribed to the potential of active compounds to enhance the binding of NF-κB p50/p65 to its own promoter sequence. We explored this possible mechanism through in silico methods, utilizing the two available high-resolution crystal structures of the p50/p65 heterodimer. Our data indicate that some of the compounds could up-regulate NF-κB expression by interacting with NF-κB at the level of its DNA binding sequence and possibly positively modulating the effectiveness of p65 in inducing its own transcription.
In conclusion, our study confirms that our campaign has generated viable compounds able to up-regulate NF-κB p65, in a nonreceptor-mediated pathway, and cause its activation as indicated by nuclear relocation. Furthermore, such compounds have shown neuro-protective effects in excitotoxicity paradigm experiments. Finally, the data generated in this and subsequent studies could initiate a drug development effort targeting neurodegenerative diseases using the approach of activating NF-κB in a noncanonical manner to increase resilience, protect neurons, and increase their plasticity.
ACKNOWLEDGMENTS
We thank Dr. Jill Heemskerk and the NINDS Anti-Neurodegenerative High Throughput Screening program for making their library available to us. We also acknowledge Shuang Feng and Melanie McGhee for statistical analysis of the data, for data import, and for report generation on HTS studies.
Contract grant sponsor: NIH; Contract grant number: 1R03MH082367-01 (to M.G.); Contract grant number: U54HG003912 (to Gary A. Piazza); Contract grant sponsor: Strategic Investment Plan initiative of Southern Research Institute (to M.G.).
REFERENCES
- Albensi BC, Mattson MP. Evidence for the involvement of TNF and NF-kappaB in hippocampal synaptic plasticity. Synapse. 2000;35:151–159. doi: 10.1002/(SICI)1098-2396(200002)35:2<151::AID-SYN8>3.0.CO;2-P. [DOI] [PubMed] [Google Scholar]
- Antczak M, Kung HJ. Transformation of chicken embryo fibroblasts by direct DNA transfection of single oncogenes: comparative analyses of src, erbB, myc, ras. J Virol. 1990;64:1451–1458. doi: 10.1128/jvi.64.4.1451-1458.1990. [DOI] [PMC free article] [PubMed] [Google Scholar]
- Auld DS, Southall NT, Jadhav A, Johnson RL, Diller DJ, Simeonov A, Austin CP, Inglese J. Characterization of chemical libraries for luciferase inhibitory activity. J Med Chem. 2008;51:2372–2386. doi: 10.1021/jm701302v. [DOI] [PubMed] [Google Scholar]
- Berkowitz B, Huang DB, Chen-Park FE, Sigler PB, Ghosh G. The x-ray crystal structure of the NF-kappa B p50.p65 heterodimer bound to the interferon beta-kappa B site. J Biol Chem. 2002;277:24694–24700. doi: 10.1074/jbc.M200006200. [DOI] [PubMed] [Google Scholar]
- Bhakar AL, Tannis LL, Zeindler C, Russo MP, Jobin C, Park DS, Mac-Pherson S, Barker PA. Constitutive nuclear factor-kappa B activity is required for central neuron survival. J Neurosci. 2002;22:8466–8475. doi: 10.1523/JNEUROSCI.22-19-08466.2002. [DOI] [PMC free article] [PubMed] [Google Scholar]
- Biedler JL, Roffler-Tarlov S, Schachner M, Freedman LS. Multiple neurotransmitter synthesis by human neuroblastoma cell lines and clones. Cancer Res. 1978;38:3751–3757. [PubMed] [Google Scholar]
- Chen FE, Huang DB, Chen YQ, Ghosh G. Crystal structure of p50/p65 heterodimer of transcription factor NF-kappaB bound to DNA. Nature. 1998;391:410–413. doi: 10.1038/34956. [DOI] [PubMed] [Google Scholar]
- Cheng B, Christakos S, Mattson MP. Tumor necrosis factors protect neurons against metabolic-excitotoxic insults and promote maintenance of calcium homeostasis. Neuron. 1994;12:139–153. doi: 10.1016/0896-6273(94)90159-7. [DOI] [PubMed] [Google Scholar]
- Cogswell PC, Kashatus DF, Keifer JA, Guttridge DC, Reuther JY, Bristow C, Roy S, Nicholson DW, Baldwin AS., Jr NF-kappa B and I kappa B alpha are found in the mitochondria. Evidence for regulation of mitochondrial gene expression by NF-kappa B. J Biol Chem. 2003;278:2963–2968. doi: 10.1074/jbc.M209995200. [DOI] [PubMed] [Google Scholar]
- Favit A, Grimaldi M, Nelson TJ, Alkon DL. Alzheimer’s-specific effects of soluble beta-amyloid on protein kinase C-alpha and -gamma degradation in human fibroblasts. Proc Natl Acad Sci U S A. 1998;95:5562–5567. doi: 10.1073/pnas.95.10.5562. [DOI] [PMC free article] [PubMed] [Google Scholar]
- Gilmore TD. NF-kappa B, KBF1, dorsal, and related matters. Cell. 1990;62:841–843. doi: 10.1016/0092-8674(90)90257-f. [DOI] [PubMed] [Google Scholar]
- Gilmore TD. Introduction to NF-kappaB: players, pathways, perspectives. Oncogene. 2006;25:6680–6684. doi: 10.1038/sj.onc.1209954. [DOI] [PubMed] [Google Scholar]
- Grimaldi M, Pozzoli G, Navarra P, Preziosi P, Schettini G. Vasoactive intestinal peptide and forskolin stimulate interleukin 6 production by rat cortical astrocytes in culture via a cyclic AMP-dependent, prostaglandin-independent mechanism. J Neurochem. 1994;63:344–350. doi: 10.1046/j.1471-4159.1994.63010344.x. [DOI] [PubMed] [Google Scholar]
- Grimaldi M, Favit A, Alkon DL. cAMP-induced cytoskeleton rearrangement increases calcium transients through the enhancement of capacitative calcium entry. J Biol Chem. 1999;274:33557–33564. doi: 10.1074/jbc.274.47.33557. [DOI] [PubMed] [Google Scholar]
- Guerrini L, Blasi F, Denis-Donini S. Synaptic activation of NF-kappa B by glutamate in cerebellar granule neurons in vitro. Proc Natl Acad Sci U S A. 1995;92:9077–9081. doi: 10.1073/pnas.92.20.9077. [DOI] [PMC free article] [PubMed] [Google Scholar]
- Guo Q, Robinson N, Mattson MP. Secreted beta-amyloid precursor protein counteracts the proapoptotic action of mutant presenilin-1 by activation of NF-kappaB and stabilization of calcium homeostasis. J Biol Chem. 1998;273:12341–12351. doi: 10.1074/jbc.273.20.12341. [DOI] [PubMed] [Google Scholar]
- Hart DJ, Speight RE, Sutherland JD, Blackburn JM. Analysis of the NF-kappaB p50 dimer interface by diversity screening. J Mol Biol. 2001;310:563–575. doi: 10.1006/jmbi.2001.4724. [DOI] [PubMed] [Google Scholar]
- Hoffmann A, Natoli G, Ghosh G. Transcriptional regulation via the NF-kappaB signaling module. Oncogene. 2006;25:6706–6716. doi: 10.1038/sj.onc.1209933. [DOI] [PubMed] [Google Scholar]
- Holloway JN, Murthy S, El-Ashry D. A cytoplasmic substrate of mitogen-activated protein kinase is responsible for estrogen receptor-alpha down-regulation in breast cancer cells: the role of nuclear factor-kappaB. Mol Endocrinol. 2004;18:1396–1410. doi: 10.1210/me.2004-0048. [DOI] [PubMed] [Google Scholar]
- Huberman M, Berg PE, Curcio MJ, DiPietro J, Henderson AS, Anderson WF. Fate and structure of DNA microinjected into mouse TK-L cells. Exp Cell Res. 1984;153:347–362. doi: 10.1016/0014-4827(84)90605-0. [DOI] [PubMed] [Google Scholar]
- Huxford T, Malek S, Ghosh G. Structure and mechanism in NF-kappa B/I kappa B signaling. Cold Spring Harbor Symp Quant Biol. 1999;64:533–540. doi: 10.1101/sqb.1999.64.533. [DOI] [PubMed] [Google Scholar]
- Kaltschmidt B, Uherek M, Wellmann H, Volk B, Kaltschmidt C. Inhibition of NF-kappaB potentiates amyloid beta-mediated neuronal apoptosis. Proc Natl Acad Sci U S A. 1999;96:9409–9414. doi: 10.1073/pnas.96.16.9409. [DOI] [PMC free article] [PubMed] [Google Scholar]
- Kaltschmidt B, Widera D, Kaltschmidt C. Signaling via NF-kappaB in the nervous system. Biochim Biophys Acta. 2005;1745:287–299. doi: 10.1016/j.bbamcr.2005.05.009. [DOI] [PubMed] [Google Scholar]
- Kaltschmidt C, Kaltschmidt B, Baeuerle PA. Stimulation of iono-tropic glutamate receptors activates transcription factor NF-kappa B in primary neurons. Proc Natl Acad Sci U S A. 1995;92:9618–9622. doi: 10.1073/pnas.92.21.9618. [DOI] [PMC free article] [PubMed] [Google Scholar]
- Karin M, Ben-Neriah Y. Phosphorylation meets ubiquitination: the control of NF-κB activity. Annu Rev Immunol. 2000;18:621–663. doi: 10.1146/annurev.immunol.18.1.621. [DOI] [PubMed] [Google Scholar]
- Leahy P, Carmichael GG, Rossomando EF. Transcription from plasmid expression vectors is increased up to 14-fold when plasmids are transfected as concatemers. Nucleic Acids Res. 1997;25:449–450. doi: 10.1093/nar/25.2.449. [DOI] [PMC free article] [PubMed] [Google Scholar]
- Liu CA, Wang MJ, Chi CW, Wu CW, Chen JY. Overexpression of rho effector rhotekin confers increased survival in gastric adenocarcinoma. J Biomed Sci. 2004;11:661–670. doi: 10.1007/BF02256132. [DOI] [PubMed] [Google Scholar]
- Lopes FM, Schroder R, da Frota ML, Jr, Zanotto-Filho A, Muller CB, Pires AS, Meurer RT, Colpo GD, Gelain DP, Kapczinski F, Moreira JC, Fernandes Mda C, Klamt F. Comparison between proliferative and neuron-like SH-SY5Y cells as an in vitro model for Parkinson disease studies. Brain Res. 2010;1337:85–94. doi: 10.1016/j.brainres.2010.03.102. [DOI] [PubMed] [Google Scholar]
- Lu Q, Qiu X, Hu N, Wen H, Su Y, Richardson BC. Epigenetics, disease, and therapeutic interventions. Ageing Res Rev. 2006;5:449–467. doi: 10.1016/j.arr.2006.07.001. [DOI] [PubMed] [Google Scholar]
- Marchetti L, Klein M, Schlett K, Pfizenmaier K, Eisel UL. Tumor necrosis factor (TNF)-mediated neuroprotection against glutamate-induced excitotoxicity is enhanced by N-methyl-D-aspartate receptor activation. Essential role of a TNF receptor 2-mediated phosphatidylinositol 3-kinase-dependent NF-kappa B pathway. J Biol Chem. 2004;279:32869–32881. doi: 10.1074/jbc.M311766200. [DOI] [PubMed] [Google Scholar]
- Mattson MP, Meffert MK. Roles for NF-kappaB in nerve cell survival, plasticity, and disease. Cell Death Differ. 2006;13:852–860. doi: 10.1038/sj.cdd.4401837. [DOI] [PubMed] [Google Scholar]
- Meberg PJ, Kinney WR, Valcourt EG, Routtenberg A. Gene expression of the transcription factor NF-kappa B in hippocampus: regulation by synaptic activity. Brain Res Mol Brain Res. 1996;38:179–190. doi: 10.1016/0169-328x(95)00229-l. [DOI] [PubMed] [Google Scholar]
- Pascale A, Alkon DL, Grimaldi M. Translocation of protein kinase C-betaII in astrocytes requires organized actin cytoskeleton and is not accompanied by synchronous RACK1 relocation. Glia. 2004;46:169–182. doi: 10.1002/glia.10354. [DOI] [PubMed] [Google Scholar]
- Pizzi M, Sarnico I, Boroni F, Benarese M, Steimberg N, Mazzoleni G, Dietz GP, Bahr M, Liou HC, Spano PF. NF-kappaB factor c-Rel mediates neuroprotection elicited by mGlu5 receptor agonists against amyloid beta-peptide toxicity. Cell Death Differ. 2005;12:761–772. doi: 10.1038/sj.cdd.4401598. [DOI] [PubMed] [Google Scholar]
- Schmid JA, Birbach A, Hofer-Warbinek R, Pengg M, Burner U, Furtmuller PG, Binder BR, de Martin R. Dynamics of NF kappa B and Ikappa Balpha studied with green fluorescent protein (GFP) fusion proteins. Investigation of GFP-p65 binding to DNa by fluorescence resonance energy transfer. J Biol Chem. 2000;275:17035–17042. doi: 10.1074/jbc.M000291200. [DOI] [PubMed] [Google Scholar]
- Sengchanthalangsy LL, Datta S, Huang DB, Anderson E, Braswell EH, Ghosh G. Characterization of the dimer interface of transcription factor NFkappaB p50 homodimer. J Mol Biol. 1999;289:1029–1040. doi: 10.1006/jmbi.1999.2823. [DOI] [PubMed] [Google Scholar]
- Wooten MW. Function for NF-κB in neuronal survival: regulation by atypical protein kinase C. J Neurosci Res. 1999;58:607–611. doi: 10.1002/(sici)1097-4547(19991201)58:5<607::aid-jnr1>3.0.co;2-m. [DOI] [PubMed] [Google Scholar]
- Zhang JH, Chung TD, Oldenburg KR. A simple statistical parameter for use in evaluation and validation of high throughput screening assays. J Biomol Screen. 1999;4:67–73. doi: 10.1177/108705719900400206. [DOI] [PubMed] [Google Scholar]
- Zhang W, Potrovita I, Tarabin V, Herrmann O, Beer V, Weih F, Schneider A, Schwaninger M. Neuronal activation of NF-kappaB contributes to cell death in cerebral ischemia. J Cereb Blood Flow Metab. 2005;25:30–40. doi: 10.1038/sj.jcbfm.9600004. [DOI] [PubMed] [Google Scholar]


