

Abstract
p53 binds as a tetramer to DNA targets consisting of two decameric half-sites separated by a variable spacer. Here we present high-resolution crystal structures of complexes between p53 core-domain tetramers and DNA targets consisting of contiguous half-sites. In contrast to previously reported p53-DNA complexes that display standard Watson-Crick base pairs, the newly reported structures exhibit non-canonical Hoogsteen base-pairing geometry at the central A/T doublet of each half-site. Structural and computational analyses demonstrate that the Hoogsteen geometry distinctly modulates the B-DNA helix in terms of local shape and electrostatic potential which together with the contiguous DNA configuration results in enhanced protein-DNA and protein-protein interactions compared to non-contiguous half-sites. Our results suggest a mechanism, which relates spacer length to protein-DNA binding affinity. Our findings also expand the current understanding of protein-DNA recognition and establish the structural and chemical properties of Hoogsteen base pairs as the basis for a novel mode of sequence readout.
The tumor suppressor protein p53 acts as a transcription factor in response to a wide variety of cellular stress signals, regulating the expression of an array of different genes that mediate a variety of growth inhibitory events including cell-cycle arrest and apoptosis1–4. p53 binds in a sequence-specific manner to DNA binding sites that consist of two copies of the 10 base-pair motif RRRCWWGYYY (R=A,G; W=A,T; Y=C,T) separated by a variable number of base pairs5–7. Upon binding to DNA targets, p53 forms tetramers, which is the protein’s basic functional unit8,9. Human p53 is a 393-residue protein that contains three major functional domains10–12. The N-terminus contains a transactivation domain, the core domain that contains the sequence-specific DNA binding domain, and the C-terminal domain that comprises an oligomerization domain followed by a regulatory domain. The core domain is the main target for mutations as 80–90% of the missense mutations identified in human tumors, are found in this region13. How p53 chooses which genes to activate is critical in understanding its role as a tumor suppressor. A number of variables such as cofactor recruitment, post-translational modification, p53-mediated gene activation and repression, and differential binding affinity of p53 for DNA all play a role in dictating p53 response1–4.
Several studies showed that most of the DNA sequences involved in cell cycle arrest, DNA repair, and negative regulation bind p53 with high affinity14,15. In contrast, sequences from genes involved in apoptosis show large variations in affinity, with some binding as tightly as cell cycle arrest sequences and others up to 100 times more weakly15. It was shown that cell-cycle-related sequences with high p53 binding affinities do not have “spacers” interspersed between the two half-sites and have two or fewer mismatches within the consensus DNA binding site. In contrast, apoptosis-related sequences with lower affinity for p53 binding have interspersed sequences between the two half-sites and/or three or more mismatches14–16, suggesting that intrinsic structural properties of the DNA sequence might play a role in modulating the affinity of p53 for its binding sites14,15.
The binding of p53 molecules to DNA have been studied with a variety of biophysical methods (reviewed by Joerger and Fersht17). The first structural information was for the core domain of human p53 bound as a monomer to a DNA duplex containing a single decameric motif18. It was found that the core domain adopts an immunoglobulin-like β sandwich that provides a scaffold for a DNA-binding surface consisting of a loop-sheet-helix motif and two loops stabilized by a zinc ion18. In 2006, we presented the first structural data on human p53 tetramers bound to DNA, specifically of complexes between the p53 core domain and DNA dodecamers incorporating consensus half-sites of different sequences19. We showed that two p53 molecules bind each DNA half-site in a sequence-specific manner, and two such dimers assemble into tetramers. In all these structures, the two decameric half-sites were separated bya two base-pair spacer. DNA binding studies have shown that such DNA targets are of lower binding affinity compared to those where the two half sites are contiguous19. Additional structural data on p53–DNA interactions were obtained from crystal structures of a dimer and a tetramer of the mouse p53 core domain, but in this case the protein was covalently linked, to one DNA half-site in the former and two contiguous half-sites in the latter, via cysteine side chains and cytosine bases20,21. Until recently, no structural information has been available on naturally-assembled p53 tetramers on full-length DNA targets with contiguous half-sites. However, after this study was submitted for publication the crystal structure of a p53 core-domain tetramer bound to a different DNA sequence with contiguous half-sites was reported22. Differences between that structure and the one reported here are discussed below.
Here, we present the high-resolution crystal structures of self-assembled human p53 core-domain tetramers bound to DNA targets with contiguous decameric half-sites, each displaying Hoogsteen base pairs23 at the central A/T doublet of each half-site. A comparative analysis of the newly-determined structures and our previously reported structures demonstrates that the 3-D architecture of p53–DNA complexes depend on the specific sequence and shape of the DNA half-sites and the DNA spacer between them. Our results provide new insights into the complexity and variability of sequence-specific DNA recognition by p53.
RESULTS
Overall Structure of p53 tetramers bound to contiguous DNA half-Sites
The core domain of human p53 used in the present study spans residues 94–293 and is referred to as the “core” or p53 DNA binding domain, p53DBD. For crystallization experiments we used the wt core domain and that of the “structurally-restored” double mutant core, R249S/H168R, that was shown to bind DNA24. Each protein was co-crystallized with the dodecameric sequence, cGGGCATGCCCg, used previously19. The wt p53 was also co-crystallized with a 21-mer DNA that contains the same DNA half-sites and a 5′ overhung thymidine: tGGGCATGCCCGGGCATGCCC. The present p53–DNA complexes were crystallized in the C2 space group, where the asymmetric unit contains either one protein molecule and a single DNA strand that contains one half-site (complexes 1 and 2 in Table 1), or two protein molecules and a single DNA strand that contains two half-sites (complex 3 in Table 1) that via symmetry operations generate continuous stacks of p53/DNA tetramers (Supplementary Fig. 1). Complexes 1 and 2 are identical apart from the two mutations (R249S/H168R) in the core domain of complex 2.
Table 1.
Data collection and refinement statistics
| p53-DNA Complex 1* | p53-DNA Complex 2* | p53-DNA Complex 3* | |
|---|---|---|---|
| Data collection | |||
| Space group | C2 | C2 | C2 |
| Cell dimensions | |||
| a, b, c (Å) | 137.2, 49.8, 34.0 | 137.3, 49.6, 33.9 | 138.4, 49.8, 68.1 |
| α, β, γ (°) | 90.0, 94.0, 90.0 | 90.0, 94.7, 90.0 | 90.0, 93.5, 90.0 |
| Resolution (Å) | 1.8(1.83 1.8) ** | 1.7(1.73 1.7) | 1.88(1.91 1.88) |
| Rsym | 4.9(22.5) | 5.9(20.3) | 9.9(48.6) |
| I/σI | 32.1(6.3) | 21.0(5.0) | 25.3(4.7) |
| Completeness (%) | 95.0(91.6) | 98.9(96.9) | 99.9(100) |
| Redundancy | 5.1(5.0) | 4.0(3.7) | 6.9(7.2) |
| Refinement | |||
| Resolution (Å) | 24.9 1.8 | 22.8 1.7 | 34.5 1.9 |
| No. of unique reflections | 20253 | 24859 | 34235 |
| Protein/DNA duplexes in asymmetric unit | 1/0.5 | 1/0.5 | 2/0.5 |
| Rwork/Rfree | 14.8/21.2 | 15.0/21.4 | 22.1/26.6 |
| No. atoms | |||
| Protein | 1560 | 1576 | 3058 |
| DNA | 225 | 225 | 410 |
| Ligand/ion | 9 | 1 | 4 |
| Water | 343 | 344 | 312 |
| B-factors (Å2) | |||
| Protein | 27.7 | 25.6 | 27.2 |
| DNA | 26.9 | 28.4 | 26.0 |
| Ligand/ion | 39.6 | 20.8 | 31.2 |
| Water | 36.7 | 35.3 | 33.2 |
| R.m.s. deviations | |||
| Bond lengths (Å) | 0.026 | 0.027 | 0.031 |
| Bond angles (°) | 2.34 | 2.41 | 2.82 |
Each data set was collected from a single crystal.
The DNA used is cGGGCATGCCCg for complexes 1 and 2 and tGGGCATGCCCGGGCATGCCC for complex 3.
Values in parentheses are for the highest-resolution shell.
The three crystallized complexes display a new organization of p53 molecules on the DNA helix. Although the DNA used for complexes 1 and 2 was the same 12mer oligomer used in our previously determined crystal structures19,24, here the bound B-DNA organizes the two decameric half-sites in a different way. In the previously reported structures the 3′-end nucleotides and the 5′-end nucleosides of two double-helical dodecamers remain part of each helix and act as a two base-pair spacer between the two half-sites (Fig. 1a). In the structures reported here, the last two nucleotides at the 3′-end of each dodecameric strand are extrahelical, so that the 10th base (C10) is stacked on the first base (C1) of an adjacent molecule, thus creating a continuous DNA helix with a 10 base-pair helical repeat (Fig. 1b). Whereas in complex 1 and 2 the two half-sites are not covalently linked, the structure of complex 3 contains covalently-linked decameric DNA half-sites but, nevertheless, is very similar to that of the other two complexes. This finding, taken together with our previous structural data on p53–DNA complexes19, demonstrates that backbone gaps in p53 binding sites do not interfere with the self-assembly of p53–DNA tetramers, provided that the base pairs in such regions are properly arranged to form a continuous DNA binding site that is recognized by p53. The analysis presented here is based on the higher-resolution wt structure of complex 1, unless stated otherwise. The complexes from our previous study19 and the present one are referred to as type I and type II, respectively.
Figure 1.

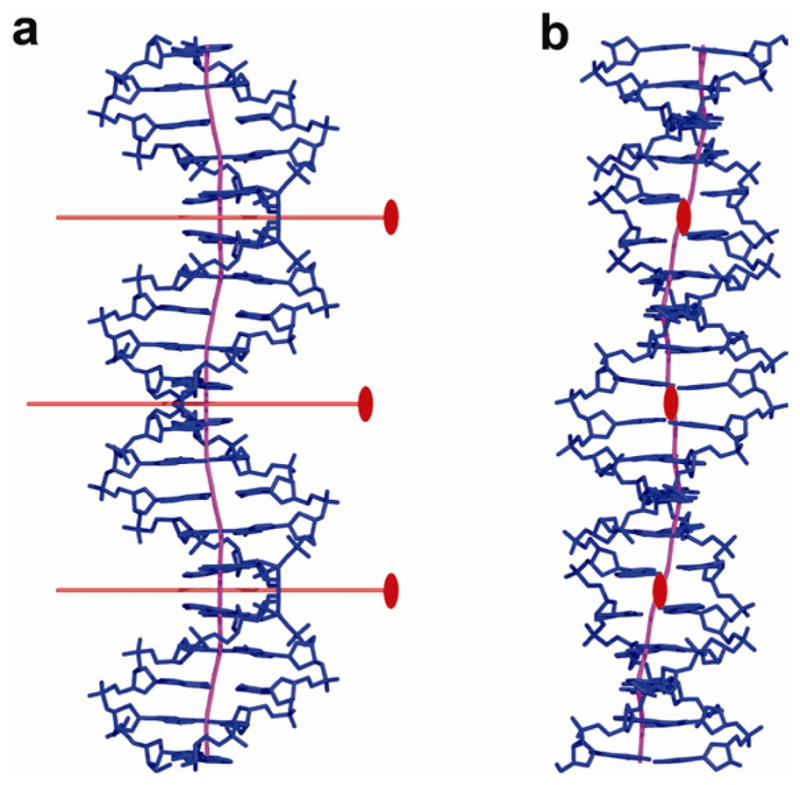
DNA binding sites of type-I and type-II complexes. (a) Type-I complex formed by DNA dodecamers: the two half-sites are separated by a two base pair spacer19. (b) Type-II complexes formed by DNA dodecamers: the two half-sites are contiguous as the two nucleotides at each 3′-end are extrahelical, and the decameric duplexes are stacked end-to-end (complexes 1 and 2 in Table 1). (c) Type-II complex formed by 21-mer DNA oligomers: a 20 base-pair duplex with contiguous half-sites and extrahelical T-nucleotides at each 5′-end (complex 3 in Table 1). Complex 3 is essentially identical in structure to that of complexes 1 and 2.
In both types of complexes, four p53 molecules interact with two DNA half-sites to form a tetramer which is a dimer of dimers. However, the two types of complexes differ in the relative orientation of the two half-sites and hence in the 3-D architecture of the corresponding p53–DNA tetramers (shown here in Fig. 2 and in Fig. 1 from Kitayner et al.19). In the type-II complexes, the two dimers are parallel to each other (Fig. 2), whereas in type-I complexes, the two decameric half-sites are separated by two base pairs and as a result, the two DNA-bound p53 dimers are rotated in a clock-wise manner by nearly 33°19. In type-II complexes, each tetramer has a perfect dyad symmetry coinciding with the crystallographic 2-fold axes and additional dyad symmetry within each dimer. Hence, the three dyad axes of each complex are parallel to each other and the overall DNA helix is straight.
Figure 2.

Overall structure of the p53 core-domain tetramer bound to DNA with contiguous half-sites. (a) Four p53 core domains (designated as A, B, C and D) interact with a 20 base-pair DNA (shown in blue). The core tetramer is a dimer of dimers: A–B (in cyan) and C–D (in green). The four Zn ions are shown as magenta spheres. View down the central dyad of the core tetramer. (b) View perpendicular to the central dyad and the DNA helix axis. (c) View down the DNA helix axis. Also shown in red are the central dyad between dimers and the two local dyads within dimers. The figure is based on the coordinates of complex 3. Amino-acid sequence and secondary structure of the core domain are in Supplementary Fig. 2.
Extensive protein-protein interactions stabilize type-II complexes
The direct protein-DNA contacts in type-II complexes are essentially identical to those displayed in type-I complexes. However, the two types of tetramers display distinct differences in their protein-protein interfaces. Two types of protein-protein interfaces were previously characterized19. The first one, referred to as the symmetrical or intra-dimer interface, is located within each core dimer bound to its DNA half-site. The second one, referred to as the translational or inter-dimer interface, links the two core dimers along the DNA helix.
The intra-dimer interface formed by the type-II complexes displays similar characteristics to that of type-I complexes19. However, appreciable changes are observed in the relative orientation of the monomers relative to each other and to the DNA (Fig. 3). A distinct difference is observed at the region distant from the DNA; in type-II structures there is a pair of bidentate salt bridges between Glu180 and Arg181 from each monomer, further supported by water-mediated hydrogen bonds between the charged amino acids and the backbone of the H1 helix (Fig. 3a). In type-I structures the Arg181 side chains from the two monomers are stacked upon each other19 (Figure 3b). The existence of salt bridges between the arginine and aspartic acid residues was previously proposed on the basis of site-directed mutagenesis and DNA binding experiments25. The charged interactions in type-II dimers are facilitated by the further proximity of the monomers in this region relative to that in type-I dimers (illustrated in Figs. 3a and 3c) and as a result lead to a marked increase in the intra-dimer buried surface: 850 Å2 in type-II compared with 650 Å2 in type-I complexes.
Figure 3.
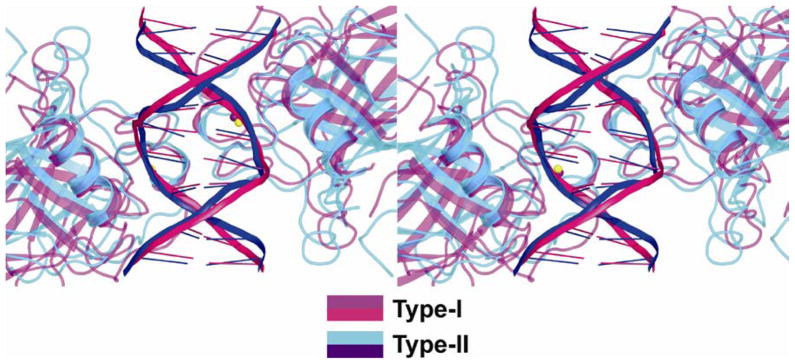
Comparison of p53 core dimers bound to DNA half-sites in type-I and type-II complexes. (a) Superposition of type-I structure (DNA in pink, p53 and Zn ion in magenta) onto type-II structure (DNA in blue, p53 in cyan, Zn ions in yellow) is based on the DNA backbone atoms. The stereo view is down the dyad of the dimer and into the DNA major groove. The view highlights the different DNA conformations and the different arrangements of the p53 molecules on their DNA in type-I and type-II complexes. (b) Stereo view of the salt bridges between residues Glu180 and Arg181 in type-II intra-dimer interface, and the supporting hydration shell, shown within the electron density (2Fo−Fc at 1σ level). Water molecules from the first- hydration shell are shown as red spheres (based on complex 2). (c) Stereo view of the superposition of the same regions in type-I (magenta) and type-II (cyan) complexes. It shows the stacking of the guanidinium groups of arginine residues in type I and the salt bridges in type II as well as the further proximity of the protein backbones in the later relative to the former.
Much greater differences are found in the inter-dimer interfaces. The buried surface area between monomers along the DNA helix in type-II structures is extensive, ~1200 Å2, compared to a maximal value of nearly 600 Å2 observed in type-I structures19 where the two dimers are further apart because of the two base-pair spacer and their large rotation relative to each other (Fig. 4). The type-II interface consists mainly of an extensive water-mediated network of polar and charged amino acids (illustrated in Supplementary Fig. 3). Direct interactions between polar and charged amino acids are listed in Supplementary Table 1.
Figure 4.

Inter-dimer interfaces. (a) Type-I interface (b) Type-II interface. Two p53 core domains comprising half of the inter-dimer interface are shown in cyan and green (the other half is related by dyad symmetry). The structures of the DNA-bound core domains in type-I and type-II complexes are very similar except for the flexible L1 recognition loop (see Supplementary RESULTS).
The large increase in protein-protein interactions among the four core domains of type-II tetramers provides a structural basis for understanding the different binding affinities measured for p53 core domain and DNA targets that have identical half-sites but, that are either contiguous or separated by two base pairs19. As the protein-DNA contacts are very similar between the two complexes, it appears that the observed higher affinity and stability of p53 complexes with DNA targets with contiguous half-sites is caused by enhanced protein-protein interactions within and between the two dimers observed in type-II tetramers. Additional factors relating to DNA shape and electrostatics discussed below, further contribute to the binding properties of the complexes.
The DNA binding site contains Hoogsteen base pairs
As described above the DNA binding site in type-II complexes is made of two contiguous double-helical decamers stacked end-to-end in the crystal so as to form a continuous B-DNA helix (Figs. 1b,c). The DNA trajectory highlighted by the curved helix axis (Supplementary Fig. 4b) demonstrates that each of the decameric half-sites is bent slightly toward the major groove at the central A/T doublet and away from the core dimer (Fig. 2b) in a similar manner to that shown by type-I complexes19. However, in type-II complexes the combined two half-site DNA is straight as a result of a comparable bend towards the major groove at the G/C rich region between half-sites (Fig. 2b, Supplementary Fig. 4b). A distinctly larger bending at the junction between half-sites and toward the core tetramer is observed in type-I complexes where the two half-sites are separated by a two base-pair spacer19 (Supplementary Fig. 4a). This large deformation results in a reduced distance of nearly 34 Å between the centers of the DNA half-sites in comparison to a straight helix, thereby facilitating the formation of an inter-dimer interface by the attached core dimers.
A novel feature of the type II p53-DNA complexes is that the A/T base pairs at the center of each half-site display the Hoogsteen geometry in which hydrogen bonds are formed between the pyrimidine N3 and the purine N7 atoms, and either the adenine N6 and the thymine O4 or the guanine O6 and the cytosine N4 atoms. Comparisons between Watson-Crick (WC) and Hoogsteen base pairs from type-I and type-II complexes are shown in Figs. 5a–c. The effects of the alternative base-pairing geometry on the backbone trajectory and associated groove dimensions are illustrated in Fig. 5d. A detailed comparison between the WC- and Hoogsteen-containing DNA conformations of the same base sequence demonstrates striking changes in several helical parameters including helix diameter and groove dimensions (Fig. 6). A reduction in the helix diameter by 1–2 Å is observed in the vicinity of Hoogsteen base pairs (Fig. 6a) that is associated with substantial narrowing of the minor groove in the regions flanking the central CATG elements (Fig. 6b). As described above, the DNA oligomer, cGGGCATGCCCg, used here for complexes 1 and 2, is the same DNA dodecamer used previously19,24. The observation of different structures suggests that type-I complexes with WC base pairs and two base-pair spacer, and type-II complexes with Hoogsteen base pairs, zero base-pair spacer and extra helical bases, are in equilibrium in solution, and that changes in crystallization conditions affect the trapping of one form or the other. In the case of complex 3 where the two decameric half-sites are contiguous and covalently linked, only the Hoogsteen-containing structure is obtained, suggesting that this particular form is driven by the enhanced inter-dimer protein-protein interactions facilitated by the zero-spacer DNA sequence.
Figure 5.
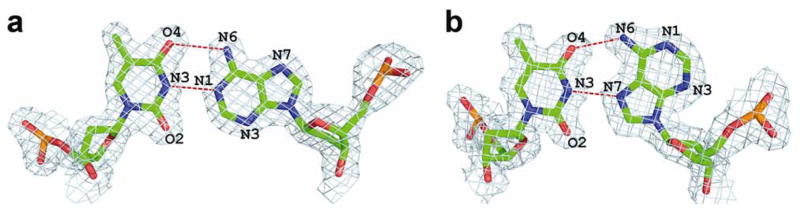
Comparison of Hoogsteen and Watson-Crick base pairs. (a) Watson-Crick A/T base pair from type-I complex (PDB ID 2AC0 from ref. 19). (b) Hoogsteen A/T base pair from type-II complex. Both are shown within their electron density maps (2Fo−Fc at 1σ level). (c) Stereo view of the superposition of Watson-Crick and Hoogsteen base pairs showing the change in the positions of the glycosidic bonds of the adenine bases and the attached backbones. (d) Stereo view of DNA quarter-sites from type-I and type-II complexes shown in magenta and blue, respectively. It illustrates the change in the backbone trajectory following the Hoogsteen base pair and its effect on the narrowing of the minor groove in type-II helix. The superposition is based on the coordinates of the central T nucleotides of the corresponding half-sites.
Figure 6.
DNA helix parameters in type-I and type-II complexes.
(a) Variations in helix diameter along the DNA helix (b) Variations in minor-groove width along the DNA helix. Calculations were performed with our in-house version of Curves adapted for Hoogsteen base pairs. The values for the G/C spacer in type-I complex are not shown for clarity.
To further evaluate the importance of Hoogsteen base pairing, we reanalyzed the published data of the mouse p53 core domain tetramer covalently-linked to a DNA duplex, where the central A/T doublets (underlined) of each of the two contiguous half-sites (GAGCATGCTCGAGCATGCTC) were modeled as WC base pairs21. Our analysis, described in the Supplementary Methods and Supplementary Fig. 8, demonstrates that a large fraction (greater than 50%) of the A/T base-pair doublets at the center of each half-site adopt the Hoogsteen geometry. The trapping of both forms in this crystal structure compared to a single form in type-II structures, is likely to result from changes in the base sequence between the two, as well as from the relatively small inter-dimer interface in the “forced” tetramer (~715 Å2). The latter is probably affected by the conformational deflection of the flexible L1 loop toward the interface imposed by the linker chain21.
In the recently published crystal structure of a p53 core-domain tetramer bound to DNA with contiguous half-sites, the central A/T base pairs of each half-site are in the standard WC geometry22. However, there are a number of distinct differences between that structure and the one reported here that appear to be related to the specific DNA sequence used: AGGCATGCCTAGGCATGCCT in the study of Chen et al.22 and GGGCATGCCCGGGCATGCCC as reported here. For example, it is possible that the difference in sequence affects the base-pairing geometry of the central A/T doublet. The presence of a TpA step between the two half-sites in one sequence and a GC rich region in the other may allow the DNA to assume alternative conformations that maintain the overall integrity of the complex. In addition, the relative arrangement of the two dimers on the double helix which depends on the DNA conformation is different in the two cases. As a result, inter-dimer interfaces vary between the two complexes in terms of surface area and specific interactions (compare Fig. 4, Supplementary Fig. 3 and Supplementary Table 1 with Fig. 5 by Chen et al22). These differences may have thermodynamic consequences and indeed, we have previously found that the protein-DNA binding affinity of the complex used in the other study is considerably lower than that of the complex used here19. Thus, small changes in DNA sequence are reflected in different energetic constraints that might well favor one base pairing geometry over another. This is consistent with the apparent equilibrium between WC and Hoogsteen base pairs discussed above for the covalently-linked DNA duplex. Another possible source of the geometrical changes between the two structures is that they are influenced by end effects, as only 18 base pairs were resolved in the crystal structure reported by Chen et al.22 in comparison to fully-resolved full-length binding sites observed in the present study.
Role of DNA shape and electrostatics in p53-DNA recognition
As described above, the 3-D architecture of the p53–DNA tetramer varies from type-I to type-II mainly depending on whether the spacer sequence between half-sites contains two or zero base pairs, respectively. Yet, the protein-DNA contacts formed by residues from the loop-sheet-helix motif (L1, S10 and H2) and the L3 loop are essentially identical in the two complexes. Even the drastic change in the base-pairing geometry at the central A/T base pairs, from Watson-Crick in type-I to Hoogsteen in type-II, does not appear to affect the recognition pattern in terms of direct protein-DNA interactions. This is because the two A/T base pairs at the center of each half-site do not participate in direct interactions with the protein. The only protein-DNA contacts involving nucleotides that form Hoogsteen base pairs are made between the symmetrically-disposed Arg273 side chains from each core-domain molecule and the thymidine phosphate of each strand. As in type-I complexes, these interactions are further buttressed by an extensive network of hydrogen bonds and salt bridges involving the side chains of Arg273, Asp281 and Arg280 and a highly ordered water molecule19.
The minor groove provides the interaction sites for Arg248, the most frequently mutated residue in human cancer13. In type-I complexes, the Arg248 side chains exhibit variable conformations while their interactions with the groove is mostly mediated by water molecules19. The Arg248 residues in type-II complexes display a single conformation and interact via water molecules with the DNA backbone (Supplementary Fig. 5). Arg248 is located in narrow regions of the minor groove, which correspond to minima in electrostatic potential (Fig. 7). As shown above, the Hoogsteen base pairs are associated with distinct narrowing of the minor groove in the regions flanking the central CATG element of each half-site (Fig. 6b). Hoogsteen base pairing leads to a displacement of the DNA backbone toward the minor groove because the preservation of base pairing and stacking interactions requires a different position of the glycosidic bond and the attached backbone than when WC base pairs are present (Figs. 5a–d). This effect appears to account for the observed minor groove narrowing which is then stabilized through interactions with Arg248 side chains.
Figure 7.

Recognition of DNA shape and electrostatic potential by Arg248 residues in type-II complexes. (a) The Hoogsteen geometry of the two central A/T base pairs in each half site leads to narrow minor groove regions (blue plot) at the ends of the CATG elements. Groove narrowing results in enhanced negative electrostatic potential (red plots) aligned with the binding sites of the Arg248 side chains. (b) The electrostatic potential mapped onto the molecular surface of one half-site of the binding site (negative potential in red, positive potential in blue). In addition, a red mesh indicates the isoelectrostatic surface at −5 kT e−1. As highlighted by green arrows, the mesh reaches outward the minor groove in the narrow regions, close to the binding sites for the positively charged Arg248 side chains.
These findings extend our recent observations that arginines are frequently located in minima in minor groove width that are associated with the presence of short A-tracts26. Hoogsteen base pairs apparently offer another means of generating this type of stabilizing interaction, although the source of the narrowing is very different than the one identified previously. What the two mechanisms have in common is the relationship between DNA shape and electrostatic potential. Indeed a decomposition of the electrostatic potential in the minor groove of type-II complexes identifies the geometric arrangement of the phosphate groups as the dominant factor influencing the magnitude of the potential (Supplementary Fig. 6).
The presence of local minima in potential where the four Arg248 residues are located, suggests that the specific shape induced by the Hoogsteen base pairing may play a role in positioning the p53 monomers on the DNA. In addition to the postulated effects on positioning, it seems clear that Arg248 mutations will considerably reduce p53-DNA binding affinities, explaining the frequent observation of Arg248 mutations in human tumors13.
DISCUSSION
In this paper we present high-resolution crystal structures of self-assembled complexes between the core-domain of human p53 and its consensus DNA targets where the two decameric half-sites are contiguous. In our previous studies the two half-sites were separated by two base pairs. In both cases, four p53 molecules self-assemble on two B-DNA half-sites to form a tetramer which is a dimer of dimers. However, the 3-D architecture of the form reported here, referred to as a type-II complex, is distinctly different from the previously discovered, type-I form. The differences are due to the specific configuration and the particular shape of the DNA binding site. Whereas in type-II structures the DNA helix is straight, a large deformation at the junction between half-sites is observed in type-I complexes. This deformation brings the attached dimers into close proximity, thereby facilitating inter-dimer protein-protein interactions which contribute to the stability and cooperativity of the tetrameric complex19. However, this inter-dimer interface is much smaller than that of type-II complexes where the two dimers are parallel to each other due to the contiguous arrangement of the half-sites. Establishing as large an interface in type-I complexes as seen in type-II complexes would require a much larger deformation of the DNA at a much greater energy cost whose magnitude will depend on the intrinsic structure and flexibility of the specific DNA sequence. This provides an explanation of the effect of the DNA spacer in lowering the observed binding affinity and stability of type-I complexes in comparison to complexes with a contiguous configuration of the same DNA half-sites19
Although the direct contacts between the protein and the DNA are essentially identical in both cases, type-II complexes exhibit novel structural features, of which the most remarkable is the non-canonical Hoogsteen base-pair geometry displayed by the A/T base pairs at the center of each half-site. The propensity of A/T and G/C base pairs to adopt the Hoogsteen geometry has been demonstrated in other protein-DNA complexes27–31. In two complexes, the TATA box bound to TBP28 and the DNA bound to IHF27, Hoogsteen base pairs are associated with unusually large DNA deformations. In the case of the replication complex of DNA polymerase iota, the enzyme is ‘specialized’ for recognizing Hoogsteen base-pairing30,31. In one of our previously determined type-I p53-DNA complexes, two A/T base pairs between the two decameric half-sites and hence not involved in DNA binding, displayed Hoogsteen geometry19. The only previous example where a Hoogsteen base pair is observed in undistorted B-DNA is a binding site of the MATα2 homeodomain, where a single A/T base pair has a Hoogsteen geometry29. The type-II complexes reported here represent the first example in which several Hoogsteen base pairs are observed within a transcription factor binding site that is part of an essentially undistorted B-DNA helix. Moreover, they are found to playa key role in modulating the DNA shape and thus the quaternary structure and energetics of the corresponding complexes.
Hoogsteen base pairs are not frequently observed in B-DNA although the propensity of A/T base pairs to adopt this geometry was shown by several crystal structures of free DNA fragments that contain sequences of alternating A and T bases32,33. However, this conformation appeared to be induced by crystal packing interactions of the free DNA fragments because NMR studies of (dA-dT)n fragments (n=3,4,5) indicated that the Watson-Crick geometry was the dominant one in solution32. Hence, there must be a force driving the A/T pairs to assume this conformation in their complexes with p53. This would appear to be provided by the large increase in protein-protein interactions among the four core domains of type-II tetramers that is enabled by the DNA sequence (zero spacer) and conformation formed when the two central base pairs assume a Hoogsteen geometry. Thus, the observed higher affinity and stability of p53 complexes with DNA targets that contain contiguous half-sites relative to those with inserted two base pairs between the same half-sites19 appear to be caused by both the enhanced protein-protein and protein-DNA interactions observed in Type-II complexes.
In type-II p53-DNA complexes, Hoogsteen base pairing affects the shape of the DNA binding site and, specifically, generates four narrow minor groove regions which are distributed over the two half-sites. These in turn are responsible for the presence of enhanced negative electrostatic potentials which are recognized by Arg248 side chains. The correlation between DNA shape and minor groove electrostatics is a newly identified protein-DNA readout mechanism that is employed by Hox proteins34 and other protein families26,35. p53 uses a similar mechanism for positioning its Arg248 side chains and for stabilizing its interactions with DNA. However, in contrast to previously described systems, variations in the DNA shape of the present complexes are driven by the altered base-pairing geometry rather than sequence-dependent narrowing of the minor groove.
The use of Hoogsteen base pairs in protein-DNA recognition extends the array of base and shape recognition mechanisms that are available for the readout of DNA sequence (see review by Rohs et al.35). The extension of the four letter alphabet of Watson-Crick base pairs by Hoogsteen base pairs is apparently used by p53 in recognizing, in a differential manner, a wide range of DNA response elements. Based on the crystal structures reported here and comparisons with other structures described above, the relative predisposition of A/T doublets to adopt the Hoogsteen geometry in the context of CATG, a sequence motif that is abundant in natural p53 response elements7, is probably higher in DNA targets with contiguous half-sites than in others. It is noteworthy that in a series of binding experiments performed with natural p53 binding sites, several p53 response elements implicated in cell-cycle arrest and DNA repair that contain contiguous half-sites with CATG core elements were among the highest binding affinity sites. Conversely, apoptosis-related response elements containing CATG elements or other A/T combinations, but with one or two base-pair inserts between half-sites, were among the lowest binding affinity sites15. The structural and energetic basis of the CATG preference for the non-canonical base-pairing geometry and the effect of the flanking bases are still unclear. Additionally, it still remains to be seen which pairing schemes are likely to be employed by the less common A/T rich doublets such as AA, TT or TA. It is very likely that such doublets or those mixed with G/C pairs at the center of each half-site will lead to diverse DNA shapes and electrostatic patterns, thereby further expanding the repertoire of readout mechanisms by p53. The growing complexity of p53 function discovered in recent years36, may thus be associated, at least in part, with the growing diversity in its DNA recognition modes.
Methods
Methods and any associated references are available in the online version of the paper at http://www.nature.com/nsmb/.
Accession codes. Protein Data Bank: Coordinates and structure factors for the three p53/DNA complexes have been deposited with the accession codes 3IGK, 3IGL and 3KZ8.
Note: Supplementary Information is available on the Nature Structural & Molecular Biology website.
Supplementary Material
Figure 8.
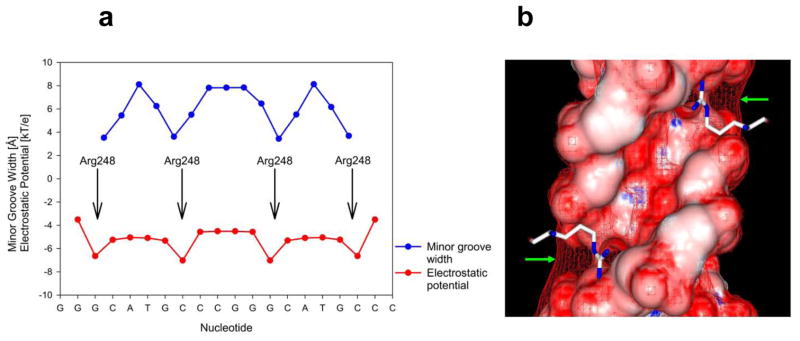
Figure 9.

Acknowledgments
The work was supported by grants from the Kimmelman Center for Biomolecular Structure and Assembly, the EC (FP6) program, the German-Israeli Foundation (GIF) for Scientific Research & Development and the Minerva Foundation with funding from the Federal German Ministry of Education and Research (Z.S.), and the NIH grant U54 CA121852 (B.H.). Z.S. holds the Helena Rubinstein Professorial chair in Structural Biology. We thank our colleagues Yaacov Halfon, Amir Eldar and Yael Diskin-Posner for help and the staff at ESRF (Grenoble) for facilitating X-ray data collection.
Footnotes
Authors contributions
M.K, H.R. O.S. and D.R. performed the X-ray crystallographic work. R.R. performed the computational work; M.K., H.R., R.R., B.H. and Z.S. contributed to the writing of the paper.
References
- 1.Vogelstein B, Lane D, Levine AJ. Surfing the p53 network. Nature. 2000;408:307–310. doi: 10.1038/35042675. [DOI] [PubMed] [Google Scholar]
- 2.Vousden KH, Lu X. Live or let die: the cell’s response to p53. Nat Rev Cancer. 2002;2:594–604. doi: 10.1038/nrc864. [DOI] [PubMed] [Google Scholar]
- 3.Oren M. Decision making by p53: life, death and cancer. Cell Death Differ. 2003;10:431–42. doi: 10.1038/sj.cdd.4401183. [DOI] [PubMed] [Google Scholar]
- 4.Laptenko O, Prives C. Transcriptional regulation by p53: one protein, many possibilities. Cell Death Differ. 2006;13:951–61. doi: 10.1038/sj.cdd.4401916. [DOI] [PubMed] [Google Scholar]
- 5.El-Deiry WS, Kern SE, Pietenpol JA, Kinzler KW, Vogelstein B. Definition of a consensus binding site for p53. Nature Gen. 1992;1:45–49. doi: 10.1038/ng0492-45. [DOI] [PubMed] [Google Scholar]
- 6.Funk WD, Pak DT, Karas RH, Wright WE, Shay JW. A transcriptionally active DNA binding site for human p53 protein complexes. Mol Cell Biol. 1992;12:2866–2871. doi: 10.1128/mcb.12.6.2866. [DOI] [PMC free article] [PubMed] [Google Scholar]
- 7.Wei CL, et al. A global map of p53 transcription-factor binding sites in the human genome. Cell. 2006;124:207–19. doi: 10.1016/j.cell.2005.10.043. [DOI] [PubMed] [Google Scholar]
- 8.Friedman PN, Chen X, Bargonetti J, Prives C. The p53 protein is an unusually shaped tetramer that binds directly to DNA. Proc Natl Acad Sci U S A. 1993;90:3319–23. doi: 10.1073/pnas.90.8.3319. [DOI] [PMC free article] [PubMed] [Google Scholar]
- 9.Weinberg RL, Veprintsev DB, Fersht AR. Cooperative binding of tetrameric p53 to DNA. J Mol Biol. 2004;341:1145–59. doi: 10.1016/j.jmb.2004.06.071. [DOI] [PubMed] [Google Scholar]
- 10.Ko J, Prives C. p53: puzzle and paradigm. Genes Dev. 1996;10:1054–1072. doi: 10.1101/gad.10.9.1054. [DOI] [PubMed] [Google Scholar]
- 11.Levine AJ. p53, the cellular gatekeeper for growth and division. Cell. 1997;88:323–331. doi: 10.1016/s0092-8674(00)81871-1. [DOI] [PubMed] [Google Scholar]
- 12.May P, May E. Twenty years of p53 research: structural and functional aspects of the p53 protein. Oncogene. 1999;18:7621–7636. doi: 10.1038/sj.onc.1203285. [DOI] [PubMed] [Google Scholar]
- 13.Olivier M, et al. The IARC TP53 database: new online mutation analysis and recommendations to users. Hum Mutat. 2002;19:607–14. doi: 10.1002/humu.10081. [DOI] [PubMed] [Google Scholar]
- 14.Qian H, Wang T, Naumovski L, Lopez CD, Brachmann RK. Groups of p53 target genes involved in specific p53 downstream effects cluster into different classes of DNA binding sites. Oncogene. 2002;21:7901–7911. doi: 10.1038/sj.onc.1205974. [DOI] [PubMed] [Google Scholar]
- 15.Weinberg RL, Veprintsev DB, Bycroft M, Fersht AR. Comparative binding of p53 to its promoter and DNA recognition elements. J Mol Biol. 2005;348:589–96. doi: 10.1016/j.jmb.2005.03.014. [DOI] [PubMed] [Google Scholar]
- 16.Tokino T, et al. p53 tagged sites from human genomic DNA. Hum Mol Genet. 1994;3:1537–42. doi: 10.1093/hmg/3.9.1537. [DOI] [PubMed] [Google Scholar]
- 17.Joerger AC, Fersht AR. Structural biology of the tumor suppressor p53. Annu Rev Biochem. 2008;77:557–82. doi: 10.1146/annurev.biochem.77.060806.091238. [DOI] [PubMed] [Google Scholar]
- 18.Cho Y, Gorina S, Jeffrey PD, Pavletich NP. Crystal structure of a p53 tumor suppressor-DNA complex: understanding tumorigenic mutations. Science. 1994;265:346–355. doi: 10.1126/science.8023157. [DOI] [PubMed] [Google Scholar]
- 19.Kitayner M, et al. Structural basis of DNA recognition by p53 tetramers. Mol Cell. 2006;22:741–53. doi: 10.1016/j.molcel.2006.05.015. [DOI] [PubMed] [Google Scholar]
- 20.Ho WC, Fitzgerald MX, Marmorstein R. Structure of the p53 core domain dimer bound to DNA. J Biol Chem. 2006;281:20494–502. doi: 10.1074/jbc.M603634200. [DOI] [PubMed] [Google Scholar]
- 21.Malecka KA, Ho WC, Marmorstein R. Crystal structure of a p53 core tetramer bound to DNA. Oncogene. 2009;28:325–33. doi: 10.1038/onc.2008.400. [DOI] [PMC free article] [PubMed] [Google Scholar]
- 22.Chen Y, Dey R, Chen L. Crystal structure of the p53 core domain bound to a full consensus site as a self-assembled tetramer. Structure. 2010;18:246–56. doi: 10.1016/j.str.2009.11.011. [DOI] [PMC free article] [PubMed] [Google Scholar]
- 23.Hoogsteen K. The crystal and molecular structure of a hydrogen-bonded complex between 1-methylthymine and 9-methyladenine. Acta Crystallogr. 1963;16:907–916. [Google Scholar]
- 24.Suad O, et al. Structural basis of restoring sequence-specific DNA binding and transactivation to mutant p53 by suppressor mutations. J Mol Biol. 2009;385:249–65. doi: 10.1016/j.jmb.2008.10.063. [DOI] [PubMed] [Google Scholar]
- 25.Dehner A, et al. Cooperative Binding of p53 to DNA: Regulation by Protein-Protein Interactions through a Double Salt Bridge. Angew Chem Int Ed Engl. 2005;44:5247–5251. doi: 10.1002/anie.200501887. [DOI] [PubMed] [Google Scholar]
- 26.Rohs R, et al. The role of DNA shape in protein-DNA recognition. Nature. 2009;461:1248–53. doi: 10.1038/nature08473. [DOI] [PMC free article] [PubMed] [Google Scholar]
- 27.Rice PA, Yang S, Mizuuchi K, Nash HA. Crystal structure of an IHF-DNA complex: a protein-induced DNA U-turn. Cell. 1996;87:1295–306. doi: 10.1016/s0092-8674(00)81824-3. [DOI] [PubMed] [Google Scholar]
- 28.Patikoglou GA, et al. TATA element recognition by the TATA box-binding protein has been conserved throughout evolution. Genes Dev. 1999;13:3217–30. doi: 10.1101/gad.13.24.3217. [DOI] [PMC free article] [PubMed] [Google Scholar]
- 29.Aishima J, et al. A Hoogsteen base pair embedded in undistorted B-DNA. Nucleic Acids Res. 2002;30:5244–52. doi: 10.1093/nar/gkf661. [DOI] [PMC free article] [PubMed] [Google Scholar]
- 30.Nair DT, Johnson RE, Prakash S, Prakash L, Aggarwal AK. Replication by human DNA polymerase-iota occurs by Hoogsteen base-pairing. Nature. 2004;430:377–80. doi: 10.1038/nature02692. [DOI] [PubMed] [Google Scholar]
- 31.Nair DT, Johnson RE, Prakash L, Prakash S, Aggarwal AK. Human DNA polymerase iota incorporates dCTP opposite template G via a G.C + Hoogsteen base pair. Structure. 2005;13:1569–77. doi: 10.1016/j.str.2005.08.010. [DOI] [PubMed] [Google Scholar]
- 32.Abrescia NG, Gonzalez C, Gouyette C, Subirana JA. X-ray and NMR studies of the DNA oligomer d(ATATAT): Hoogsteen base pairing in duplex DNA. Biochemistry. 2004;43:4092–100. doi: 10.1021/bi0355140. [DOI] [PubMed] [Google Scholar]
- 33.De Luchi D, Tereshko V, Gouyette C, Subirana JA. Structure of the DNA coiled coil formed by d(CGATATATATAT) Chembiochem. 2006;7:585–7. doi: 10.1002/cbic.200500449. [DOI] [PubMed] [Google Scholar]
- 34.Joshi R, et al. Functional specificity of a Hox protein mediated by the recognition of minor groove structure. Cell. 2007;131:530–43. doi: 10.1016/j.cell.2007.09.024. [DOI] [PMC free article] [PubMed] [Google Scholar]
- 35.Rohs R, et al. Origins of specificity in protein-DNA recognition. Annu Rev Biochem. 2010 doi: 10.1146/annurev-biochem-060408-091030. in press. [DOI] [PMC free article] [PubMed] [Google Scholar]
- 36.Vousden KH, Prives C. Blinded by the Light: The Growing Complexity of p53. Cell. 2009;137:413–31. doi: 10.1016/j.cell.2009.04.037. [DOI] [PubMed] [Google Scholar]
- 37.Otwinowski Z, Minor W. Processing of X-ray diffraction data collected in oscillation mode. Macromolecular Crystallography. 1997;276(Pt A):307–326. doi: 10.1016/S0076-6879(97)76066-X. [DOI] [PubMed] [Google Scholar]
- 38.Brunger AT, et al. Crystallography & NMR system: A new software suite for macromolecular structure determination. Acta Crystallogr D Biol Crystallogr. 1998;54:905–921. doi: 10.1107/s0907444998003254. [DOI] [PubMed] [Google Scholar]
- 39.Brunger AT. Version 1.2 of the Crystallography and NMR system. Nature Protocols. 2007;2:2728–2733. doi: 10.1038/nprot.2007.406. [DOI] [PubMed] [Google Scholar]
- 40.Vagin A, Teplyakov A. MOLREP: an automated program for molecular replacement. J Appl Crystallogr. 1997;30:1022–1025. [Google Scholar]
- 41.Collaborative Computational Project. Number 4. The CCP4 suite: programs for protein crystallography. Acta Crystallogr D Biol Crystallogr. 1994;50:760–3. doi: 10.1107/S0907444994003112. [DOI] [PubMed] [Google Scholar]
- 42.Murshudov GN, Vagin AA, Dodson EJ. Refinement of macromolecular structures by the maximum-likelihood method. Acta Crystallogr D Biol Crystallogr. 1997;53:240–55. doi: 10.1107/S0907444996012255. [DOI] [PubMed] [Google Scholar]
- 43.Emsley P, Cowtan K. Coot: model-building tools for molecular graphics. Acta Crystallogr D Biol Crystallogr. 2004;60:2126–32. doi: 10.1107/S0907444904019158. [DOI] [PubMed] [Google Scholar]
- 44.Laskowski RA, Macarthur MW, Moss DS, Thornton JM. Procheck -a Program to Check the Stereochemical Quality of Protein Structures. J Appl Crystallogr. 1993;26:283–291. [Google Scholar]
- 45.DeLano WL. The PyMOL Molecular Graphics System. San Carlos, CA, USA: 2002. [Google Scholar]
- 46.Lavery R, Sklenar H. Defining the structure of irregular nucleic acids: conventions and principles. J Biomol Struct Dyn. 1989;6:655–67. doi: 10.1080/07391102.1989.10507728. [DOI] [PubMed] [Google Scholar]
- 47.Rocchia W, et al. Rapid grid-based construction of the molecular surface and the use of induced surface charge to calculate reaction field energies: applications to the molecular systems and geometric objects. J Comput Chem. 2002;23:128–37. doi: 10.1002/jcc.1161. [DOI] [PubMed] [Google Scholar]
- 48.Cornell WD, et al. A 2nd Generation Force-Field for the Simulation of Proteins, Nucleic-Acids, and Organic-Molecules. Journal of the American Chemical Society. 1995;117:5179–5197. [Google Scholar]
Associated Data
This section collects any data citations, data availability statements, or supplementary materials included in this article.