Abstract
Multiplet-filtered and gradient-selected heteronuclear zero-quantum coherence (gsHZQC) TROSY experiments are described for measuring 1H–13C correlations for 13CH3 methyl groups in proteins. These experiments provide improved suppression of undesirable, broad outer components of the heteronuclear zero-quantum multiplet in medium-sized proteins, or in flexible sites of larger proteins, compared to previously described HZQC sequences (Tugarinov et al. in J Am Chem Soc 126:4921–4925, 2004; Ollerenshaw et al. in J Biomol NMR 33:25–41, 2005). Hahn-echo versions of the gsHZQC experiment also are described for measuring zero- and double-quantum transverse relaxation rate constants for identification of chemical exchange broadening. Application of the proposed pulse sequences to Escherichia coli ribonuclease HI, with a molecular mass of 18 kD, indicates that improved multiplet suppression is obtained without substantial loss of sensitivity.
Keywords: Methyl, TROSY, Zero-quantum, HZQC, HMQC, RNase H
Introduction
Increased sensitivity of the HMQC pulse sequence, relative to the HSQC experiment, for the study of 1H–13C correlations in fully protonated methyl groups, termed the methyl-TROSY effect, has been demonstrated by Kay and coworkers (Tugarinov et al. 2003; Ollerenshaw et al. 2003; Korzhnev et al. 2004). Additional line narrowing is obtained by selective recording of heteronuclear zero-quantum coherence (HZQC), rather than mixing zero- and double-quantum signals, as in the HMQC experiment (Tugarinov et al. 2004; Tugarinov and Kay 2004; Ollerenshaw et al. 2005). Current HZQC sequences rely upon differential relaxation during the t1 evolution period to suppress the outer components, represented by the spin operators , where i, j, k ∈ {1, 2, 3} and i ≠ j ≠ k, relative to the desired central component, , of the 13C–1H zero-quantum multiplet. Consequently, suppression is imperfect for methyl groups in medium sized proteins and in flexible regions of large proteins. To address this issue, gradient-selected HZQC pulse sequences have been developed in which the signals from the respective outer multiplet components are removed via a methyl multiplet filter. The sequences are validated using U-[2H, 15N], Ile δ1-[13C1H3], Leu δ-[13C1H3], Val γ-[13C1H3] ribonuclease HI (RNase H) from E. coli.
Methods
Protein expression and purification
Escherichia coli strain BL21(DE3) was transformed with a plasmid containing E. coli ribonuclease HI (RNase H) under control of a T7lac promoter (Hollien and Marqusee 1999; Mandel et al. 1995). The cells were grown in 1 L of M9 minimal media containing 99% 2H2O, 15N-ammonium chloride, and 98% 2H7-glucose to OD600 = 0.7. Selective [13C 1H3]-labeling of Ile-δ1 and stereospecific labeling of Val/Leu-γ were achieved by supplementing the growth media with 80 mg/L of 2-keto-3-methyl-2H3-3-2H-4-13C butyric acid (99% 13C, 98% 2H, Cambridge Isotopes) and 50 mg/L of 2-keto-3-2H2-4-13C-butyric acid (99% 13C, 98% 2H, Sigma Aldrich) an hour before induction (Goto et al. 1999; Gardner and Kay 1997). Induction of protein expression and purification proceeded as described (Yang et al. 1990; Mandel et al. 1995; Kroenke et al. 1998).
NMR spectroscopy
NMR samples were 250 µM protein in 100 mM 2H3-sodium acetate, pH 5.5 in 99% 2H2O. Spectra were acquired at 18.8 and 21.1 T on Bruker Avance spectrometers equipped with triple resonance z-axis gradient cryoprobes. Sample temperature was calibrated to 283 K using 98% 2H4-methanol as previously described (Findeisen et al. 2007). Spectra were recorded with 4 transients per free-induction decay (16 transients per t1 point) and 4,096 × 1,536 (t2 × t1) points. Spectral widths were 9.8 × 4.4 kHz or 10.8 × 5.6 kHz (t2 × t1) for 18.8 and 21.1 T, respectively. The 1H and 13C radiofrequency carriers were set to 2.0 ppm (after presaturation of the water resonance) and 19.5 ppm. Multipart experiments were acquired with identical t1 points interleaved.
Relaxation data were acquired at 14.1 T on Bruker DRX600 console equipped with a triple resonance z-axis gradient cryoprobe. Spectra were recorded using 8 scans per t1 increment and 4,096 × 640 points for t2 × t1. The spectral width was 7.2 × 3.8 kHz. Relaxation delays (T) were set to n/(2JCH) where n = {1, 10, 25, 40}. Relaxation rates were determined for duplicate data sets and subsequently averaged.
Data processing
Spectra were processed using NMRPipe (Delaglio et al. 1995). To preserve lineshape features, data used for analysis were processed without further apodization in either dimension. Peak assignments were made using known chemical shifts (Yamazaki et al. 1993; Butterwick et al. 2004). Peak fitting was performed in NMRPipe. Relaxation rates were determined by fitting the parameters of a monoexponential decay to peak heights using in-house Python scripts.
Results and discussion
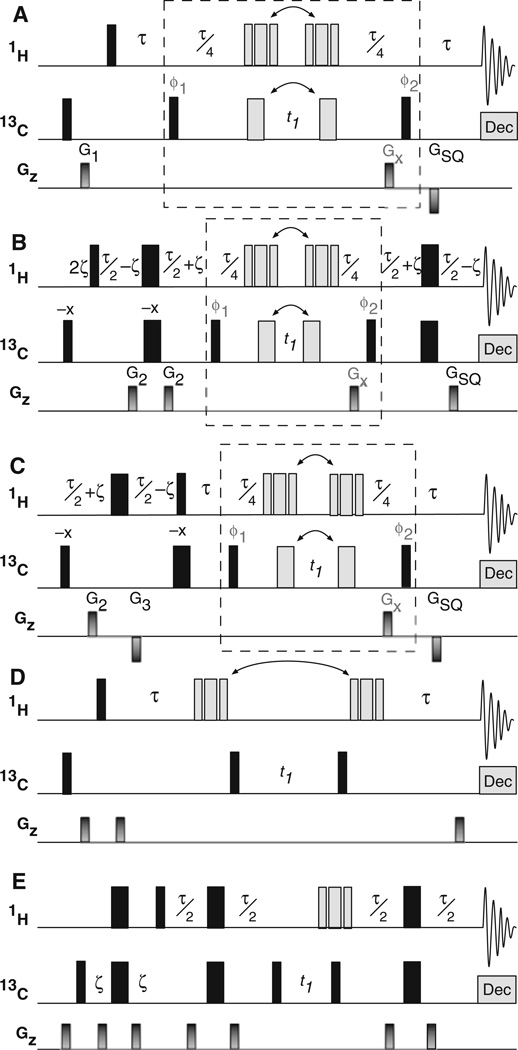
Three versions of the gradient-selected HZQC (gsHZQC) experiment are shown in Fig. 1a–c. The basic pulse sequence shown in Fig. 1a utilizes only magnetization originating on the 1H spins and actively suppresses magnetization from the natural 13C polarization. Inclusion of the methyl multiplet filter in this sequence adds an additional 13C inversion pulse (Fig. 1a, gray) and two delays of length τ/4 = 1/(8JCH) (≈ 2.0 ms, total), relative to the original HZQC experiment (Tugarinov et al. 2004) (Fig. 1d). The versions of the experiment shown in Fig. 1b and c illustrate two methods for constructive utilization of the natural 13C polarization. The sequence depicted in Fig. 1b is similar to the scheme proposed by Ollerenshaw and coworkers (Ollerenshaw et al. 2005) (Fig. 1e), but contains one fewer 1H inversion pulse. The alternative approach depicted in Fig. 1c contains one fewer 1H and one fewer 13C inversion pulse compared to Fig. 1b; however 13C magnetization is placed in the transverse plane for a time period τ−2ζ(≈ 2.41 ms) longer and 1H magnetization is inverted for a time period τ/2−ζ (≈ 1.2 ms) compared to Fig. 1b. The relative sensitivity of these two enhancement methods is discussed below.
Fig. 1.
Comparison of gradient selected pulse sequences for measuring 1H–13C heteronuclear zero-quantum coherences (gsHZQC) to previously proposed HZQC schemes (Tugarinov et al. 2004; Ollerenshaw et al. 2005). a A simple implementation of the gsHZQC experiment. The dashed box denotes four distinct parts of the pulse sequence: two for inversion of the outer multiplet components and two for echo/antiecho frequency discrimination during t1. These alterations are achieved by a pulse sequence element in which the positions of the composite 1H (90x–180y–90x) and 180° 13C pulses flanking t1 (gray bars) are shifted (see Fig. 2). The phases φ1 and φ2 are given in Fig. 2 for the first step of the phase cycle. The 90° 13C pulse labeled φ1 and the receiver are inverted on alternate scans for isotope filtration. All other pulse phases are {x}. Weak presaturation was used to suppress the water resonance. WALTZ-16 (Shaka et al. 1983) was used for 13C decoupling during t2. G1 = (1 ms, 7 G/cm), GSQ = (500 µs, −22.5 G/cm), GZQ = (500 µs, 30 G/cm), GDQ = (500 µs, 18 G/cm), and τ = 1/(2JCH) ≈ 3.91 ms. b and c gsHZQC pulse sequences with signal enhancement using natural 13C polarization. The pulse train for 13C begins on {−x} and inverts with the isotope filter. G2 = (500 µs, 5 G/cm), G3 = (500 µs, −5 G/cm) and 2ζ = 1.5 ms (corresponding to sin(2πJCHζ) = 3−1/2). For (B), GSQ = (500 µs, 22.5 G/cm). Pulse sequences and parameter sets suitable for Bruker spectrometers are provided for (a–c) in supplementary material. d Previous HZQC pulse sequence by Tugarinov and coworkers (Tugarinov et al. 2004) that utilizes 1H magnetization and differential relaxation rates to eliminate signal from outer multiplet components. e An unfiltered HZQC experiment by Ollerenshaw and coworkers (Ollerenshaw et al. 2005) that includes 13C polarization enhancement. The delays, τ and ζ, are the same as in (a) and (b), respectively. Gradient strengths and pulse phases for (d) and (e) are as described previously (Tugarinov et al. 2004; Ollerenshaw et al. 2005)
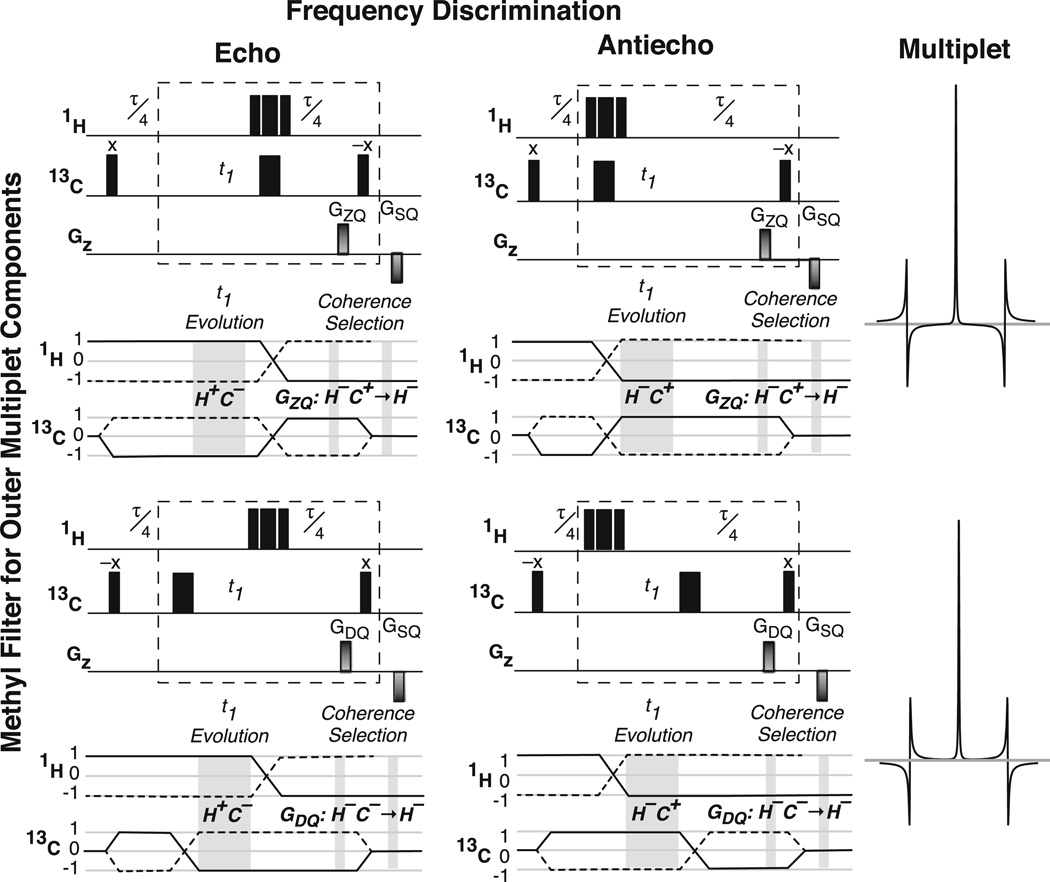
The methyl multiplet filter has no effect (other than relaxation losses) when applied to the spin operators representing the center band of the zero-quantum multiplet, . In contrast, the outer multiplet components, , acquire phase factors of exp(−iπ/2) and exp(iπ/2), respectively, from evolution under the 1JCH scalar coupling Hamiltonian during the filter. Accordingly, the outer components are dispersive relative to the center component and 180° out of phase with respect to each other. Dividing the filter around the t1 delay allows the composite 1H inversion pulse (Fig. 1a–c, gray) to both refocus 1H chemical shift evolution during the filter and control echo/antiecho frequency discrimination (see below), thereby reducing the number of required 1H inversion pulses by one. Elimination of the undesirable components is achieved by addition of successive data sets in which the phases of the outer components are inverted by alternating the position of the 13C inversion pulse (Fig. 1a–c, gray). Collectively, the filter and echo/antiecho frequency discrimination require the generation of four free-induction decays for each t1 point, which can be understood by considering a 2 × 2 matrix (Fig. 2) in which the columns generate echo/anti-echo hypercomplex pairs and the rows generate outer multiplet components with alternating phases. The data corresponding to the rows in Fig. 2 are added to suppress the multiplet components, after which the resulting two data sets are processed according to the Rance-Kay protocol (Cavanagh et al. 1991; Palmer et al. 1991; Palmer et al. 1992; Kay et al. 1992) to produce a frequency-discriminated two-dimensional spectrum.
Fig. 2.
The four parts of the gsHZQC experiment are depicted as a 2 × 2 grid in which rows denote inversion of the outer multiplet components and columns generate echo/antiecho data. Frequency discrimination is controlled by placing the composite 1H 180° pulse before or after the t1 evolution period, while the phase of the outer multiplet components is controlled by placement of the 13C 180° pulse. Due to variation in the position of the 1H and 13C 180° pulses, the encode gradient must select either zero- or double-quantum coherence (ZQ or DQ), as shown in the coherence level diagrams. For both 1H and 13C, the coherence pathways selected by the encode and decode gradients are shown as solid lines. The relative signs of the encode and decode gradients depict the coherence selection of the pulse sequences in Fig. 1a, c. The dashed boxes are consistent with those of Fig. 1
Gradient coherence selection is incorporated during the second half of the methyl multiplet filter (Figs. 1, 2). The coherence pathway diagrams shown below the pulse sequence elements in Fig. 2 illustrate the gradient selection scheme. When the 1H and 13C inversion pulses occur on the same side of the t1 interval (Fig. 2, top row) the first gradient must encode the zero-quantum (ZQ) frequency. When the two inversion pulses are on opposite sides of t1 (Fig. 2, bottom row), inversion of either the 1H or 13C coherence occurs after t1 and the first gradient must encode the double-quantum frequency (DQ). The decode gradient selects for 1H single-quantum magnetization in all cases.
The multiplet filtered sequences are longer by a time period τ/2 (≈ 2.0 ms), compared to the unfiltered versions. The sensitivity of the filtered sequences is reduced by (Iunf−Ifil)/Iunf = 1−[exp(−RZQ τ/2) + exp(−RDQ τ/2)]/2 ≈ RMQ τ/2, in which Iunf and Ifil are the peak intensities in the unfiltered and filtered spectra, respectively, and RMQ = (RDQ + RZQ)/2. The sensitivity loss is expected to be <7% for proteins with rotational diffusion times <70 ns (Tugarinov et al. 2004). Differential relaxation of the zero- and double-quantum coherence orders (ZQ vs. DQ) also creates a slight imbalance between the two halves of the filter, which could result in incomplete cancellation of the outer components. Because the length of the filter is short, differential relaxation is unlikely to be an issue with molecules for which the filter is necessary.
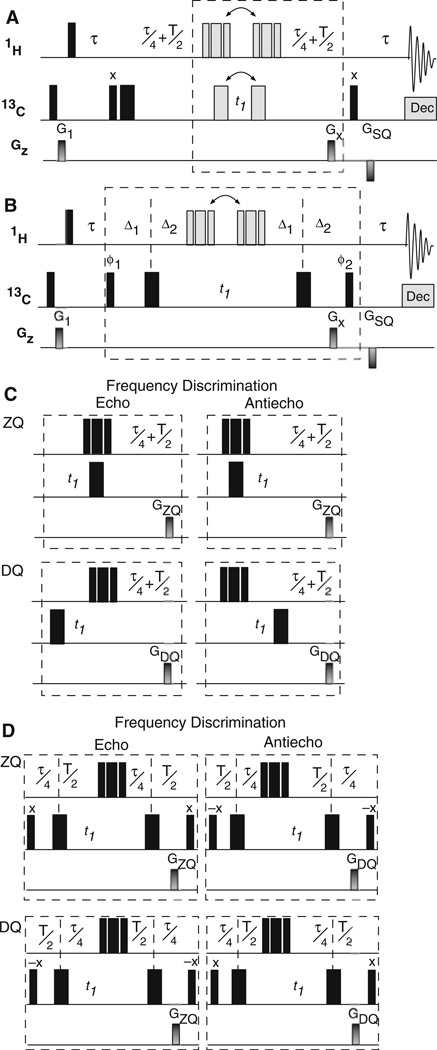
A Hahn-echo relaxation period (Rance and Byrd 1983; Davis 1989) for measurement of zero- (RZQ) and double-(RDQ) quantum relaxation rate constants is incorporated into the basic gsHZQC experiment in Fig. 3a, b. The pulse sequence in Fig. 3a utilizes an element similar to Fig. 2 except that alternating the position of the 13C inversion pulse selects either ZQ or DQ relaxation during the relaxation delay (T) (Fig. 3c). A second pulse sequence (Fig. 3b) is necessary to invert the phase of the outer multiplet components. In this sequence, the order of the delays for relaxation and multiplet filtration are alternated to select the desired coherence during T (Fig. 3d). To ensure the outer multiplet components have the correct relative phase during the two halves of the filter, T = n/(2JCH), where n is any integer ≥1. The 13C polarization enhancement schemes of Fig. 1b, c can be incorporated into the Hahn-echo sequences in a straightforward fashion.
Fig. 3.
Hahn-echo gsHZQC pulse sequences for measurement of multiple-quantum transverse relaxation rates. a In the first half of the methyl multiplet filter, ZQ or DQ coherence is selected during the relaxation period (T) using a pulse sequence element shown in part C and similar to Fig. 2. b In the second half of the multiplet filter, the phase of the outer multiplet components is inverted using a pulse sequence element shown in part D. c A grid similar to that in Fig. 2 describes the evolution of magnetization through the pulse sequence in (a). In this case, the rows correspond to the multiple quantum coherence (ZQ or DQ) present during the relaxation delay and only one phase of the outer multiplet components is considered. The coherence selection (ZQ or DQ) during the relaxation delay is controlled by alternating the position of the 13C 180° before and after t1. Frequency discrimination is obtained by shifting the position of composite 1H (90x–180y–90x) pulse. d Inversion of the outer multiplet component in the pulse sequence in part B is achieved by shifting the two 13C 180° pulses between the relaxation delay (T/2) and the multiplet filter delay (τ/4). The relaxation delay (T) is equal to n/(2JCH) where n is any integer ≥1. Gradient strengths, phase cycles, and delays are as described in Fig. 1, except that the second 13C 90° pulse is used for the isotope filter. GSQ = (500 µs, 22.5 G/cm) in (a) and (b)
The pulse sequences depicted in Fig. 3a, b measure pure ZQ or DQ relaxation rate constants. The desired coherence is always ZQ during t1, which maximizes sensitivity and resolution and ensures the peaks are located at the same frequency in the indirect dimension of each experiment. As before, the two halves of the multiplet filter are slightly imbalanced due to the differential relaxation rates for ZQ and DQ magnetization. When RZQ is measured, the desired coherence is ZQ during the two τ/4 delays for the first experiment (Fig. 3a, c) and DQ for the second experiment (Fig. 3b, d). The opposite is true for the experiment that measures RDQ. This imbalance does not affect the measured relaxation rate constants.
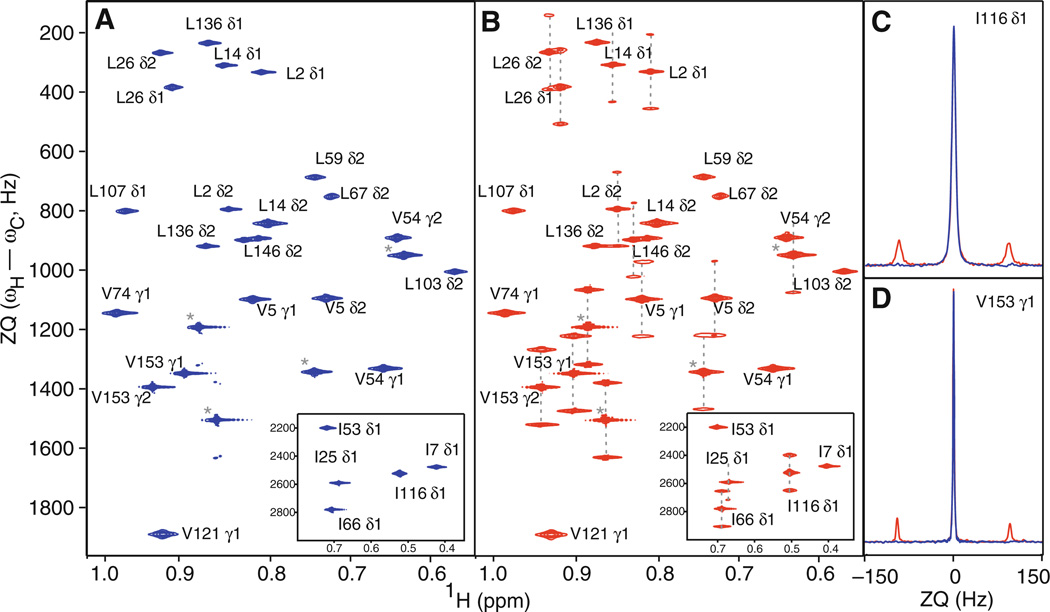
The methyl region of the 1H–13C HZQC spectrum of RNase H is greatly simplified when outer multiplet components are actively suppressed (Fig. 4a) using the pulse sequence of Fig. 1a, compared to the unfiltered spectrum (Fig. 4b) acquired using the sequence of Fig. 1d. Traces through the resonances of selected peaks are shown in Fig. 4c to illustrate the degree of multiplet suppression. Incorporation of the methyl multiplet filter in a non-13C polarization enhanced version of the gsHZQC results in slight sensitivity loss compared to the analogous HZQC by Tugarinov et al. (2004). Using the measured values of RZQ and RDQ (vide infra), the new experiment is expected to be ~3% less sensitive than the original unfiltered version, while an empirical value (4.0 ± 0.4)% (average of data acquired at 18.8 and 21.1 T) was determined for the spectra shown in Fig. 4. The 13C enhanced experiments in Fig. 1b, c were × and 13% more sensitive, respectively, than the unenhanced gsHZQC (Fig. 4b) when applied to RNase H. The increased sensitivity of the pulse sequence depicted in Fig. 1c reflects the detrimental effect of the additional 1H inversion pulses in the sequence of Fig. 1b. As protein size increases, relaxation losses during the longer 13C polarization transfer period in Fig. 1c will become more significant, and the experiment of Fig. 1b may become more sensitive.
Fig. 4.
Comparison of gsHZQC and unfiltered HZQC pulse sequences. a A gsHZQC (Fig. 1a) spectrum of selected Leu δ1 and δ2 and Val γ1 and γ2 resonances in the methyl region of RNase H. A region containing Ile δ1 resonances are shown in the inset. Unassigned peaks are marked with an asterisk. b An unfiltered HZQC (Fig. 1d, Tugarinov et al. 2004) spectrum of the same region. Dashed lines connect the outer multiplet components to the central component. Both (a) and (b) were collected at 21.1 T and contour levels have been normalized to their respective noise floors. c and d Comparison of traces along the t1 dimension of HZQC pulse sequences for I116 δ1 (c) and V153 γ1 (d). Colors are as in (a) and (b)
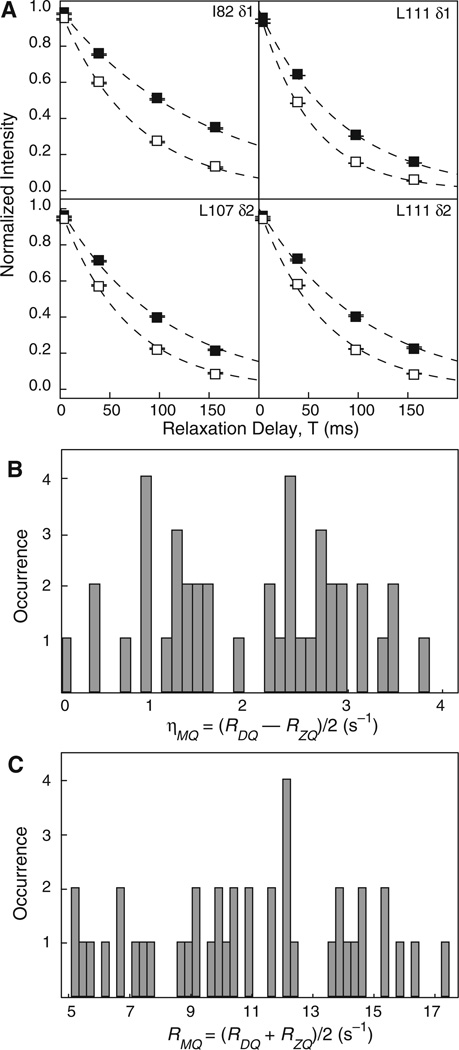
Multiple-quantum relaxation decay curves (RDQ and RZQ) measured using the Hahn-echo pulse sequences in Fig. 3a, b are shown for representative methyl groups in Fig. 5a. Histograms of ηMQ = (RDQ−RZQ)/2 (Fig. 5b) and RMQ = (RDQ + RZQ)/2 (Fig. 5c) are shown. The average values of the quantities are 2.0 ± 1.0 and 10.9 ± 3.3, respectively. The rate constant ηMQ depends upon cross-correlation effects between the methyl group and external 1H and 2H spins and chemical exchange broadening of zero- and double-quantum coherences (Tugarinov et al. 2004). The magnitude of ηMQ is consistent with previous studies indicating RNase H is not subject to significant line broadening due to chemical exchange at 283 K (Mandel et al. 1996).
Fig. 5.
Measurement of multiple-quantum transverse relaxation rates in RNase H. a Zero- and double-quantum relaxation profiles, RZQ (filled squares) and RDQ (open squares), are shown for selected residues. Dashed lines are the best fits of a monoexponential decay to the respective profiles. Peak intensities were normalized and averaged for display. Error bars are smaller than the plotted symbols and represent the error associated with the averaged data sets. The mean ± one standard deviation of RDQ and RZQ for two data sets are 13.3 ± 0.1 s−1 and 6.9 ± 0.1 s−1 for I82 δ1, 19.9 ± 0.1 s−1 and 13.0 ± 0.2 s−1 for L107 δ1, 17.7 ± 0.4 s−1 and 13.0 ± 0.2 s−1 for L111 δ1, and 18.9 ± 0.2 s−1 and 12.0 ± 0.1 s−1 for L111 δ2, respectively. b and c Histograms of ηMQ = (RDQ−RZQ)/2 and RMQ = (RDQ + RZQ)/2 for RNase H. The mean ± one standard deviation is ηMQ = 2.0 ± 1.0 s−1 for (b) and RMQ = 10.9 ± 2.2 s−1 for (c)
Conclusion
Multiplet-filtered and gradient-selected heteronuclear zero-quantum coherence (gsHZQC) experiments have been presented for recording 1H–13C coherences in 13CH3 spin systems. The gsHZQC sequences provide improved resolution for medium-sized proteins or larger ones with flexible regions by active suppression of outer components of the HZQC multiplet using a methyl multiplet filter. Sensitivity of the experiments also is improved by incorporation of 13C polarization enhancement while minimizing the number of 1H inversion pulses. Addition of a Hahn-echo element to the gsHZQC experiment enables measurement of relaxation rate constants for zero- and double-quantum coherences while maintaining zero-quantum coherence during t1. The new gsHZQC experiments extend the applicability of methyl-TROSY experiments for investigations of structure, interactions, and dynamics of proteins.
Supplementary Material
Acknowledgments
A.G.P. and M.L.G. acknowledge support from National Institute of Health grants GM50291 and GM089047, respectively. A.G.P. is a member of the New York Structural Biology Center (NYSBC). The NYSBC is a STAR center supported by the New York State Office of Science, Technology and Academic Research. Data acquired at 18.8 and 21.1 T were collected at the NYSBC. The 900 MHz (21.1 T) spectrometers were purchased with funds from the National Institute of Health (USA), the Keck Foundation (New York State), and the NYC Economic Development Corporation. A.G.P. and M.L.G. thank Mark Rance (University of Cincinnati) and Daròn Freedberg (CBER/FDA) for helpful scientific discussions.
Footnotes
Electronic supplementary material The online version of this article (doi:10.1007/s10858-011-9533-1) contains supplementary material, which is available to authorized users.
Contributor Information
Michelle L. Gill, Department of Biochemistry and Molecular Biophysics, Columbia University, 630 West 168th Street, New York, NY 10032, USA
Arthur G. Palmer, III, Email: agp6@columbia.edu, Department of Biochemistry and Molecular Biophysics, Columbia University, 630 West 168th Street, New York, NY 10032, USA.
References
- Butterwick JA, Patrick Loria J, Astrof NS, Kroenke CD, Cole R, Rance M, Palmer AG. Multiple time scale backbone dynamics of homologous thermophilic and mesophilic ribonuclease HI enzymes. J Mol Biol. 2004;339:855–871. doi: 10.1016/j.jmb.2004.03.055. [DOI] [PubMed] [Google Scholar]
- Cavanagh J, Palmer AG, Wright PE, Rance M. Sensitivity improvement in proton-detected two-dimensional heteronuclear relay spectroscopy. J Magn Reson. 1991;91:429–436. (1969) [Google Scholar]
- Davis DG. Elimination of baseline distortions and minimization of artifacts from phased 2D NMR spectra. J Magn Reson. 1989;81:603–607. (1969) [Google Scholar]
- Delaglio F, Grzesiek S, Vuister GW, Zhu G, Pfeifer J, Bax A. NMRPipe: a multidimensional spectral processing system based on UNIX pipes. J Biomol NMR. 1995;6:277–293. doi: 10.1007/BF00197809. [DOI] [PubMed] [Google Scholar]
- Findeisen M, Brand T, Berger S. A 1H-NMR thermometer suitable for cryoprobes. Magn Reson Chem. 2007;45:175–178. doi: 10.1002/mrc.1941. [DOI] [PubMed] [Google Scholar]
- Gardner KH, Kay LE. Production and incorporation of 15N, 13C, 2H (1H-δ1 methyl) isoleucine into proteins for multidimensional NMR studies. J Am Chem Soc. 1997;119:7599–7600. [Google Scholar]
- Goto NK, Gardner KH, Mueller GA, Willis RC, Kay LE. A robust and cost-effective method for the production of Val Leu, Ile (δ1) methyl-protonated 15N-, 13C-, 2H-labeled proteins. J Biomol NMR. 1999;13:369–374. doi: 10.1023/a:1008393201236. [DOI] [PubMed] [Google Scholar]
- Hollien J, Marqusee S. A thermodynamic comparison of mesophilic and thermophilic ribonucleases H. Biochemistry. 1999;38:3831–3836. doi: 10.1021/bi982684h. [DOI] [PubMed] [Google Scholar]
- Kay L, Keifer P, Saarinen T. Pure absorption gradient enhanced heteronuclear single quantum correlation spectroscopy with improved sensitivity. J Am Chem Soc. 1992;114:10663–10665. [Google Scholar]
- Korzhnev DM, Kloiber K, Kanelis V, Tugarinov V, Kay LE. Probing slow dynamics in high molecular weight proteins by methyl-TROSY NMR spectroscopy: application to a 723-residue enzyme. J Am Chem Soc. 2004;126:3964–3973. doi: 10.1021/ja039587i. [DOI] [PubMed] [Google Scholar]
- Kroenke CD, Loria JP, Lee LK, Rance M, Palmer AG. Longitudinal and transverse 1H–15N dipolar 15N chemical shift anisotropy relaxation interference: unambiguous determination of rotational diffusion tensors and chemical exchange effects in biological macromolecules. J Am Chem Soc. 1998;120:7905–7915. [Google Scholar]
- Mandel AM, Akke M, Palmer AG., III Backbone dynamics of Escherichia coli ribonuclease HI: correlations with structure and function in an active enzyme. J Mol Biol. 1995;246:144–163. doi: 10.1006/jmbi.1994.0073. [DOI] [PubMed] [Google Scholar]
- Mandel AM, Akke M, Palmer AG. Dynamics of ribonuclease H: temperature dependence of motions on multiple time scales. Biochemistry. 1996;35:16009–16023. doi: 10.1021/bi962089k. [DOI] [PubMed] [Google Scholar]
- Ollerenshaw JE, Tugarinov V, Kay LE. Methyl TROSY: explanation and experimental verification. Magn Reson Chem. 2003;41:843–852. [Google Scholar]
- Ollerenshaw JE, Tugarinov V, Skrynnikov NR, Kay LE. Comparison of 13CH3, 13CH2D, and 13CHD2 methyl labeling strategies in proteins. J Biomol NMR. 2005;33:25–41. doi: 10.1007/s10858-005-2614-2. [DOI] [PubMed] [Google Scholar]
- Palmer AG, Cavanagh J, Wright PE, Rance M. Sensitivity improvement in proton-detected two-dimensional heteronuclear correlation NMR spectroscopy. J Magn Reson. 1991;93:151–170. (1969) [Google Scholar]
- Palmer AG, Cavanagh J, Byrd RA, Rance M. Sensitivity improvement in three-dimensional heteronuclear correlation NMR spectroscopy. J Magn Reson. 1992;96:416–424. (1969) [Google Scholar]
- Rance M, Byrd RA. Obtaining high-fidelity spin-1/2 powder spectra in anisotropic media: phase-cycled Hahn echo spectroscopy. J Magn Reson. 1983;52:221–240. (1969) [Google Scholar]
- Shaka AJ, Keeler J, Frenkiel T, Freeman R. An improved sequence for broadband decoupling: WALTZ-16. J Magn Resn. 1983;52:335–338. (1969) [Google Scholar]
- Tugarinov V, Kay LE. 1H, 13C–1H, 1H dipolar cross-correlated spin relaxation in methyl groups. J Biomol NMR. 2004;29:369–376. doi: 10.1023/B:JNMR.0000032562.07475.7f. [DOI] [PubMed] [Google Scholar]
- Tugarinov V, Hwang PM, Ollerenshaw JE, Kay LE. Cross-correlated relaxation enhanced 1H–13C NMR spectroscopy of methyl groups in very high molecular weight proteins and protein complexes. J Am Chem Soc. 2003;125:10420–10428. doi: 10.1021/ja030153x. [DOI] [PubMed] [Google Scholar]
- Tugarinov V, Sprangers R, Kay LE. Line narrowing in methyl-TROSY using zero-quantum 1H–13C NMR spectroscopy. J Am Chem Soc. 2004;126:4921–4925. doi: 10.1021/ja039732s. [DOI] [PubMed] [Google Scholar]
- Yamazaki T, Yoshida M, Nagayama K. Complete assignments of magnetic resonances of ribonuclease H from Escherichia coli by double- and triple-resonance 2D and 3D NMR spectroscopies. Biochemistry. 1993;32:5656–5669. doi: 10.1021/bi00072a023. [DOI] [PubMed] [Google Scholar]
- Yang W, Hendrickson WA, Kalman ET, Crouch RJ. Expression, purification, and crystallization of natural and selenomethionyl recombinant ribonuclease H from Escherichia coli. J Biol Chem. 1990;265:13553–13559. [PubMed] [Google Scholar]
Associated Data
This section collects any data citations, data availability statements, or supplementary materials included in this article.


