Abstract
Discovery of essential genes in pathogenic organisms is an important step in the development of new medication. Despite a growing number of genome data available, little is known about C. albicans, a major fungal pathogen. Most of the human population carries C. albicans as commensal, but it can cause systemic infection that may lead to the death of the host if the immune system has deteriorated. In many organisms central nodes in the interaction network (hubs) play a crucial role for information and energy transport. Knock-outs of such hubs often lead to lethal phenotypes making them interesting drug targets. To identify these central genes via topological analysis, we inferred gene regulatory networks that are sparse and scale-free. We collected information from various sources to complement the limited expression data available. We utilized a linear regression algorithm to infer genome-wide gene regulatory interaction networks. To evaluate the predictive power of our approach, we used an automated text-mining system that scanned full-text research papers for known interactions. With the help of the compendium of known interactions, we also optimize the influence of the prior knowledge and the sparseness of the model to achieve the best results. We compare the results of our approach with those of other state-of-the-art network inference methods and show that we outperform those methods. Finally we identify a number of hubs in the genome of the fungus and investigate their biological relevance.
Keywords: network inference, linear regression, LASSO, reverse engineering, scale-free, Candida albicans, hubs, prior knowledge
1. Introduction
Candida albicans is the most important human-pathogenic fungus (D’Enfert and Hube, 2007). Most of the time, it lives as a commensal in the microbial flora of the host. However, if the immune system of the host is impaired, it can switch to an aggressive pathogen that can cause systematic infections with a high mortality rate (Wilson et al., 2002). An important prerequisite of C. albicans virulence is its ability to react upon environmental changes such as temperature shifts, pH value changes, or nutrition supply. C. albicans can react to these environmental conditions by altering its gene expression pattern. These alteration can create phenotype changes, like switching from typical yeast-like ovoid to hyphal growth form (Hube, 2004). These changes in morphology are a crucial part of the infectious ability of C. albicans. Understanding how these gene expression alterations change the morphology of the fungus can uncover new therapeutic methods to counter fungal infections.
Gene expression regulation is primarily mediated by transcription factors but also by post-translational modification or other mechanisms. Reverse engineering of such mechanisms is an important part of systems biology (Hecker et al., 2009a). It aims to uncover essential interactions within the genome of the organism. This research is facilitated by the growing number of expression data available (Edgar et al., 2002).
Network inference approaches have been successfully applied in order to infer small-scale networks and to predict gene interactions for pathogenic fungi (Guthke et al., 2005, 2007; Linde et al., 2010). Such networks investigate certain aspects of regulatory processes and provide valuable information regarding specific gene interactions. However, the number of genes that can be considered using such approaches is limited. Topological analysis of the full genome is beyond the scope of this approach.
Different methods for the reverse engineering of genome-wide inferences have been developed. A common approach is the use of information-theoretic principles. Some define interactions between genes as statistical dependencies between gene expression profiles (Margolin et al., 2006). The idea is that statistical dependencies, that can not be explained as artifacts of other dependencies in the network, are likely to identify direct regulatory interactions. These methods are also called mutual information. Common representatives are ARACNE (Margolin et al., 2006), MRNET (Meyer et al., 2007), and CLRNET (Faith et al., 2007). Due to the nature of these methods, mutual information networks are primarily undirected, e.g., the network does not discriminate between source and target gene of an interaction.
In this work, we use a system of linear equations to model the regulatory interactions between genes. The idea of this approach is to model the expression of one gene as the weighted sum of the expression of other genes and external perturbations (Gustafsson et al., 2004). The advantage of this approach is, that it can describe gene interaction in a quantitative way that takes the direction of the interaction into account, i.e., it discriminates between the source and the target gene of an interaction. Topological motives like feedback loops can be described as well as dynamic processes within gene regulatory interactions (Hecker et al., 2009b). A commonly used algorithm is the so-called LASSO (Tibshirani, 1994). It works well under the condition, that there are more genes than samples, which is mostly the case in biological data. This approach has already been implemented for pathogenic fungi like C. albicans (Linde et al., 2011). However, these models have not been scale-free.
One of the most severe problems researchers face while defining network inferences for fungi is the dearth of available information. So far, there are only few data sets for pathogenic fungi available, mostly from microarray experiments. This problem becomes even more serious when modeling networks including a large number of genes. One approach is the use of proposed gene interactions called prior knowledge, taken from data sources different from gene expression data. This concept has been successfully implemented in earlier approaches (Linde et al., 2011) and was used in this work as well.
Topological analysis of large-scale networks can unravel interesting interactions and regulatory genes with a high number of interaction partners called hubs. Hubs are essential for the viability of the organism since they are a central part of the interaction network architecture. Because of the large number of interactions, it is very likely to destroy an essential interaction by knocking out a hub (Han et al., 2004; He and Zhang, 2006). This property makes hubs interesting drug targets. Frequently, genome-wide models do not meet the requirement of scale-freeness, i.e., the distribution of connections between nodes does not follow a power-law. However, scale-freeness is a pre-condition for topological analysis and the detection of hubs because most biological networks exhibit such a power-law distribution (Barabási and Oltvai, 2004).
In this study, we combine the LASSO with the ridge regression, a method of regularization, as proposed by Gustafsson et al. (2004), to infer scale-free networks. We extend this approach to our gene data by implementing different sources of prior knowledge to our gene expression data. We use an automatic relation extraction system to scan 9,000 research papers in order to get a compendium of currently known interactions to compare and evaluate our networks. We then perform topological analysis on these networks to identify hubs. We investigate these hubs for their biological function. We also compare our algorithm to state-of-the-art methods.
2. Materials and Methods
2.1. Data
2.1.1. Gene expression data set
We took genome-wide gene expression data of C. albicans from a collection of Ihmels et al. (2005). The data set consists of transcription data of 6,167 open reading frames (ORF) under 198 conditions ranging from drug application, via stress exposition to response to mating pheromone. The set contains transcriptional profiles of cells growing as yeast or hyphal cells taken from four independent microarray designs. 16.7% of the data are missing. Four hundred eleven ORFs have more than 50% missing values. We tested different imputation methods to complete the data set and applied the best performing method LLS, since the used network inference method requires complete observations. We applied the Local Least Squares (LLS) imputation method as provided by the pca Method (Stacklies et al., 2007) package for R (R Development Core Team, 2009).
2.1.2. Gold standard
We evaluated the performance of the network inference approaches with emphasis on the reliability of the predicted interactions. The data set on which this evaluation was based was generated using text-mining technology. Accordingly, we automatically extracted information about gene regulatory interactions from full-text research articles in order to collect a set of known interactions published in the literature. Text mining was based on JReX (Buyko et al., 2011), a high-performance machine-learning relation extraction system. JReX identifies pairs of genes as interaction pairs exploiting rich syntactic and semantic information. Using this system, we harvested gene regulation information from about 9,000 open-access research papers about C. albicans. The resulting collection contains 509 genes and 1,016 interactions between them. We are very much aware of the fact that this procedure has inherent limitations (e.g., f-scores ranging between 50 and 60% are consistently reported for such approaches (Kim et al., 2011)), but in the absence of a comprehensive manually generated gold standard, we used this automatically built gold standard to evaluate the networks inferred using different methods and parameter settings. Only 503 genes of the gold standard are part of our gene expression data set. Therefore, these 503 gold genes were used to optimize different parameters.
2.2. Network inference
To infer a regulatory network in C. albicans, we used a modeling approach based on linear regression. This approach describes the expression of a gene xi under condition m as the weighted sum of the expression of the other genes under this condition:
| (1) |
N is the number of genes and xj = xj(1),…,xj(M) describes the expression of gene j under the condition 1 to M. βi,j is the coefficient that describes the influence of gene xj on gene xi. The strength of the interaction is represented by the absolute value of the coefficient. This coefficients can be positive or negative, representing activating or inhibiting relations, respectively. A coefficient equal to zero means there is no interaction between these genes.
The equation system, defined in (1), has more variables than equations, i.e., more genes than samples. To cope with this problem and to enhance the interpretability of the inferred network, we followed the idea of sparseness (Yeung et al., 2002; Leclerc, 2008). This concept tries to maximize the number of zeros in the interaction matrix B = βi,j. To solve this task, (Tibshirani, 1994) proposed the Least Absolute Shrinkage and Selection Operator (LASSO) algorithm. It applies the L1-norm shown in equation (3) on the interaction matrix B and assigns many weights zero. To find the model that fits best to the expression data, we minimized the residual sum of squares (RSS):
where μi is a parameter limiting the absolute sum of all βi,·. To account for the varying reliability of the prior knowledge, we introduce an additional weight parameter ωi,j, denoting the reliability of interaction βi,j. Hereby we follow a knowledge-driven approach and extend the equation (3) as presented by Zou (2006):
| (4) |
By default, all interactions ωi,j have a value of 1. A small value of ωi,j means that the interaction is reliable, while larger ωi,j indicate questionable interactions. Setting ωi,j = 0 means that we trust xi,j unconditionally.
The prior knowledge was incorporated by the creation of an N × N penalty matrix Ω. The component ωi,j of the matrix Ω is multiplied by βi,j during the computation of the threshold shown in equation (4). If a source of prior knowledge predicts an interaction between two edges i and j, the penalty of this interaction is ωi,j = ϵn where n is the number of prior knowledge sources that support the interaction. If an interaction is not supported by any prior knowledge, then ωi,j = 1.
To determine the optimal value for μi, we follow the approach suggested by Gustafsson et al. (2004, 2005). This approach first minimizes the L2-norm:
| (5) |
and set The networks created using this method were proved to be scale-free.
The inference of genome-wide networks is computationally intensive. However, the calculation of the regression for one gene is independent from the regression of other genes. This way, the network inference factorizes and we used parallel computing to speed up the inference.
3. Results
3.1. Parameter estimation and network assessment
The result of the inference depends on different parameters, that need to be estimated. The parameter ϵ defines the influence of the prior knowledge. It is too time consuming to perform an exhaustive search over this parameter exploiting the whole expression data set. Therefore, we only selected the expression data of genes, that are included in the gold standard. This subset contained the expression data from 503 genes, called gold genes. With this subset we investigated the influence of the prior knowledge by using a search over ten equidistant values each within the intervals 0.01, …, 0.1 and 0.1, …, 1 and calculated the F-measure (Van Rijsbergen, 1979) of the inferred networks. The F-measure incorporates the trade off between the recall (completeness of the identified interactions within the gold standard) and the precision (ratio of correctly identified interactions).
| (6) |
The second parameter to optimize determines the size of the network, i.e., the number of inferred interactions. LASSO works with constraint introduced by the parameter μi. As suggested by (Gustafsson et al., 2004), we first calculate the parameter via equation (5) and define Gustafsson et al. fixed c at 0.1 and stated that deviating from this value does not result in large changes in the selected interactions and still leads to a scale-free network. Nevertheless, we performed a grid search over 24 different steps for c ranging from 0.00001 to 0.5. We calculated the corresponding F-measure with regard to the gold standard and degree of scale-freeness for all inferred networks.
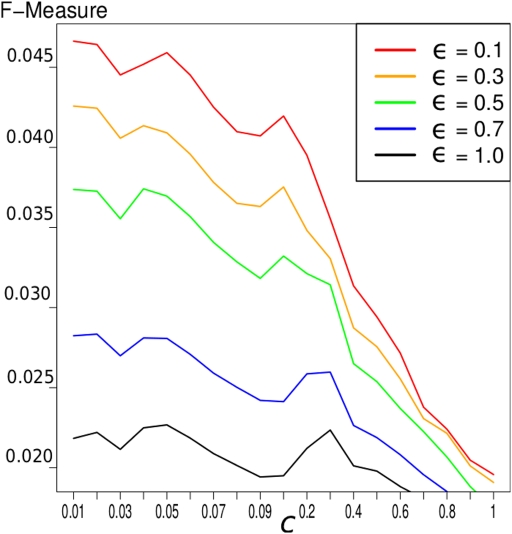
Results show that smaller values for ϵ, i.e., more influence of the prior knowledge, yield higher F-measures. For the BIND prior knowledge, the result of different values of ϵ is depicted in Figure 1. Because of these results, we choose ϵ = 0.1 for the network construction for all known interactions.
Figure 1.
F-measure of the LASSO inference for the 503 gold genes in which the gold standard and the expression data overlap. We exploited the BIND prior knowledge. The different graphs represent different values of ϵ and therefore different weighting of prior knowledge. It indicates that a higher influence of prior knowledge yields better results concerning the F-measure.
To study the influence of the different prior knowledge sources, we first constructed a genome-wide network without including prior knowledge in the model. Subsequently, we constructed networks involving all four sources of prior knowledge individually. After that, we also created one network that used all available prior knowledge to infer a network.
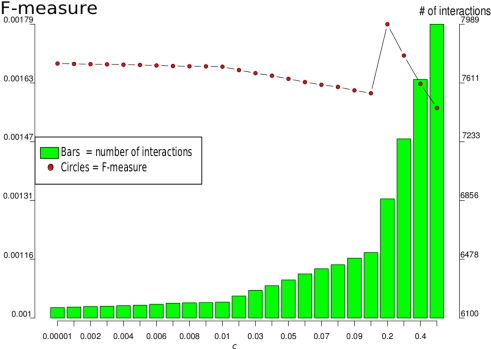
In the following, we took the full-genomic network that was supported by all prior knowledge sources (ALL). Since we computed this network for different network sizes, by variation of parameter c, we selected the one with the highest F-measure, which was c = 0.2, as illustrated in Figure 2.
Figure 2.
F-measures and number of interactions for different values of c for the LASSO-based genome-wide inference that used all genes and all available prior knowledge. The maximum F-measure 0.0018 is reached at c = 0.2 with a network of 6866 interactions between 6,167 genes.
In order to compare our approach to state-of-the-art methods, we also inferred genome-wide networks based on mutual information, like ARACNE (Margolin et al., 2006), MRNET (Meyer et al., 2007), and CLRNET (Faith et al., 2007). The results of the inferred networks can be seen in Table 1.
Table 1.
Results of the genome-wide network inference.
| LASSO | LASSO + FAC | LASSO + PPI | LASSO + TRANS | LASSO + BIND | LASSO + ALL | CLRNET | MRNET | ARACNE | |
|---|---|---|---|---|---|---|---|---|---|
| F-measure | 0.0014 | 0.0015 | 0.0053 | 0.0058 | 0.0067 | 0.0018 | 0.00006 | 0.00006 | 0.0009 |
| No. of interactions | 6,167 | 6,167 | 6,167 | 6,167 | 6,167 | 6,866 | 15,686,064 | 15,329,450 | 39,986 |
The first six rows show the results for LASSO and LASSO with different prior knowledge sources. The sixth row shows the LASSO inference with ALL four sources of prior knowledge. The last three rows show the results for the mutual information-based networks.
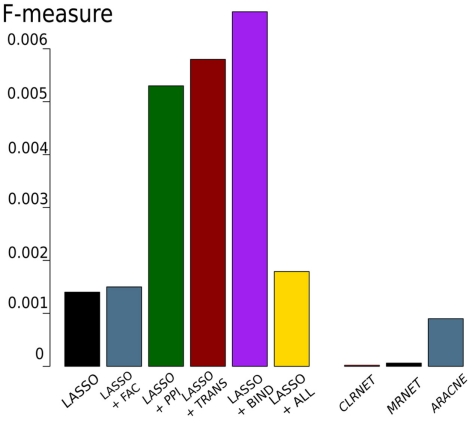
The results of these tests are shown in Figure 3. Comparing the LASSO-based networks without or with different prior knowledge sources, we found that the implementation of prior knowledge clearly improves the performance of the inference, especially when exploiting the BIND set of prior knowledge results in a high F-measure compared to the gold standard. All LASSO-based inferences outperform the networks constructed using mutual information. The inferred networks differ remarkably in size. While the LASSO-based networks are comparably sparse, having around 6,200–6,900 interactions, the network inferred by ARACNE has around 40,000 interactions. CLRNET and MRNET inferred networks contain about 15,000,000 interactions.
Figure 3.
F-measure obtained by LASSO-based genome-wide network inferences (left) with or without prior knowledge (FAC, PPI, TRANS, BIND) and with all four prior knowledge sources (ALL). The three bars on the right show the results of the mutual information-based networks.
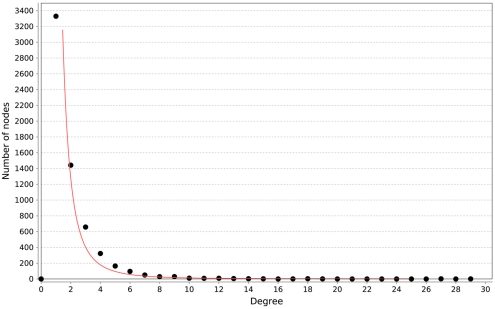
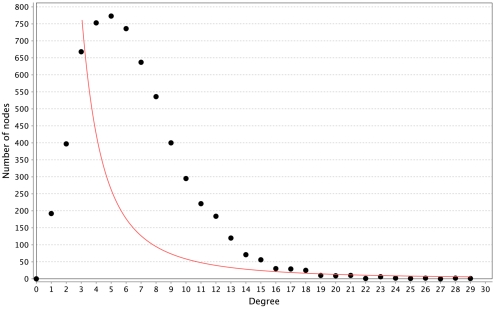
All of the networks inferred by LASSO are scale-free, as can be seen in Figure 4. We calculated the correlation of the degree distribution to the power-law distribution using Cytoscape (Smoot et al., 2011). The LASSO network that implemented all prior knowledge sources has a correlation coefficient of 0.88. This was the lowest correlation of all LASSO-based methods. In contrast, none of the mutual information networks are scale-free, see Figure 5.
Figure 4.
Distribution of degrees for the LASSO-based inference without prior knowledge. The red line represents the fitted power-law. The correlation coefficient of the logarithmical data is 0.95.
Figure 5.
Distribution of degrees for the ARACNE-based inference. The red line represents the fitted power-law. The correlation coefficient of the logarithmical data is 0.08.
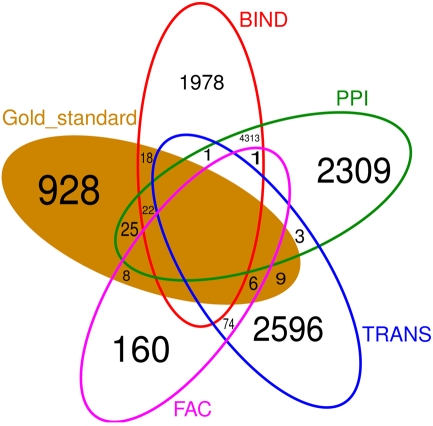
Figure 6 shows that there is little overlap between the gold standard, which we extracted from literature concerning C. albicans, and the prior knowledge, extracted from data bases where C. albicans is underrepresented. Besides BIND and PPI, none of the prior knowledge sources have a large overlap. Also the prior knowledge sources and the gold standard barely overlap with each other. FAC is by far the smallest of the prior knowledge sources (249 interactions) and only 14 of them are also part of the gold standard. Therefore, it is not surprising, that the network inferred exploiting FAC yields the smallest improvement concerning the F-measure over the network inferred without prior knowledge (Figure 3). The LASSO without the use of prior knowledge reaches a F-measure of 0.0014 and the use of the FAC improves this result to 0.0015. With the information of PPI, LASSO reaches a F-measure of 0.0053, with TRANS 0.0058 and 0.0067 with BIND.
Figure 6.
Venn diagram of the four different prior knowledge sources and the gold standard. Empty fields contain no common interaction. There is little overlap between the sources of prior knowledge as well as between the prior knowledge and the gold standard.
3.2. Central genes
This study aims at identifying hubs, i.e., genes with high influence on other genes. (Han et al., 2004) propose that hubs should have at least six interactions with other genes. Since our networks have more nodes than those by Han, we considered an out degree of seven or more to be reasonable. We found 126 genes with an out degree of at least seven and examined them for their function (Arnaud et al., 2010). Ten of them are shown in Table 2.
Table 2.
Ten genes with the highest out degree of the LASSO network inferred with all four sources of prior knowledge (ALL).
| Gene name | Out degree |
|---|---|
| FET31 | 29 |
| orf19.7450 | 28 |
| orf19.1300 | 25 |
| MAL2 | 20 |
| orf19.4678 | 19 |
| orf19.1735 | 18 |
| SGO1 | 17 |
| orf19.6715 | 17 |
| Yor353c | 15 |
| PSA2 | 15 |
Since there is little information available for C. albicans, most of the hub genes we found are still not functionally annotated. We often only found information from ortholog genes in S. cerevisiae. The information found indicates that the putative hub genes regulate various cell functions. At least 16 of the 126 hubs are influenced by known antimycotica like amphotericin B, caspofungin, or the azole group as shown in Table 3. Thirty-one of the identified hub genes are still not annotated and no functional information is available.
Table 3.
Table of 16 hubs which are sensitive to antifungal treatment.
| Yor353c | Domain protein of RAM cell wall integrity signaling network; role in cell separation, azole sensitivity; required for hyphal growth; lacks orthologs in higher eukaryotes |
| orf19.5975 | Putative zinc finger DNA-binding transcription factor; fluconazole-downregulated; expression regulated during planktonic growth |
| Hmg2 | HMG-CoA reductase; enzyme of sterol pathway; inhibited by lovastatin; gene not transcriptionally regulated in response to lovastatin and fluconazole |
| ASR1 | Putative heat shock protein; transcription regulated by cAMP, osmotic stress, ciclopirox olamine, ketoconazole; stationary phase enriched |
| YJR073c | Phosphatidylethanolamine N-methyltransferase of phosphatidylcholine biosynthesis; downregulation correlates with clinical development of fluconazole resistance; amphotericin B; and caspofungin repressed |
| Cor1 | Putative ubiquinol-cytochrome-c reductase; amphotericin B induced; repressed by nitric oxide; protein level decreases in stationary phase cultures |
| Taf19 | Putative TFIID subunit; mutation confers hypersensitivity to amphotericin B |
| OPT8 | Possible oligopeptide transporter; induced by nitric oxide, amphotericin B |
| AGP2 | Amino acid permease; hyphal downregulated; regulated upon white-opaque switching; induced in core caspofungin response, during cell wall regeneration, or by flucytosine; fungal-specific |
| FET31 | Putative iron transport multicopper oxidase precursor; flucytosine induced; caspofungin repressed |
| HIP1 | Similar to amino acid permeases; alkaline upregulated; flucytosine induced; fungal-specific (no human or murine homolog) |
| APT1 | Adenine phosphoribosyltransferase; flucytosine induced; repressed by nitric oxide; protein level decreased in stationary phase yeast cultures |
| ARX1 | Putative ribosomal large subunit biogenesis protein; downregulated during core stress response; decreased expression in response to prostaglandins |
| Ygr090w | Putative U3 snoRNP protein; decreased expression in response to prostaglandins; heterozygous null mutant exhibits resistance to parnafungin |
| NOG1 | Putative GTPase; mutation confers hypersensitivity to 5-fluorocytosine (5-FC), 5-fluorouracil (5-FU), and tubercidin (7-deazaadenosine); decreased expression in response to prostaglandins |
| Imp4 | Putative SSU processome component; decreased expression in response to prostaglandins |
The data was taken from the Candida Genome Database (Arnaud et al., 2010). Antifungal agents are marked in bold.
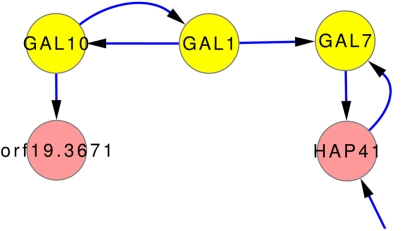
One of the few well studied networks within yeasts is the so-called GAL-network. It has been comprehensively studied for S. cerevisiae (Johnston, 1987; Lohr et al., 1995). It was also used to investigate transcriptional rewiring between tit C. albicans and S. cerevisiae (Rokas and Hittinger, 2007). The GAL-network is responsible for the degradation of galactose. Via GAL10, β-d-galactose is transferred to α-d-galactose which is transferred to α-d-galactose 1-phosphate by GAL1. GAL7 then converts α-d-galactose 1-phosphate to α-d-glucose 1-phosphate. The direct regulation GAL10 → GAL1 → GAL7 is predicted by the inferred network models, as can be seen in Figure 7, even though it is not part of any prior knowledge. Only the interaction GAL1 → GAL7 is part of the gold standard.
Figure 7.
Subnetwork GAL-genes using expression data and the full set of prior knowledge that does not contain these predicted relations. The connection of GAL10, GAL1, and GAL7 is well studied in many yeast forms. The network predictions also contain this relationship.
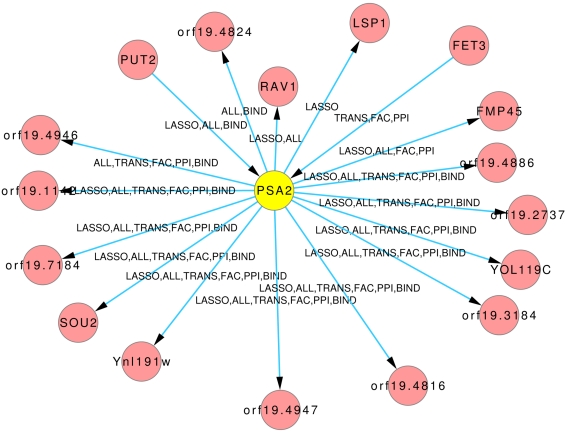
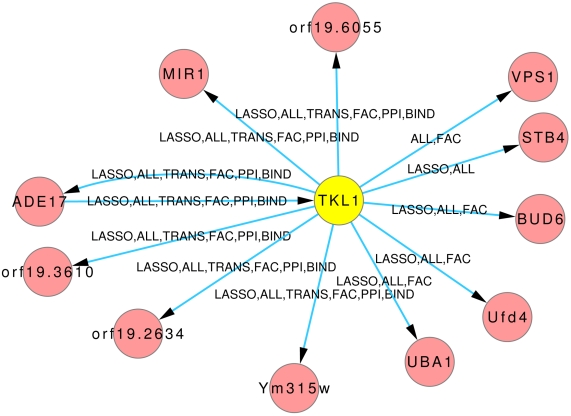
The Figures 8 and 9 illustrate how usage of different sources of prior knowledge affect the connectivity of genes. PSA2 is involved in nucleotidyltransferase activity and biosynthetic processes (Arnaud et al., 2010). TKL1 is involved in transketolase activity, part of the cell wall in yeast form, and possibly essential for the viability of the organism.
Figure 8.
Predicted hub PSA2. The labels on the edges tell which inference and prior knowledge predicted this interaction. LASSO for the LASSO inference without prior knowledge. FAC, BIND, TRANS, and PPI for the inferences with the corresponding prior knowledge source. ALL for the inference that exploited all four prior knowledge sources.
Figure 9.
Predicted hub TKL1. The labels on the edges tell which inference and prior knowledge predicted this interaction. LASSO for the LASSO inference without prior knowledge. FAC, BIND, TRANS, and PPI for the inferences with the corresponding prior knowledge source. ALL for the inference that exploited all four prior knowledge sources.
4. Discussion
We inferred genome-wide scale-free gene regulatory network inference models by exploitation of prior knowledge. The soft integration of prior knowledge can tackle the problem of insufficient data and improves the performance of the inference algorithm. The level of improvement depends on the quality and quantity of the prior knowledge.
The prior knowledge sources BIND, TRANS, and PPI contain much more interactions than FAC and have also more interactions in common with the gold standard. Even though they still have very little overlap with the gold standard, the values of the F-measure improve strongly. A possible explanation is that the prior knowledge supports interactions outside the gold standard, which afterward supports correct interactions from the gold standard.
This emphasizes the importance of extensive data sets to improve the performance of the algorithm. However, the combination of all four sources of prior knowledge does not result in the best performance. With an F-measure of 0.0018, the network is only slightly better than the one created with FAC. This may indicate contradicting information within the prior knowledge sources. Additional refinement concerning weighting prior knowledge with regard to its reliability and the combination of different prior knowledge sources has great potential to further improve the performance of the algorithm.
In general, we can conclude that the higher the influence of the prior knowledge, the better the results concerning the F-measure are, as depicted in Figure 1. But there is another conclusion, that can be seen in this Figure: the improvement with prior knowledge is stronger with smaller c-value, i.e., on smaller networks. This seems reasonable since smaller networks have a more strict constraint and the decreased penalty for interactions supported by the prior knowledge has a stronger effect.
However, the inferences correctly predict parts of the GAL-network, as can be seen in Figure 7. It shows, that the inference can uncover regulations even without the help of prior knowledge. None of the prior knowledge (ALL) suggest these interactions. The gold standard contains only one of them (GAL1 → GAL7).
It should also be noted that the prior knowledge reflects the knowledge of other species, in particular S. cerevisiae, whereas the gold standard contains C. albicans specific knowledge. We are aware that there are substantial differences between the regulation of C. albicans on the one hand and S. cerevisiae and other model organisms on the other hand. Therefore, putting to much weight on the prior knowledge from these model organisms can lead to false conclusions. To minimize the probability of such wrong conclusions, we use the C. albicans specific gold standard to estimate the optimal weighting of the prior knowledge.
All of the presented LASSO-based inferences outperform the models created by mutual information-based methods. CLRNET and MRNET both produced networks with a comparably high number of interactions (15,686,064 with CLRNET and 15,329,450 with MRNET). ARACNE on the other hand produced a network with 39,986. This is by far the smallest of the mutual information-based networks but still about five times larger than the LASSO-based networks. However, with 0.0009 it has a higher F-measure than those of CLRNET and MRNET, which both have a F-measure of 0.00006. It may be correct to assume a correlation between the size of the mutual information-based networks and their F-measure.
The performance evaluation of the network construction algorithm is based on a gold standard obtained by automatic scanning of 9,000 full-text research papers. This leads to a gold standard of 509 genes and 1,016 interactions. Utilizing this compendium of known interactions, we optimize the parameters of the algorithm in order to increase the performance for best results. A major performance criterion is sparseness, in order to balance comprehensiveness and interpretability of the model. We focused on optimal sparseness, in order to locate the most significant interactions and to increase reliability of the predictions. However, compared to the 6,167 genes of the genome-scale networks, this gold standard is still far from adequate. Therefore, the evaluation of the models by comparison to the gold standard may favor smaller networks.
The combination of these features with the requirement for scale-freeness is a novel approach. As this is also true for most biological networks and therefore a requirement for a reasonable topological analysis to uncover hubs. Since hubs are of great interest as potential drug targets or biomarker for the development of novel therapies against fungal infections, we concentrated our effort on such a topological analysis and uncovered a list of hubs with many not yet described. Further investigation in this field is still required and continuous improvements in the available data will also enhance the predictive power of our approach.
To further check causality of the predicted gene-to-gene relations, the concept of Granger causality modeling could be applied as proposed by Shojaie and Michailidis (2010) by truncating LASSO penalty. However, this approach requires time series data whereas the data set analyzed in the present work comprises both, time series and steady state data under different conditions.
We applied our approach to the non-model organism C. albicans since there is still little known about this human pathogenic fungus. However, our approach is not limited to C. albicans and can be applied to other organisms, where little knowledge is available, as well.
Conflict of Interest Statement
The authors declare that the research was conducted in the absence of any commercial or financial relationships that could be construed as a potential conflict of interest.
Acknowledgments
Robert Altwasser and Jörg Linde were supported by the excellence graduate school Jena School for Microbial Communication (JSMC).
References
- Arnaud M. B., Costanzo M. C., Skrzypek M. S., Shah P., Binkley G., Lane C., Miyasato S. R., G S. (2010). Candida Genome Database. Available at: http://www.candidagenome.org/ [DOI] [PMC free article] [PubMed]
- Barabási A.-L., Oltvai Z. N. (2004). Network biology: understanding the cell’s functional organization. Nat. Rev. Genet. 5, 101–113 10.1038/nrg1272 [DOI] [PubMed] [Google Scholar]
- Buyko E., Faessler E., Wermter J., Hahn U. (2011). Syntactic simplification and semantic enrichment – trimming dependency graphs for event extraction. Comput. Intell. 27, 610–644 10.1111/j.1467-8640.2011.00402.x [DOI] [Google Scholar]
- D’Enfert C., Hube B. (2007). Candida: Comparative and Functional Genomics. Norfolk: Caister Academic Press [Google Scholar]
- Edgar R., Domrachev M., Lash A. E. (2002). Gene expression omnibus: Ncbi gene expression and hybridization array data repository. Nucleic Acids Res. 30, 207–210 10.1093/nar/30.1.207 [DOI] [PMC free article] [PubMed] [Google Scholar]
- Faith J. J., Hayete B., Thaden J. T., Mogno I., Wierzbowski J., Cottarel G., Kasif S., Collins J. J., Gardner T. S. (2007). Large-scale mapping and validation of Escherichia coli transcriptional regulation from a compendium of expression profiles. PLoS Biol. 5, e8. 10.1371/journal.pbio.0050008 [DOI] [PMC free article] [PubMed] [Google Scholar]
- Gustafsson M., Hörnquist M., Lombardi A. (2004). Large-scale reverse engineering by the lasso. Available at: http://arxiv.org/abs/q-bio/0403012v1
- Gustafsson M., Hörnquist M., Lombardi A. (2005). Constructing and analyzing a large-scale gene-to-gene regulatory network lasso-constrained inference and biological validation. IEEE/ACM Trans. Comput. Biol. Bioinform. 2, 254–261 10.1109/TCBB.2005.35 [DOI] [PubMed] [Google Scholar]
- Guthke R., Kniemeyer O., Albrecht D., Brakhage A. A., Möller U. (2007). Discovery of gene regulatory networks in Aspergillus fumigatus. Lect. Notes Bioinform. 4366, 22–41 [Google Scholar]
- Guthke R., Möller U., Hoffmann M., Thies F., Toepfer S. (2005). Dynamic network reconstruction from gene expression data applied to immune response during bacterial infection. Bioinformatics 21, 1626–1634 10.1093/bioinformatics/bti226 [DOI] [PubMed] [Google Scholar]
- Han J.-D. J., Bertin N., Hao T., Goldberg D. S., Berriz G. F., Zhang L. V., Dupuy D., Walhout A. J. M., Cusick M. E., Roth F. P., Vidal M. (2004). Evidence for dynamically organized modularity in the yeast protein-protein interaction network. Nature 430, 88–93 10.1038/nature02795 [DOI] [PubMed] [Google Scholar]
- He X., Zhang J. (2006). Why do hubs tend to be essential in protein networks? PLoS Genet. 2, e88. 10.1371/journal.pgen.0020088 [DOI] [PMC free article] [PubMed] [Google Scholar]
- Hecker M., Goertsches R. H., Engelmann R., Thiesen H.-J., Guthke R. (2009a). Integrative modeling of transcriptional regulation in response to antirheumatic therapy. BMC Bioinformatics 10, 262. 10.1186/1471-2105-10-262 [DOI] [PMC free article] [PubMed] [Google Scholar]
- Hecker M., Lambeck S., Toepfer S., van Someren E., Guthke R. (2009b). Gene regulatory network inference: data integration in dynamic models – a review. BioSystems 96, 86–103 10.1016/j.biosystems.2008.12.004 [DOI] [PubMed] [Google Scholar]
- Hube B. (2004). From commensal to pathogen: stage- and tissue-specific gene expression of Candida albicans. Curr. Opin. Microbiol. 7, 336–341 10.1016/j.mib.2004.06.003 [DOI] [PubMed] [Google Scholar]
- Ihmels J., Bergmann S., Berman J., Barkai N. (2005). Comparative gene expression analysis by a differential clustering approach: application to the Candida albicans transcription program. PLoS Genet. 1, e39. 10.1371/journal.pgen.0010039 [DOI] [PMC free article] [PubMed] [Google Scholar]
- Johnston M. (1987). A model fungal gene regulatory mechanism: the gal genes of Saccharomyces cerevisiae. Microbiol. Rev. 51, 458–476 [DOI] [PMC free article] [PubMed] [Google Scholar]
- Kim J.-D., Ohta T., Pyysalo S., Kano Y., Tsujii J. (2011). Extracting bio-molecular events from literature – the bionlp’09 shared task. Comput. Intell. 27, 513–540 10.1111/j.1467-8640.2011.00398.x [DOI] [Google Scholar]
- Leclerc R. D. (2008). Survival of the sparsest: robust gene networks are parsimonious. Mol. Syst. Biol. 4, 213. 10.1038/msb.2008.52 [DOI] [PMC free article] [PubMed] [Google Scholar]
- Linde J., Buyko E., Altwasser R., Hahn U., Guthke R. (2011). Full-Genomic Network Inference for Non-Model Organisms: A Case Study for the Fungal Pathogen Candida albicans. Paris: WASET [Google Scholar]
- Linde J., Wilson D., Hube B., Guthke R. (2010). Regulatory network modelling of iron acquisition by a fungal pathogen in contact with epithelial cells. BMC Syst. Biol. 4, 148. 10.1186/1752-0509-4-148 [DOI] [PMC free article] [PubMed] [Google Scholar]
- Lohr D., Venkov P., Zlatanova J. (1995). Transcriptional regulation in the yeast gal gene family: a complex genetic network. FASEB J. 9, 777–787 [DOI] [PubMed] [Google Scholar]
- Margolin A. A., Nemenman I., Basso K., Wiggins C., Stolovitzky G., Favera R. D., Califano A. (2006). ARACNE: an algorithm for the reconstruction of gene regulatory networks in a mammalian cellular context. BMC Bioinformatics 7(Suppl.1), S7 10.1186/1471-2105-7-S1-S7 [DOI] [PMC free article] [PubMed] [Google Scholar]
- Meyer P. E., Kontos K., Lafitte F., Bontempi G. (2007). Information-theoretic inference of large transcriptional regulatory networks. EURASIP J. Bioinform. Syst. Biol. 2007, 8–8 10.1155/2007/79879 [DOI] [PMC free article] [PubMed] [Google Scholar]
- R Development Core Team. (2009). R: A Language and Environment for Statistical Computing. Vienna: R Foundation for Statistical Computing [Google Scholar]
- Rokas A., Hittinger C. T. (2007). Transcriptional rewiring: the proof is in the eating. Curr. Biol. 17, R626–R628 10.1016/j.cub.2007.06.025 [DOI] [PubMed] [Google Scholar]
- Shojaie A., Michailidis G. (2010). Discovering graphical granger causality using the truncating lasso penalty. Bioinformatics 26, i517–i523 10.1093/bioinformatics/btq377 [DOI] [PMC free article] [PubMed] [Google Scholar]
- Smoot M. E., Ono K., Ruscheinski J., Wang P.-L., Ideker T. (2011). Cytoscape 2.8: new features for data integration and network visualization. Bioinformatics 27, 431–432 10.1093/bioinformatics/btr045 [DOI] [PMC free article] [PubMed] [Google Scholar]
- Stacklies W., Redestig H., Scholz M., Walther D., Selbig J. (2007). pcaMethods – a bioconductor package providing pca methods for incomplete data. Bioinformatics 23, 1164–1167 10.1093/bioinformatics/btm069 [DOI] [PubMed] [Google Scholar]
- Tibshirani R. (1994). Regression shrinkage and selection via the lasso. J. R. Stat. Soc. B 58, 267–288 [Google Scholar]
- Van Rijsbergen C. (1979). Information Retrieval, 2nd edn London: Butterworths [Google Scholar]
- Wilson L. S., Reyes C. M., Stolpman M., Speckman J., Allen K., Beney J. (2002). The direct cost and incidence of systemic fungal infections. Value Health 5, 26–34 10.1046/j.1524-4733.2002.51108.x [DOI] [PubMed] [Google Scholar]
- Yeung M. K. S., Tegnr J., Collins J. J. (2002). Reverse engineering gene networks using singular value decomposition and robust regression. Proc. Natl. Acad. Sci. U.S.A. 99, 6163–6168 10.1073/pnas.092576199 [DOI] [PMC free article] [PubMed] [Google Scholar]
- Zou H. (2006). The adaptive lasso and its oracle properties. J. Am. Stat. Assoc. 101, 1418–1429 10.1198/016214506000000735 [DOI] [Google Scholar]


